MOLECULAR HYDROGEN IN INFRARED CIRRUS
Abstract
We combine data from our recent FUSE survey of interstellar molecular hydrogen absorption toward 50 high-latitude AGN with COBE-corrected IRAS 100 m emission maps to study the correlation of infrared cirrus with H2. A plot of the H2 column density vs. IR cirrus intensity shows the same transition in molecular fraction, , as seen with total hydrogen column density, NH. This transition is usually attributed to H2 “self-shielding”, and it suggests that many diffuse cirrus clouds contain H2 in significant fractions, 1–30%. These clouds cover % of the northern sky at , at temperature-corrected 100 m intensities MJy sr-1. The sheetlike cirrus clouds, with hydrogen densities cm-3, may be compressed by dynamical processes at the disk-halo interface, and they are conducive to H2 formation on grain surfaces. Exploiting the correlation between NH2 and 100 m intensity, we estimate that cirrus clouds at contain in H2. Extrapolated over the inner Milky Way, the cirrus may contain of H2 and in total gas mass. If elevated to 100 pc, their gravitational potential energy is erg.
1 INTRODUCTION
In an attempt to understand the molecular content and physical characteristics of interstellar gas in the low Galactic halo, we exploit infrared and ultraviolet data from two NASA satellites: the Infrared Astronomical Satellite (IRAS) mission of 1983 and the Far Ultraviolet Spectroscopic Explorer (FUSE) satellite of 1999–2005. The combination of infrared emission and ultraviolet absorption along sight lines to 45 active galactic nuclei (AGN) allows us to correlate the infrared cirrus emission intensity with the molecular hydrogen (H2) absorption column density at select locations at high Galactic latitude.
IRAS mapped the sky in four infrared bands centered on 12, 25, 60, and 100 m. Low et al. (1984) introduced one of the most surprising results from the IRAS maps: diffuse filamentary dust clouds that pervade our Galaxy at high latitudes, even in the direction of the Galactic poles. These “infrared cirrus” clouds are most prominent at long wavelengths, 100 m, but some can be seen in the 60 m, 25 m, and 12 m bands. Comparisons between IRAS dust maps and maps of 21 cm emission reveal a generally good correlation between neutral hydrogen (Hartmann & Burton 1997) and cirrus dust filaments (Figure 1). Because molecular hydrogen (H2) forms catalytically on the surface of dust grains (Hollenbach, Werner, & Salpeter 1971), with significant formation rates for grain temperatures K and gas temperatures K (Hollenbach & McKee 1979; Shull & Beckwith 1982), the cold, dusty conditions of the infrared cirrus clouds are favorable for the formation of H2. Thus, it is plausible that some fraction of the hydrogen atoms in the cirrus clouds are bound into molecules.
Previously, the presence of H2 in infrared cirrus was inferred indirectly. First, under the assumption that the infrared emission and total hydrogen column density, NH, are proportional, regions of high dust/H I ratio, termed “infrared excess”, were attributed to the presence of H2 (de Vries, Heithausen, & Thaddeus 1987; Desert, Bazell, & Boulanger 1988; Reach, Koo, & Heiles 1994; Moritz et al. 1998; Schlegel, Finkbeiner, & Davis 1998, hereafter SFD98). Second, the detection of CO in dense cirrus clouds suggests that the diffuse cirrus clouds should contain H2 as well. Weiland et al. (1986) compared CO maps from Magnani, Blitz, & Mundy (1985) to IRAS maps of infrared cirrus. Each of the 33 CO clouds had a cirrus counterpart with similar morphology. This work established that at least some of the infrared cirrus cloud cores contains CO gas.
Unfortunately, there is currently no experiment that can map diffuse H2 emission, either in the 2.12 m [(1–0) S(1)] vibrational line or in the S(0), S(1), S(2) pure rotational lines at 28 m, 17 m, and 12 m, respectively. Although H2 is over times more abundant than CO, the ultraviolet and infrared fluorescent emission of H2 is very weak. Ultraviolet absorption-line spectroscopy is therefore the primary means for detecting cold H2 in diffuse clouds. However, it requires background sources with sufficient UV flux to provide adequate signal-to-noise ratio (S/N) to detect the weak H2 lines. The first major project to conduct such observations was the Copernicus mission of the 1970s (Spitzer & Jenkins 1975). However, its sensitivity limited the possible background sources to early-type stars within about 500 pc of the Sun. Most OB stars that fit this criterion are at low Galactic latitude, and they suffer from confusion and dust extinction in the Galactic plane. Individual features in the infrared cirrus cannot be discerned at low Galactic latitudes, and these stellar sight lines are not effective probes of the dusty filaments.
The FUSE satellite, which has been observing the ultraviolet sky since 1999, has expanded the opportunities for detecting H2. The increased sensitivity of FUSE ( mag) over Copernicus ( mag) allows us to use more distant stars as well as active galactic nuclei (AGN) as background sources. Our FUSE survey of H2 toward high-latitude AGN (Gillmon et al. 2005) is particularly well suited for probing H2 in infrared cirrus. The high-latitude sight lines avoid the confusion of the Galactic disk, and they provide long path lengths through the Galactic halo. In addition, the random distribution of AGN on the sky samples a range of infrared cirrus emission intensities. The main limitation of using “pencil-beam” (absorption) sight lines to detect H2 in infrared cirrus is the inability to determine whether the gas and dust detected along a given sight line are physically associated. Therefore, we must rely on indirect correlations between cirrus and H2 absorption.
In this paper, we compare the H2 column densities in the survey by Gillmon et al. (2005) with the corresponding infrared cirrus fluxes (SFD98). By establishing a correlation between the two, we assert that at least some of the detected H2 resides in the cirrus clouds. In § 2 we describe the data acquisition and analysis for both IRAS and FUSE. In § 3 we compare the cirrus emission and H2 absorption and discuss the correlation of the two. Exploiting this correlation and summing over the distribution of H2 column densities with 100 m cirrus intensity, we estimate the total H2 mass () in cirrus clouds around the Milky Way. With molecular fractions ranging from 1–30%, the total cirrus mass throughout the Milky Way is . In § 4 we summarize our results and the implications of finding this amount of gas in the low halo of the Milky Way.
2 DATA ACQUISITION AND ANALYSIS
2.1 FUSE Observations
The H2 absorption data were taken from FUSE spectra of AGN, using standard data analysis techniques (Tumlinson et al. 2002; Gillmon et al. 2005). Studies of H2 have been a major part of the FUSE science plan. The satellite, its mission, and its on-orbit performance are described in Moos et al. (2000) and Sahnow et al. (2000). Scientific results on interstellar H2 have appeared in a number of papers (Shull et al. 2000; Snow et al. 2000; Rachford et al. 2002; Richter et al. 2001, 2003; Tumlinson et al. 2002; Shull et al. 2005). The resolution of FUSE varies from across the far-UV band. All observations were obtained in time-tag (TTAG) mode, using the LWRS aperture, with resolution km s-1 at 1050 Å. The S/N of the co-added data ranges from 2–11 per pixel; the S/N per resolution element varies with spectral resolution, which is not fixed in our survey. Most of the data were binned by 4 pixels before analysis, with the rare case of binning by 2 or 8 pixels.
The data in this paper were taken from our high-latitude H2 survey (Gillmon et al. 2005), which describes our search for H2 absorption along 45 sight lines to background AGN at Galactic latitudes . The 45 AGN in the survey by Gillmon et al. (2005) were a subset of the 219 FUSE targets selected in Wakker et al. (2003) as candidates for the analysis of Galactic O VI. These targets probe diffuse gas in both the local Galactic disk and low Galactic halo. Of the available AGN at high latitude, 45 sight lines were chosen, based on an imposed S/N requirement of or with 4-pixel binning. The observed H2 lines arise from the Lyman and Werner electronic transitions, from the ground electronic state, X , to the excited states, B (Lyman bands) and C (Werner bands). The rotational-vibrational lines arise from the ground vibrational state and a range of rotational states. Our analysis was restricted to ten vibrational-rotational bands, Lyman (0–0) to (8–0) and Werner (0–0), which are located between 1000 and 1126 . The vibrational state notation is (). In most sight lines, we observed absorption lines from rotational states –3, and sometimes up to .
The end product of the H2 absorption-line analysis is the column density, NH2 (cm-2), the physical density of H2 molecules, integrated along the sight line. Each absorption line was fitted with a Voigt profile in order to determine the equivalent width, a measure of the absorbed light in the line. The equivalent widths were fitted to a curve of growth, to find the column density, N in each rotational state . The points for each were tied together during the fitting to produce a single, consistent column density for each rotational state, N(). The sum of the column densities in all rotational states then gives the total column density, NH2. FUSE spectra of 87% (39 of 45) of the observed AGN showed detectable H2 absorption, with column densities ranging from NH2 cm-2. The FUSE survey is sensitive to NH2 cm-2, depending on the S/N (2–11 per pixel) and spectral resolution (–20,000).
2.2 IRAS Dust Maps
To obtain infrared cirrus emission intensities (MJy sr-1), we use the 100 m maps presented by SFD98. These were a composite of data from the IRAS mission of 1983 and the COBE mission of 1989–1990, capitalizing on the strengths of each. Because the interstellar dust emits like a “grey body”, the emission intensity is sensitive to the dust temperature. As a result, two regions with the same dust column density but different dust temperatures will have different infrared intensities. To correct for this effect, SFD98 used the ratio of the 100 m and 240 m COBE maps to produce a map of dust color temperature. They used this ratio to correct the 100 m IRAS map so that it is proportional to dust column density. IRAS mapped the sky in four broadband infrared channels, centered at 12, 25, 60, and 100 m with a resolution of , while COBE mapped the sky in 10 broad photometric bands from 1 to 240 m at a resolution of . Before combining the data sets, SFD98 took great care in the difficult removal of the zodiacal foreground emission and IRAS striping artifacts that arise from differences in solar elongation between scans. Confirmed point sources were also removed. The maps were combined in such a way as to preserve the COBE calibration and IRAS resolution.
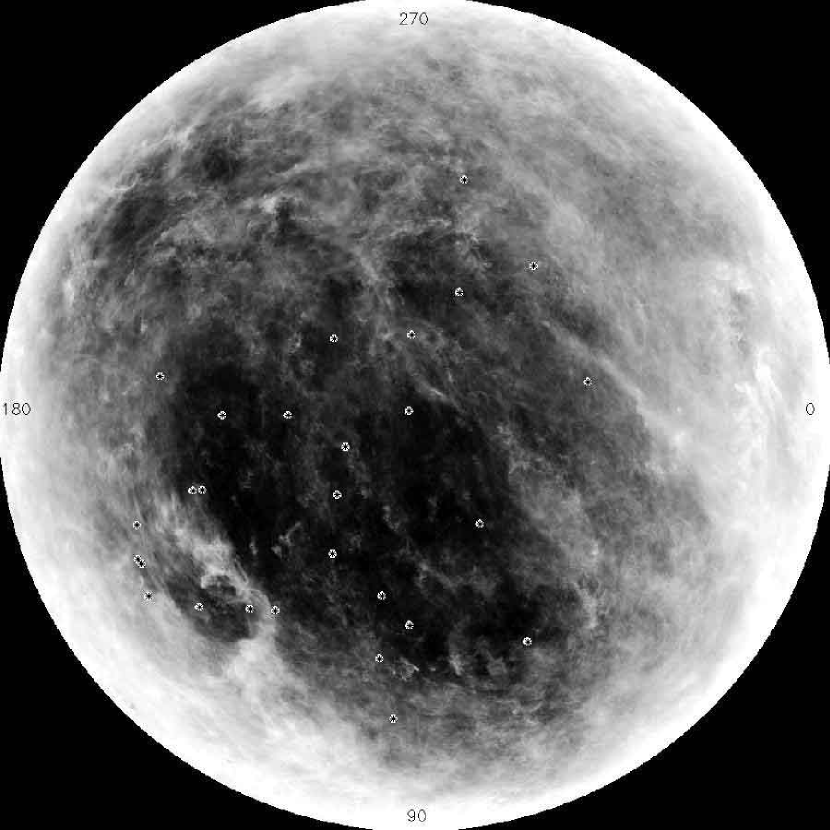
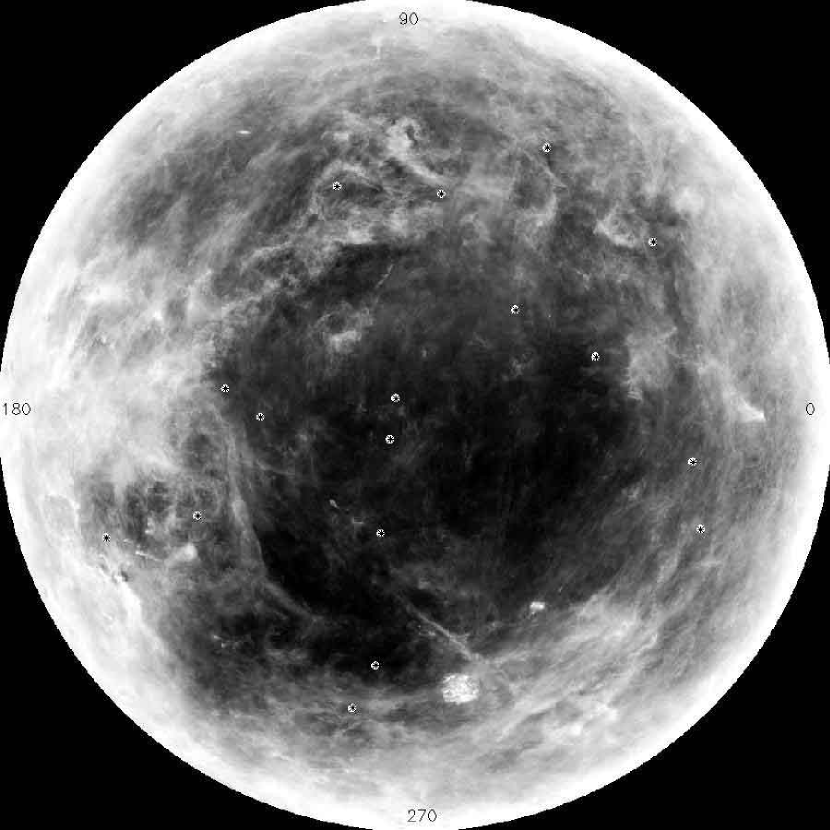
Maps of the temperature-corrected 100 m intensity, , are presented for the northern Galactic hemisphere (Figure 2) and for the southern Galactic hemisphere (Figure 3). We overplot the locations of the 45 sight lines from the FUSE H2 survey: 28 northern AGN and 17 southern AGN.
3 Comparisons of H2 and Infrared Cirrus
3.1 The H2 Self-Shielding Transition in NH
Before the FUSE mission, the direct detection of H2 in infrared cirrus by UV absorption-line spectroscopy was prevented mainly by a lack of background sources at high Galactic latitude. Even though this problem has been alleviated by FUSE’s ability to observe bright AGN as background sources, another problem with absorption-line spectroscopy along “pencil-beam” sight lines comes to the forefront. Absorption studies lack morphological information and cannot provide distances to clouds along the line of sight. Therefore, it is difficult to identify the gas that gives rise to the detected column density. The infrared cirrus problem is a classic case. For any given sight line, it is possible that the H2 absorption is not physically associated with the infrared cirrus along the beam. If this is the case, then comparing NH2 with the cirrus dust column density would lead to erroneous results. It would be helpful to determine whether the diffuse H2 along all sight lines resides in the cirrus. If no other component of the diffuse ISM harbored significant amounts of H2, then NH2 for a given sight line could safely be associated with other cirrus properties.
In this section, we investigate this possibility, based on a property of H2 called “self-shielding”. Following line absorption of UV photons from the mean interstellar radiation field, H2 decays approximately 11% of the time to the dissociative continuum. As a result, the molecular fraction,
| (1) |
is generally larger in clouds with a greater total hydrogen column density, NH = NHI + 2NH2. Molecules on the outside of the cloud shield those in the interior from dissociating UV (Hollenbach, Werner, & Salpeter 1971; Black & Dalgarno 1976; Browning, Tumlinson, & Shull 2003).
In optically thin clouds, the density of molecules can be approximated by the equilibrium between formation and destruction,
| (2) |
In this formula, the numerical value for is scaled to fiducial values of hydrogen density, (30 cm-3), H2 formation rate coefficient, ( cm3 s-1), and mean H2 pumping rate in the FUV Lyman and Werner bands, s-1. The H2 photodissociation rate is written as , where the coefficient is the average fraction of FUV excitations of H2 that result in decays to the dissociating continuum. The H2 formation rate per unit volume is written as , where the coefficient depends on the gas temperature, grain surface temperature, and gas metallicity (). The metallicity dependence comes from the assumed scaling of grain-surface catalysis sites with the grain/gas ratio. For sight lines in the local Galactic disk, this rate coefficient has been estimated (Jura 1974) to range from cm3 s-1 at solar metallicity. This standard value for is expected to apply at suitably low temperatures of gas ( K) and grains ( K) as discussed by Shull & Beckwith (1982) and Hollenbach & McKee (1979).
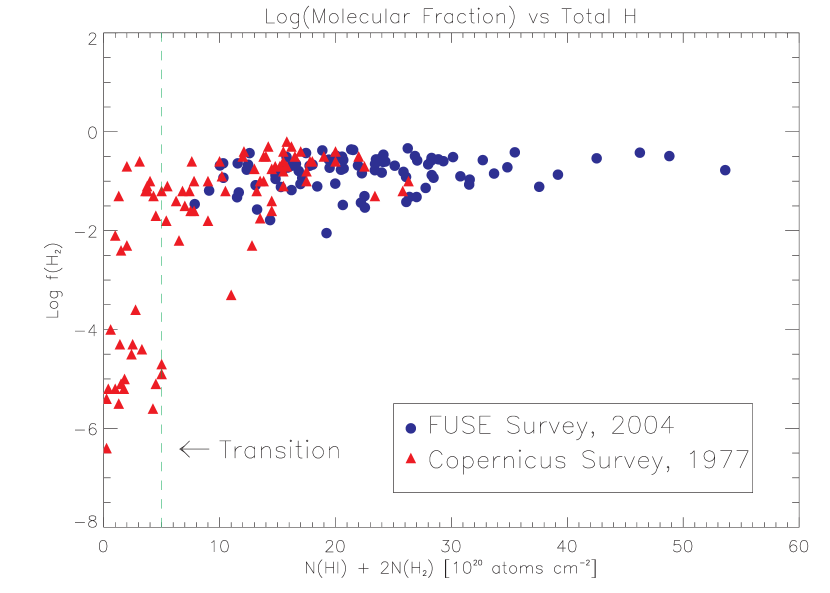
The effects of self-shielding were observed by plotting versus NH, the total column density of hydrogen. As H2 absorption lines in the Lyman and Werner bands become optically thick, the rate () of UV pumping and molecular dissociation diminish. In this way, the presence of H2 screens molecules in the inner portions of the cloud from dissociation. A transition from low () to high () molecular fractions at N cm-2 was noted in the Copernicus H2 survey (Savage et al. 1977). A recent FUSE survey of Galactic disk stars (Shull et al. 2005) provided similar results (Figure 4).
In assessing the molecular content of the cirrus, we consider three generic cases. The first possibility (Case I) is that all the detected H2 resides in cirrus clouds, with no contribution from foreground clouds. Under the assumption that the total hydrogen density, , is proportional to the number density of dust grains in any given interstellar cloud (Hollenbach & McKee 1979), the cirrus dust column density should be proportional to the amount of NH associated with H2. A plot of NH2 vs. dust column density should then show the familiar self-shielding transition of molecular hydrogen. In Case II, some of the observed H2 lies in the cirrus, but some resides in another component of the ISM not visible in the cirrus maps. A plot of NH2 vs. dust column density would show some points that follow the self-shielding transition (those corresponding to cirrus). However, the transition would be broadened by points that are randomly distributed. If a significant portion of the detected H2 along a sight line is not in cirrus, NH2 will not correlate with dust column density. This effect would produce sight lines with low dust column density and significant amounts of H2. The extreme situation is Case III, in which none of the H2 resides in cirrus clouds. We consider this unlikely, given the number of observed regions with “infrared excess” (high dust/NHI ratios) and the detection of CO in denser cirrus clouds. Once the NH2 in cirrus exceeds cm-2, it should be detectable by FUSE. For Case III to be consistent with our survey, the covering fraction of cirrus regions with detectable H2 would need to be quite small, whereas the cirrus covering factor is observed to be % at (see § 3.4).
The issue then comes down to whether Case I or Case II is a better description of the cirrus-H2 correlation. Figure 5 presents a plot of NH2 along sight lines to the 45 AGN in the FUSE survey vs. the temperature-corrected IR flux at each location from the SFD98 maps (blue diamonds). If the temperature-corrected flux is proportional to dust column density, this plot can be used to test the three cases mentioned above. The blue diamonds appear to show the self-shielding transition discussed in Case I, implying that much of the detected H2 is in the cirrus.
3.2 AGN Behind Regions of Low Cirrus
In this section, we describe five additional sight lines shown in red (Figure 5) toward the regions of lowest cirrus. These additional sight lines were chosen to explore whether the correlation between NH2 and 100 m cirrus is universal. Table 5 of SFD98 lists the coordinates of the regions of lowest (temperature-corrected) 100 m intensity, , from their maps. We searched the FUSE archive for targets within of the given coordinates and found five targets behind regions of low cirrus ( MJy sr-1) that also had FUSE data with sufficient (S/N) to conduct an H2 analysis. These five targets are in addition to those in the Gillmon et al. (2005) sample of 45 AGN. They are listed in Table 1 and shown as asterisks in Figure 5.
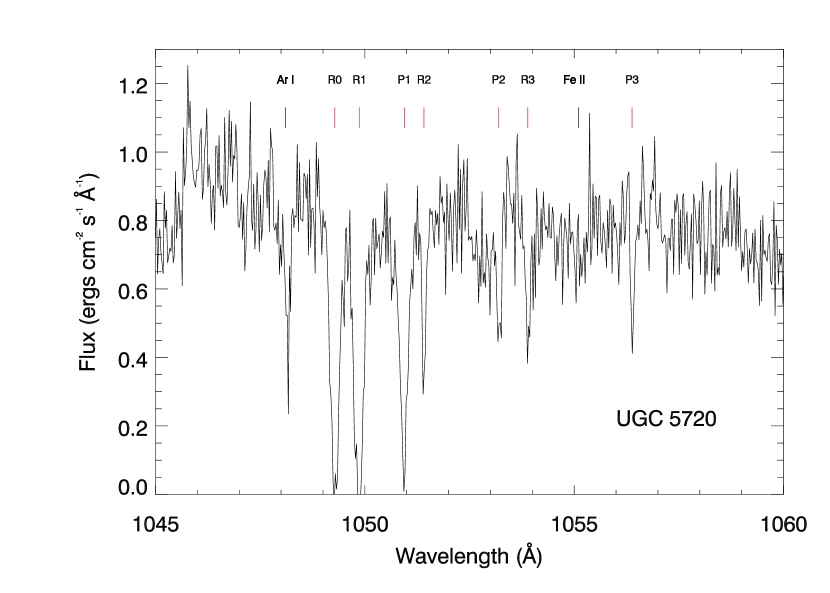
Four of these five targets showed no evidence of H2, with a typical upper limit of NH2 cm-2. This result lends further credence to the theory that most of the observed H2 is in the cirrus (Case I). However, one target, UGC 5720, showed significant H2 absorption lines (Figure 6). An analysis, as described in § 2.1, yielded a significant column density NH2 cm-2. In § 3.3, we explore possible explanations for this anomalous sight line and for the spread in the self-shielding transition.
3.3 The H2 Transition seen in Cirrus
Figure 5 plots NH2 vs. temperature-corrected intensity, (MJy sr-1), and exhibits a clear self-shielding transition of H2. This indicates that a significant fraction of the detected H2 resides in the infrared cirrus. However, with small-number statistics on 50 AGN sight lines, the transition is not sharp, occurring between log = 0.2–0.5. There is one outlying point (UGC 5720) with low cirrus intensity, log , but a significant column density, log NH2 . This outlier suggests that not all the detected H2 resides in cirrus clouds, and that other components of the diffuse gas may harbor detectable amounts of molecules.
In some sight lines that intercept non-cirrus clouds with low 100 m intensity, the gas may undergo an early molecular transition and appear with higher NH2. There are other explanations that might produce the same effects, even if all the H2 resides in cirrus clouds. One consideration is how well the temperature-corrected flux map traces the dust column density. To correct for temperature variations, SFD98 created a temperature map from the ratio of the COBE 100 m and 240 m maps. Thus, low-resolution (1.1∘) temperature maps were used to correct the resolution IRAS map to produce a 100 m map at resolution. It is likely that the dust temperature varies on smaller scales than can be resolved by this method, and a more accurate temperature correction might tighten the self-shielding transition. It is also possible that UGC 5720 lies behind a region of cold cirrus dust unresolved by the temperature map. Thus, a significant portion of the dust column density might not be indicated by the observed flux.
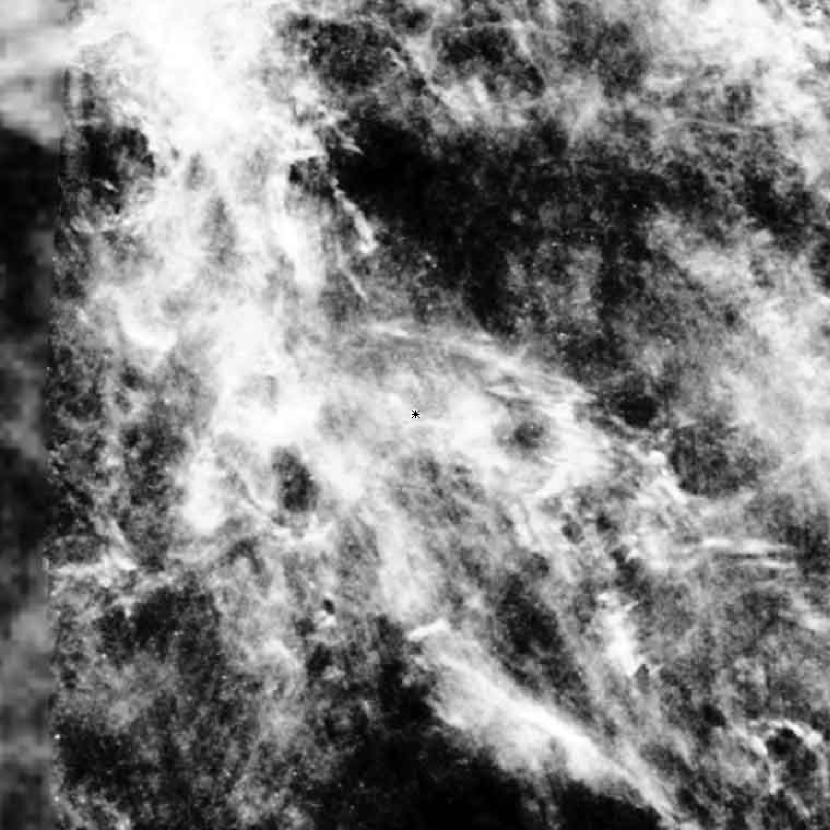
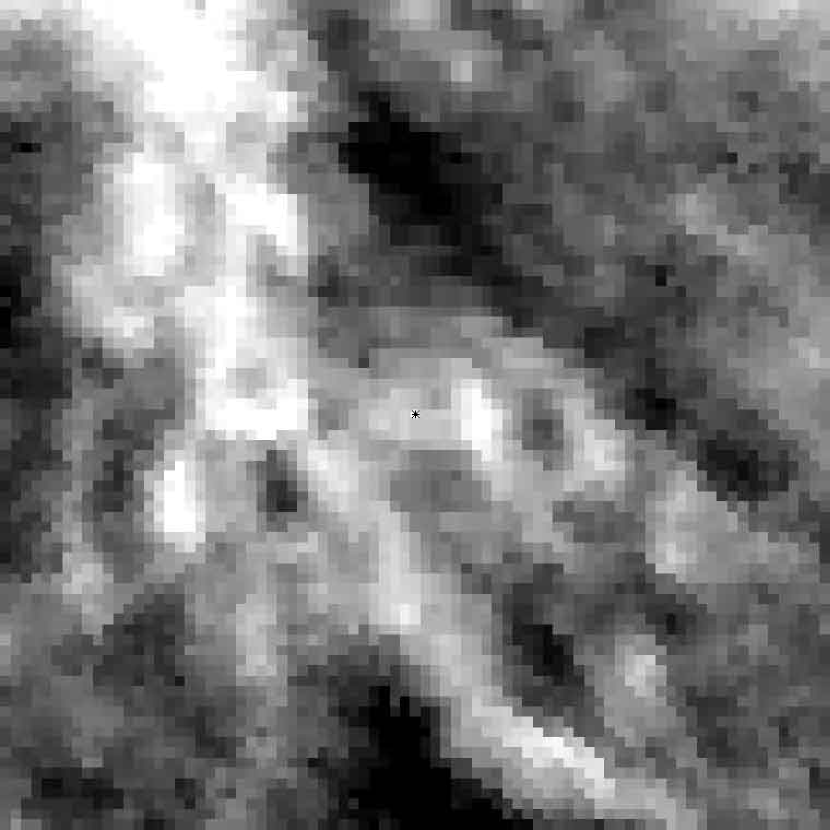
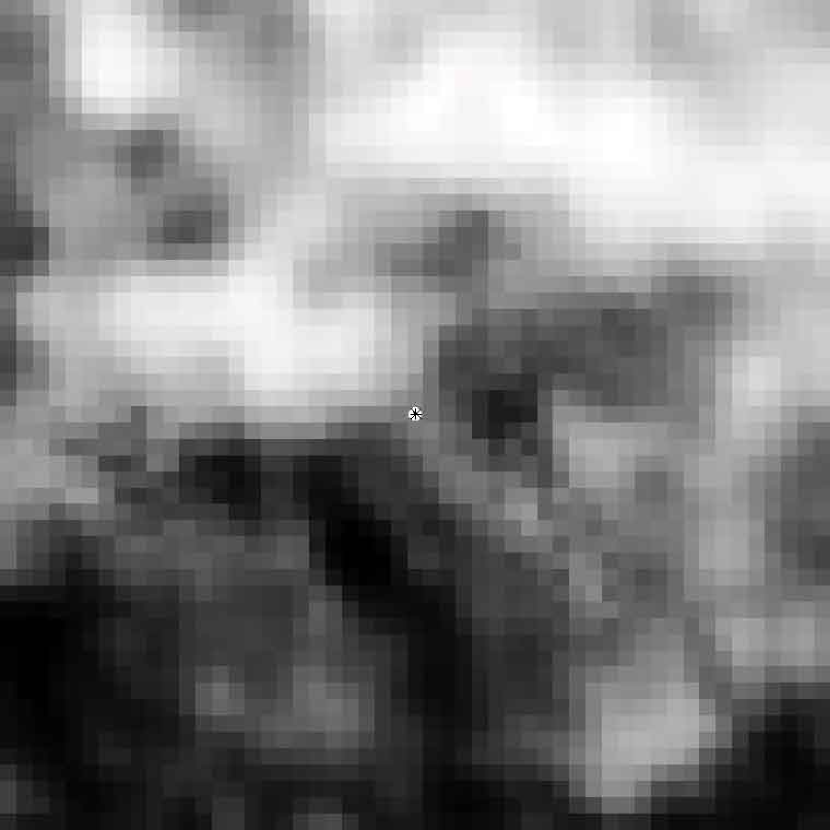
A related consideration is that the IRAS map might not resolve significant variations in dust column density. The sight lines observed by FUSE absorption probe gas along a very narrow beam, while the IRAS beam is considerably larger. Thus, if there were significant structure on smaller scales than the IRAS beam, FUSE could observe a denser clump of H2 while the IRAS emission would be “beam-diluted”. A higher resolution infrared map might tighten the self-shielding transition and/or bring the outlier UGC 5720 onto the correlation. Figure 7 shows a section of the SFD98 flux map centered on UGC 5720. Large fluctuations in temperature-corrected flux near the position of the AGN suggest that the sight line may be picking up a clump of cirrus with higher dust column density unresolved by these maps.
Finally, there is the possibility that there are multiple cirrus features superimposed along a line of sight. Duel & Burton (1990) compared the morphology of cirrus clouds and H I maps in various velocity intervals to show that cirrus features that appear simple are, in some cases, superpositions of kinematically distinct components. This idea of a “concatenation of clouds” was proposed for translucent H2 clouds (Browning et al. 2003) to explain the high levels of H2 rotational excitation in systems with large NH2. These authors suggested that, if a sight line intercepts multiple, physically distinct cloud components, the H2 will be exposed to a radiation field enhanced over that expected for a single, contiguous cloud with the same total column density. The enhanced H2 destruction rate from the stronger UV radiation would reduce the mean molecular fraction and produce a gradual transition to higher NH2. Some sight lines with seemingly high dust column density, but low NH2, may actually be probing multiple, superimposed filaments with high integrated dust column density.
3.4 Mass of the Cirrus Clouds
With the empirical correlation (Figure 5) between IR cirrus and H2 column density, we can make a quantitative estimate of the H2 mass in the diffuse cirrus clouds. We begin with the IRAS maps of the northern Galactic hemisphere. We assume that these cirrus clouds lie at elevation above the Milky Way plane, and that clouds of intensity cover a fraction of the planar area at . The total H2 mass in this planar cloud deck is then,
| (3) |
where NH2 is the mean H2 column density corresponding to cirrus intensity (Figure 5) and where is the radius of the cirrus disk, at elevation subtended by the cone at . For this estimate, we have assumed that the cirrus covers a fraction of the sky at , independent of intensity.
We now make a more careful calculation, summing over the actual data from IRAS and FUSE. Figure 8 shows the distribution of cirrus covering factors, , averaged over northern hemisphere regions with greater than , , and , respectively. For our fiducial cone at , approximately 50% of the sky is covered by cirrus with intensity log , the value corresponding to the H2 transition (Figure 5). Performing the full summation (eq. 3) over 8 logarithmic intensity bins above the transition, of width (log ) = 0.1, between log and 1.0, we find a total H2 mass of contained in the cirrus at .
To convert this calculation to the inner Milky Way, within the solar circle, we multiply by a factor , for the northern and southern Galactic hemispheres, and scale by a factor to account for the number of similar conical areas around the Galactic disk. Note that this total H2 mass is independent of the assumed cirrus elevation, , since the area-scaling cancels the factor in equation (3). We arrive at an extrapolated total molecular mass over the inner Milky Way, , assuming that the cirrus along the AGN sightlines at is typical. The molecular fractions of these cirrus clouds, with NH2 cm-2, range from 1–30% for log = 0.2–0.5 (see Figure 6 of Gillmon et al. 2005), with an average for clouds with log NH2 . Therefore, we estimate the total gas mass in the cirrus to be .
The characteristics of the cirrus clouds along our AGN sight lines can be verified by computing the “dust-to-gas” ratio, defined as the ratio of 100 m cirrus intensity, (MJy sr-1), to H I column density, NHI (cm-2). Table 2 gives these values and their ratio for 16 of our AGN sight lines observed in 21 cm (Lockman & Savage 1995). This ratio ranges from MJy sr-1 cm2 toward PG 0953+414 to MJy sr-1 cm2 toward 3C 273. The mean value and standard deviation are MJy sr-1 cm2, when we exclude the anomalous sight line to 3C 273, which lies behind Radio Loop I and the North Polar Spur. This mean ratio is in excellent agreement with the mean value, MJy sr-1 cm2, found by Boulanger, Baud, & van Albada (1985) in a field at high Galactic latitude.
4 SUMMARY AND FUTURE WORK
We have undertaken a comparison between the column density, NH2, and the 100 m cirrus intensity for a total of 50 sight lines. For the cirrus, we used the temperature-corrected maps of Schlegel, Finkbeiner, & Davis (1998), and adopted H2 column densities from our high-latitude survey (Gillmon et al. 2005). The presence of a clear correlation between UV (H2) absorption and IR (cirrus) emission indicates that a significant fraction of the H2 is physically associated with the cirrus clouds. However, the self-shielding transition of H2 fraction used to define the correlation is not sharp. The existence of one outlying sight line suggests either that some of the detected H2 may exist in another component of the diffuse ISM, or that the limited resolution of the infrared maps is obscuring the physical conditions. Of the three possible cases for H2–cirrus connections laid out in § 3.1, Case I or II best describe the data.
Put simply, H2 is contained in most, if not all diffuse cirrus clouds. At Galactic latitudes , approximately 50% of the sky is covered with cirrus, at temperature-corrected 100 m intensities MJy sr-1. With this correlation, we have found a convenient means of identifying the best extragalactic sight lines for “H2-clean” far-UV absorption studies of intergalactic or interstellar matter. Conversely, if the goal is to study H2 at the disk-halo interface, the cirrus maps would be a good guide.
We also made a rough estimate of the H2 mass contained in these cirrus clouds. Exploiting the H2–cirrus correlation, we summed the distributions of IR cirrus intensity and H2 column density to find in cirrus H2 and in total hydrogen, distributed over the Milky Way disk-halo interface, within the solar circle. Above the self-shielding transition, these diffuse halo clouds have molecular fractions ranging from 1–30%, for column densities N cm-2 and NH2 cm-2 (Gillmon et al. 2005). To support such high molecular fractions by H2 formation on grain surfaces, the cirrus clouds are probably compressed sheets with densities cm-3, in which the gas and grains remain sufficiently cold to form H2. On average, the IR cirrus clouds may actually have higher molecular fractions, on average, than diffuse clouds in the Galactic disk. This point was also made by Reach et al. (1994), who estimated that the H2/H I transition in denser cirrus clouds occurs at N cm-2, on the basis of fits to the far-infrared excess. This transition column density is almost twice that found here, probably because the infrared-excess technique requires larger molecular fractions than used for the UV absorbers ().
This initial survey opens up considerable opportunities for future studies of the H2–cirrus correlation. Higher resolution infrared maps with more accurate temperature corrections, such as those obtainable with the Spitzer Space Telescope, would greatly improve the effectiveness of this method. A comparison with H I 21-cm maps (e.g., Lockman & Condon 2005) could delineate the gaseous structures associated with the cirrus and measure the dust-to-gas ratios in these diffuse clouds. Expanding the UV sample to include more sight lines to background AGN would improve the statistics of such a small sample. The 45 AGN in the survey by Gillmon et al. (2005) were a subset of the 219 FUSE targets selected in Wakker et al. (2003) as candidates for the analysis of Galactic O VI. The next 50 brightest targets have an average flux of erg cm-2 s-1 Å-1. To achieve a S/N of 3 per pixel with FUSE would require approximately 20 ksec per AGN, for a program total of 1000 ksec. An ultraviolet telescope with sensitivity greater than FUSE is probably necessary for feasible exposure times in a target survey.
Another promising avenue for future exploration is to compare the cirrus maps and H2 absorption lines with other tracers, such as H I, CO and -ray emission. On the basis of such comparisons, Grenier, Casandjian, & Terrier (2005) suggest that many interstellar clouds in the solar neighborhood have extensive dark regions that bridge the dense cloud cores to atomic phases. These details are beyond the scope of our current paper. Perhaps the most direct way to investigate the connection between diffuse H2 and IR cirrus would be to map H2 in UV or IR fluorescent emission. This method would provide the morphological information lacking in “pencil-beam” UV-absorption sight lines. There is currently no high-resolution experiment that can map diffuse H2 emission, either in the mid-infrared (28 and 17 m) or the far-ultraviolet (1000–1100 Å). Intriguing results for H2 ultraviolet fluorescent emission at resolution may soon be available from the Spectroscopy of Plasma Evolution from Astrophysical Radiation (SPEAR) Mission (Edelstein et al. 2003). With appropriate IR and UV telescopes, these methods could help map the gaseous Galactic halo.
References
- (1) Black, J. H., & Dalgarno, A. 1976, ApJ, 203, 132
- (2) Boulanger, F., Baud, B., & van Albada, G. D. 1985, A&A, 144, L9
- (3) Browning, M. K., Tumlinson, J., & Shull, J. M. 2003, ApJ, 582, 810
- (4) Desert, F. X., Bazell, D., & Boulanger, F. 1988, ApJ, 334, 815
- (5) Deul, E. R., & Burton, W. B. 1990, A & A, 230, 153
- (6) de Vries, H. W., Heithausen, A., & Thaddeus, P. 1987, ApJ, 319, 723
- (7) Edelstein, J, Korpela, E. J., Han, W., et al. 2003, Proc. SPIE, Vol. 4854, 329
- (8) Gillmon, K., Shull, J. M., Tumlinson, J., & Danforth, C. W. 2005, ApJ, submitted
- (9) Grenier, I. A., Casandjian, J.-M., & Terrier, R. 2005, Nature, 307, 1292
- Hartmann & Burton (1997) Hartmann, D., & Burton, W. B. 1997, Atlas of Galactic Neutral Hydrogen, (Cambridge: Cambridge Univ. Press)
- (11) Hollenbach, D. J., & McKee, C. F. 1979, ApJS, 41, 555
- (12) Hollenbach, D. J., Werner, M. W., & Salpeter, E. E. 1971, ApJ, 163, 165
- Jura (1974) Jura, M. 1974, ApJ, 191, 375
- (14) Lockman, F. J., & Savage, B. D. 1995, ApJS, 97, 1
- (15) Lockman, F. J., & Condon, J. J. 2005, AJ, 129, 1968
- (16) Low, F. J., et al. 1984, ApJ, 278, L19
- (17) Magnani, L., Blitz, L., & Mundy, L. 1985, ApJ, 295, 402
- Moos et al. (2000) Moos, H. W., et al. 2000, ApJ, 538, L1
- (19) Moritz, P., et al. 1998, A & A, 336, 682
- Rachford (2002) Rachford, B. L., et al. 2002, ApJ, 577, 221
- (21) Reach, W. T., Koo, B., & Heiles, C. 1994, ApJ, 429, 672
- Richter et al. (2001) Richter, P., Sembach, K. R., Wakker, B. P., & Savage, B. D. 2001, ApJ, 562, L181
- Richter et al. (2003) Richter, P., Wakker, B. P., Savage, B. D., Sembach, K. R. 2003, ApJ, 586, 230
- Sahnow et al. (2000) Sahnow, D. J., et al. 2000, ApJ, 538, L7
- (25) Savage, B. D., et al. 1977, ApJ, 216, 291
- (26) Schlegel, D. J., Finkbeiner, D. P., & Davis, M. 1998, ApJ, 500, 525 (SFD98)
- (27) Shull, J. M., Tumlinson, J., et al. 2000, ApJ, 538, L73
- (28) Shull, J. M., Anderson, K. L., et al. 2005, ApJ, submitted
- (29) Shull, J. M., & Beckwith, S. V. B. 1982, ARA&A, 20, 163
- Snow, et al. (2000) Snow, T. P., Rachford, B. L., et al. 2004, ApJ, 538, L65
- (31) Spitzer, L., & Jenkins, E. B., 1975, ARA&A, 13, 133
- Tumlinson et al. (2002) Tumlinson, J., Shull, J. M., et al. 2002, ApJ, 566, 857
- Tumlinson et al. (2005) Tumlinson, J., Shull, J. M., Giroux, M., & Stocke, J. T. 2005, ApJ, 620, 95
- (34) Wakker, B. P, et al. 2003, ApJS, 146, 1
- (35) Weiland, J. L, et al. 1986, ApJ, 306, L101
| Target | S/N | NH2 | |||
|---|---|---|---|---|---|
| (deg) | (deg) | (MJy sr-1) | (pixel-1) | (cm-2) | |
| MS0354-3650 | 238.87 | 0.37 | 3 | ||
| HAR03 | 152.41 | 52.87 | 0.38 | 2 | |
| UGC5720 | 156.20 | 52.80 | 0.41 | 3 | |
| NGC5447 | 102.82 | 59.83 | 0.44 | 2 | |
| M101D | 102.67 | 59.75 | 0.46 | 2 |
| Name | log NHI | /NHI | |
|---|---|---|---|
| (MJy sr-1) | (cm-2) | ( MJy sr-1 cm2) | |
| 3C 249.1 | 1.98 | 20.14 | 1.43 |
| 3C 273 | 1.13 | 19.42 | 4.29 |
| H 1821+643 | 2.34 | 20.34 | 1.07 |
| HS 0624+6907 | 5.29 | 20.62 | 1.27 |
| MRC 2251-178 | 2.14 | 20.12 | 1.62 |
| Mrk 205 | 2.28 | 20.25 | 1.28 |
| Mrk 421 | 0.83 | 19.73 | 1.54 |
| PG 0804+761 | 1.92 | 20.41 | 0.74 |
| PG 0844+349 | 2.00 | 20.24 | 1.15 |
| PG 0953+414 | 0.66 | 20.00 | 0.66 |
| PG 1116+215 | 1.23 | 19.83 | 1.82 |
| PG 1211+143 | 1.86 | 20.33 | 0.87 |
| PG 1259+593 | 0.44 | 19.67 | 0.95 |
| PG 1302-102 | 2.36 | 20.22 | 1.42 |
| PKS 0405-12 | 3.22 | 20.28 | 1.69 |
| PKS 2155-304 | 1.19 | 20.06 | 1.03 |