Presenter: A. Insolia (antonio.insolia@ct.infn.it), ita-insolia-A-abs1-he15-poster
Optical Relative Calibration and Stability Monitoring for the Auger Fluorescence Detector
Abstract
The stability of the fluorescence telescopes of the Pierre Auger Observatory is monitored with the optical relative calibration setup. Optical fibers distribute light pulses to three different diffuser groups within the optical system. The total charge per pulse is measured for each pixel and compared with reference calibration measurements. This allows monitoring the short and long term stability with respect of the relative timing between pixels and the relative gain for each pixel. The designs of the LED calibration unit (LCU) and of the Xenon flash lamp used for relative calibration, are described and their capabilities to monitor the stability of the telescope performances are studied. We report the analysis of relative calibration data recorded during 2004. Fluctuations in the relative calibration constants provide a measure of the stability of the FD.
1 Introduction
Data from the Pierre Auger Observatory are used to study high energy cosmic rays in the region of the Greisen-Zatsepin-Kuz’min (GZK) cut-off [1]. The detection of events with primary energy beyond the GZK cut-off, but also the discrepancy between experimental data from the AGASA and HiRes experiments, results in a wide spectrum of hypotheses about the origin of ultra high energy cosmic rays and their nature. To solve this puzzle a well understood energy scale and well understood energy resolution combined with high statistics are of decisive importance for the Pierre Auger Observatory [2]. A subset of showers observed by the observatory is measured by both the ground array and Fluorescence Detector (FD). These special hybrid events [2] are used to set the shower energy scale, based on the determination of the shower energy by the fluorescence detector , and to measure the shower energy resolution of the experiment. This paper will focus on the optical relative calibration of the fluorescence telescopes and the accuracy of this method. Details of the absolute calibration of FD are discussed in reference [3].
2 Fluorescence Detector Relative Optical Calibration
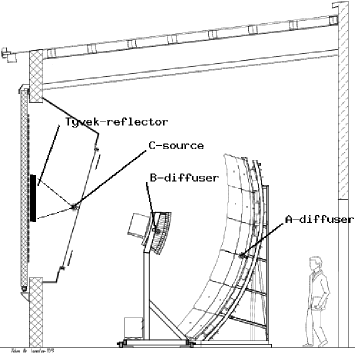
The fluorescence detectors of the Pierre Auger Observatory are located on top of hills at the perimeter of the ground array. Three installations – named Los Leones (LL), Los Morados and, Coihueco – are already equipped with 6 operating telescopes each and are taking data. Fluorescence light from extensive air showers enters the aperture of the telescope through an UV transparent filter ( nm) [4] and is focussed by a spherical mirror on a camera made of 440 photomultiplier tubes (PMTs) as shown in Fig. 1. Gaps between adjacent PMTs on the focal surface are covered by reflective triangular inserts, termed Mercedes stars. These act like Winston cones and reflect light toward the PMTs which would otherwise be lost in the gaps. This maximizes the light collection and results in a smooth transition between adjacent PMTs. The diameter of the telescope was increased from original 1.7 m to 2.2 m in the final design to increase the effective aperture area by about a factor 2. A corrector ring of annular shape covers the additional outer aperture with radii of m m to preserve a small spot size also at the increased diameter.
The signal of each pixel passes through a programmable gain amplifier, an anti-aliasing filter and is digitized by a 10 MHz, 12-bit ADC in the front-end electronics associated to each telescope [5].
The absolute calibration [3] provides the conversion between the digitized signal (in ADC units) and the photon flux incident on the 3.80 m2 telescope aperture. The wavelength dependent transparency of the UV filter, the mirror reflectivity and, the PMT quantum efficiency results in wavelength dependent absolute calibration constants. The electronic gain amplifier is adjusted during the absolute calibration procedure such that the response of the telescope to light is identical at a fixed wavelength. Changes in the properties of any optical component would change the absolute calibration and must be tracked in time by routine relative calibration measurements. These measurements determine the response of the telescope to light pulses from either a LED source or a xenon flash lamp. The results is compared to reference measurements made directly after absolute calibration. Therefore, the main goal of the relative calibration is to monitor short term and long term changes between successive absolute calibration measurements and to check the overall stability of the Fluorescence Detector.
3 The LED and the Xenon light sources
The LED light source: optical fibres distribute light from a super-bright LED array (470 nm) to the diffusers (denoted with ”A” in Fig. 1) which illuminate the cameras in the same FD building simultaneously. Part of the LED light is directed by a fibre to a monitoring photodiode. A LED Calibration Unit (LCU) drives the LED array with programmable current pulses, and records the photodiode signal. The LCU consists of the following main functional units: a central control, a programmable pulse generator and a pulse monitor. The central control unit provides a TCP/IP connection to the local LAN and controls the operation of all LCU functions. The programmable pulse generator is able to generate current pulses of arbitrary shape encoded as consecutive 256 samples of a 40 MHz 10-bit Digital-to-Analog Converter or rectangular pulses up to s long with programmable amplitude ( A). The pulse monitor consists of a photodiode (Hamamatsu S1336 with zero sensitivity drift), a transimpedance amplifier, an anti-aliasing filter of 3.1 MHz cut-off frequency and a 10 MHz 12-bit ADC. The rms noise (sigma) of the monitor circuit is 2.5 ADC counts. The LCU is controlled during relative calibration by the DAQ. It defines (via TCP-IP) the total number of light pulses, the pulse shape, its amplitude and its duration. The LCU can be triggered by its internal timer or by an external trigger signal. The light pulse is generated synchronous to the 10 MHz sampling clock of the front-end electronics with low jitter. The pulse monitor stores 1000 consecutive ADC samples from the monitoring diode for later readout by the DAQ process.
The Xenon light source: two xenon flash lamps are coupled to optical fibers to distribute light pulses to different destinations (denoted ”B” and ”C” in Fig. 1) on each telescope. Source “B” pulses terminate at 1 mm thick Teflon diffusers on both sides of the camera and are directed towards the mirror. Source ”C” pulses are fed through ports on the sides of the aperture and are directed onto a reflective TYVEK foil mounted on the inner side of the telescope doors. The foil reflects the light back into the optic of the telescope. In this paper we focus on the results of relative calibration with the LED source. For details on the xenon flash lamp calibration as well as for technical references see [4]. We simply mention that monitoring the Los Leones and Coihueco xenon light source stability results in mean light intensity distribution characterized by a relative uncertainty smaller than . The two relative calibration light sources are therefore quite stable and provide a good tool for monitoring the long term stability of the Fluorescence Detector.
4 Monitoring the Fluorescence Detector with the Relative Optical Calibration
A-, B- and C- calibrations are routinely taken twice per data taking shift. As the light sources were essentially constant, the A-source calibration signals in each pixel (of each telescope) provided an optimal monitor of the pixel stability. The relative calibration constants are measured with respect to a given reference relative calibration run taken within one hour after the absolute calibration measurement. The total integrated charge is then measured with respect to this run. A typical result for telescope # 4 in Los Leones is shown in Fig. 2.
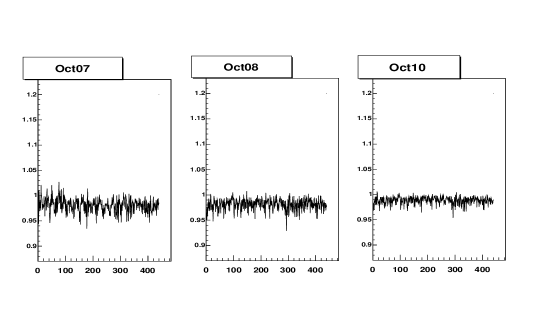
The relative calibration constants fluctuate around 1 with a typical width of a few percent. To monitor the short term stability of the system we calculated the camera averaged relative calibration constants and its rms every day. The trend over the measuring period in October 2004 is shown in Fig. 4 for telescope # 2 of Los Leones as an example.
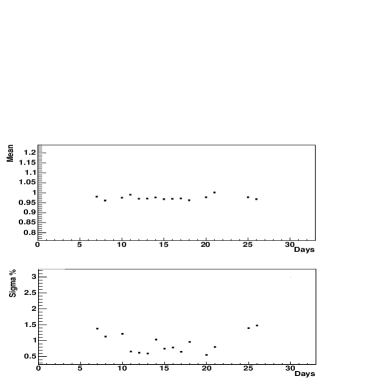
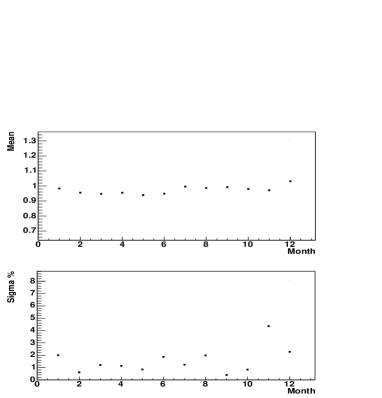
The rms reported in Fig. 4 (bottom diagram) is typical for all relative calibration runs, resulting in a rms of about . The stability over a year or even longer times can be monitored by calculating monthly averages and displaying the trend for each telescope over the full data taking period. The data of telescope # 4 in Los Leones shown in Fig. 4 represent a typical situation. The system is stable within a few percent both on the long term and on a monthly base. The overall uncertainty, as deduced from the long term monitoring of the system is, typically, in the range of 1 to 3 %. The relative calibration is also a very effective tool to find problems of any kinds with the PMTs’ response or in the electronics. In addition, effects on the telescopes sensitivity caused by work on the hardware or software show up immediately in daily relative calibrations. Thus, any variation of the entire FD response due to the intervention on the system can be monitored and cross-checked.
References
- [1] C. Aramo, A. Insolia and C. Tuve’, Eds, GZK and Surroundings, Proc. of the Intern. Cosmic Ray Seminar CRIS 2004, Nucl. Phys. B Proceedings Supplements, Elsevier (2004)
- [2] Pierre Auger Collaboration: J. Abraham et al., Nucl. Instr. Meth. 523, (2004) 50
- [3] J. Brack, R. Meyhandan, G. Hofman, J. Matthews, Astroparticle Physics 20, 653 (2004)
- [4] J.A.J. Matthews, Proc. of SPIE Conference on ”Astronomical telescopes and Instrumentation”, Vol. 4858, Particle Astrophysics Instrumentation, Ed. P. W. Gorham.
- [5] M. Kleifges for the Auger Collaboration, Nucl. Instr. Meth. A 518, (2004) 180