Presenter: C.B. Finley (finley@phys.columbia.edu), usa-westerhoff-S-abs1-he14-oral
Search for Point Sources of Ultra–High-Energy Cosmic Rays Above eV Using a Maximum Likelihood Ratio Test
Abstract
We present the results of a search for cosmic ray point sources at energies above eV in the HiRes stereo data set. The analysis is based on a maximum likelihood ratio test using the probability density function for each event rather than requiring an a priori choice of a fixed angular bin size. The search is extended to the combined data set of HiRes data above eV and AGASA data above eV. In both cases, no statistically significant clustering of events consistent with a point source is found.
1 Introduction
When analyzing skymaps of cosmic ray arrival directions, it is important to correctly account for the error on the angular resolution of individual events. This is especially true in cases where data from detectors with different angular resolution are combined, or when the angular resolution of the detector varies strongly with energy or event geometry. A method that correctly accounts for the angular resolution on an event-by-event basis was recently introduced in [1]. In this paper, we perform a likelihood ratio test of the hypothesis that several events in the skymap come from a common source. In other words, we test whether any given position on the sky harbors a source which contributes source events to the data set. The likelihood of this hypothesis is compared to the null hypothesis and this likelihood ratio is maximized using as a free parameter. By calculating the likelihood ratio for a dense grid of points on the sky, we essentially search the entire sky for the most likely position of a source of events. The statistical significance is then estimated by applying the same method to a large set of random isotropic data sets and evaluating what fraction of them have a likelihood ratio which is equal to or larger than the ratio observed in the real data.
In [1], this method is applied to the combined HiRes and AGASA data set of events with energies in excess of eV. No excess is found. The strongest signal, from the position of the AGASA “triplet,” [2] is consistent with random clustering even if the HiRes threshold is lowered a posteriori to include a HiRes event with energy eV in the vicinity of the “triplet.” Nevertheless, a point source at that position has been claimed [3, 4], partly based on the fact that another HiRes event with energy between eV and eV is found in the same region. Here, we extend the energy range of this analysis down to eV to understand whether the additional low energy event strengthens the case for a point source or is consistent with expectations for an isotropic skymap with 271 events, the number of events in the HiRes stereo data set above eV. We will analyze the HiRes stereo data set alone and in combination with the AGASA data set, with the understanding that every “signal” found in the combined set would be strongly biased as the AGASA threshold of eV was chosen in [5] precisely because it maximized the clustering signal. Also, magnetic smearing, which is likely to become an issue for energies as low as eV, is not taken into account.
2 Analysis
We give a short description of the likelihood method used in this analysis. Consider first a fixed source location in right ascension and declination: . Given a sample of cosmic ray events, we suppose that events come from the source location , and that the remaining events are random background events. If the th event is a source event, then its true arrival direction is . The probability density for finding it at some location is given by the function , derived from the angular errors of the event and the angular displacement between and . On the other hand, if the th event is a background event, then the probability density for finding it at a location is given by the function , derived from the relative exposure of the detector to an isotropic background of cosmic rays. The subscript is necessary because depends on whether event is a HiRes or AGASA event. Each of these functions is normalized to unity over positions in the sky.
We do not hypothesize which individual events are source or background events. We only suppose that there are events in the sample that come from some source position . Therefore, the partial probability distribution of arrival directions for the th event is given by:
| (1) |
It follows that the probability of finding the th event at the location (where it is actually observed) is .
The likelihood for the entire set of events is then given by:
| (2) |
The best estimate for the number of source events, under the assumption of a point source located at , is determined by finding the value of which maximizes .
Because the value of the likelihood function depends on the number of events, a more useful quantity than is the likelihood ratio :
| (3) | |||||
where is the likelihood function of the null hypothesis (). In practice, we maximize , which is equivalent to maximizing .
The method described so far is sufficient for testing a specific source position . To search the entire sky for the source position with the strongest signal, we calculate the likelihood ratio for a dense grid of points on the sky covering the full range of equatorial coordinates accessible to AGASA and HiRes. The source position is essentially treated as a free parameter, along with the number of source events . Searching for the parameters , , and which maximize the likelihood ratio will therefore give us the best estimate for the position of the source and the number of events it contributes.
The search proceeds as follows. The visible region of the sky is divided into a fine grid of points with separations and in and , respectively. Each point is treated in turn as a source location . At each point, the specific quantities and are required for every event. The source probability density function depends on the angular resolution associated with the th event, which in principle may depend on several quantities including energy, zenith angle, etc. The background probability density function depends on the detector exposure to different parts of the sky: it is generally the same function for all events observed by a given detector, but may in principle be a function of e.g. energy as well. For each event, needs to be reevaluated at every grid point, while needs only to be evaluated one time.
Once the values of and are specified, the log likelihood ratio is maximized with respect to , where . This process is repeated for each position on the grid. For most locations, is zero, but local maxima will occur in the vicinity of one or more events. Note that while the method is in some sense binned due to the discrete array of grid points, the spacing is chosen small enough so that errors introduced by binning are insignificant.
For the signal probability density function (Q) of the HiRes events, we use a two-dimensional Gaussian function whose width is chosen such that of the probability density function falls within an opening angle . Note that for a two-dimensional Gaussian distribution the opening angle encloses of the distribution. Since the dependence on energy is weak, we use the same value, , for every HiRes stereo event. The procedure to obtain the background expectation is described in [1].
3 Results
We apply this method to the 271 HiRes stereo events with energies above eV. The point with the largest is at right ascension and declination . The maximum likelihood ratio at this position is for .
The statistical significance of the appearance of a “source” with a maximum likelihood ratio can be evaluated using simulated random data sets. The full likelihood analysis is performed for a large number of random data sets with the same number of events and the same underlying exposure as the original data set, but isotropic arrival directions. The chance probability for the “source” to appear is then given by the fraction of random data sets which have at least one location causing the maximum to be equal or larger than , the value of the maximum in the real data. For the HiRes stereo data above eV, the chance probability of the source hypothesis is of the order of . Consequently, there is no statistically significant evidence for clustering consistent with a point source in the data set.
We now include the published AGASA data set above eV in this analysis. For AGASA, we approximate the probability density by the sum of two Gaussian functions chosen such that the and opening angle given in [7] is correctly reproduced. Details can be found in [1, 8].
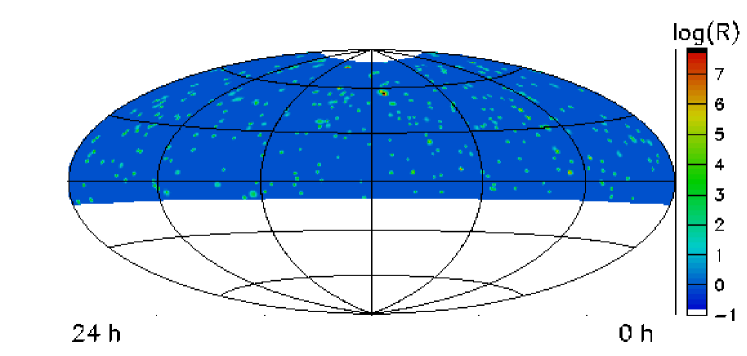
Fig. 1 shows the result of the analysis. At each and , the likelihood ratio is shown for the number of source events which maximizes . The point with the largest is at right ascension and declination , which is indeed the position of the point source claimed in [3]. The maximum likelihood ratio at this position is for . As before, we evaluate the chance probability for the appearance of a source with maximum or higher in this data set by analyzing a large number of simulated isotropic data set, now containing 57 AGASA events in addition to the HiRes stereo events. The chance probability is , so again, no evidence for clustering consistent with a point source is found.
The HiRes experiment is scheduled to take data until March 2006, and the search for cosmic ray point sources at the highest energies will continue when more data becomes available.
4 Acknowledgments
This work is supported by US NSF grants PHY-9321949, PHY-9322298, PHY-9904048, PHY-9974537, PHY-0098826, PHY-0140688, PHY-0245428, PHY-0305516, PHY-0307098, and by the DOE grant FG03-92ER40732. We gratefully acknowledge the contributions from the technical staffs of our home institutions. The cooperation of Colonels E. Fischer and G. Harter, the US Army, and the Dugway Proving Ground staff is greatly appreciated.
References
- [1] R.U. Abbasi et al., Astrophys. J. 623, 164 (2005).
- [2] M. Takeda et al., Astropart. Phys. 19, 447 (2003).
- [3] G.R. Farrar, astro-ph/0501388 (2005).
- [4] S.V. Troitsky, astro-ph/0505262 (2005).
- [5] N. Hayashida, Phys. Rev. Lett., 77, 1000 (1996).
- [6] R.U. Abbasi et al., Astrophys. J. 610, L73 (2004).
- [7] M. Takeda et al., Astrophys. J. 522, 225 (1999).
- [8] R.U. Abbasi et al., Astropart. Phys. 22, 139 (2004).