Low Order Aberrations in
Band-Limited Lyot Coronagraphs
Abstract
We study the way Lyot coronagraphs with unapodized entrance pupils respond to small, low order phase aberrations. This study is applicable to ground-based adaptive optics coronagraphs operating at 90% and higher Strehl ratios, as well as to some space-based coronagraphs with intrinsically higher Strehl ratio imaging. We utilize a second order expansion of the monochromatic point-spread function (written as a power spectrum of a power series in the phase aberration over clear aperture) to derive analytical expressions for the response of a ‘band-limited’ Lyot coronagraph (BLC) to small, low order, phase aberrations. The BLC possesses a focal plane mask with an occulting spot whose opacity profile is a spatially band-limited function rather than a hard-edged, opaque disk. The BLC is, to first order, insensitive to tilt and astigmatism. Undersizing the stop in the re-imaged pupil plane (the Lyot plane) following the focal plane mask can alleviate second order effects of astigmatism, at the expense of system throughput and angular resolution. The optimal degree of such undersizing depends on individual instrument designs and goals. Our analytical work engenders physical insight, and complements existing numerical work on this subject. Our methods can be extended to treat the passage of higher order aberrations through band-limited Lyot coronagraphs, by using our polynomial decomposition or an analogous Fourier approach.
Subject headings:
instrumentation: adaptive optics — space vehicles: instruments — techniques: image processing — astrobiology — circumstellar matter — planetary systems1. Introduction
Lyot coronagraphy (Lyot, 1930, 1939) has enjoyed a resurgence because interest in discovering and characterizing extrasolar planets has been stimulated by advances in ground-based adaptive optics (AO), as well as support from space agencies for extrasolar planetary science missions. There is currently one extreme adaptive optics (ExAO) coronagraph being used to conduct a complete complete survey for faint companions and disks around nearby stars (Oppenheimer et al., 2003, 2004; Digby et al., 2004; Makidon et al., 2005). New coronagraph designs to enable the detection and characterization of extrasolar planets abound (Nisenson & Papaliolios, 2001; Aime et al., 2002; Kuchner & Traub, 2002; Soummer et al., 2003a, b; Aime & Soummer, 2003; Kasdin et al., 2003; Soummer, 2005). Many of these designs would suppress light from the central star around which a planet orbits, as long as the telescope and instrument optics and stops were perfect, and simple Fourier optics theory was accurate enough to predict instrument behavior in these high contrast regimes. Less-than-ideal image quality is a stumbling block which impedes attainment of this science goal. Kasdin (private communication) has demonstrated in the laboratory that Fourier optics appears to be valid down to contrast ratios of .
We study the way Lyot coronagraphs dedicated to imaging extrasolar Jovian and terrestrial planets respond to small, low order phase aberrations. Perrin et al. (2003) demonstrated that for ground-based adaptive optics systems delivering Strehl ratios of at least 90%, a second-order expansion of the imaging system’s point-spread function (PSF) response to monochromatic light from a point source (Sivaramakrishnan et al., 2002) was sufficient to model the effects of phase aberrations on the PSF. We analyze the case of unapodized telescopes in high dynamic range regimes, as is relevant to the problem of tolerancing optics on space-based coronagraphic telescopes or calibrating wavefront sensing non-common path errors on ground-based ExAO instruments dedicated to finding and characterizing extrasolar planets.
Lloyd & Sivaramakrishnan (2005) derived the response of a simple band-limited coronagraph to small tilt errors, using an analytical method combined with an expansion of the pupil plane field strength (defined later) in terms of the phase aberration over the pupil. That work produced insight into the way tilt error causes light to leak through a coronagraph that is designed to suppress all light from a perfectly flat, on-axis wavefront. Such an analytical treatment develops a qualitative understanding of coronagraphic response to phase errors. Insights developed there apply to classical Lyot coronagraphy. We extend the methods of Lloyd & Sivaramakrishnan (2005) to understand how low order aberrations propagate through a band-limited Lyot coronagraph. While earlier studies (e.g., Malbet, 1996; Sivaramakrishnan et al., 2001; Green et al., 2003) explored some aspects of coronagraphy on imperfect wavefronts, they did not provide analytical tools required to understand some of the optical problems of designing a coronagraph to achieve the photometric dynamic range needed by a space mission dedicated to discovering and characterizing extrasolar Jovian planets, or the contrast ratio that extrasolar terrestrial planet discovery may well demand (Breckinridge & Oppenheimer, 2004). Our analytical approach is a start along the route to understanding coronagraphic data described in e.g., Oppenheimer et al. (2004); Digby et al. (2004).
A band-limited coronagraph is a perfect coronagraph design in that simple Fourier optics modelling suggests that it will prevent all incoming, on-axis light from reaching the final coronagraphic focal plane. We define light leak as the fraction of incident on-axis energy that reaches the final coronagraphic focal plane. Our concern is restricted to diffractive light leak rather than light redistributed within the instrument by scattering off imperfect optics. We also concentrate on small aberrations of the wavefront that forms the first image. For instance, we treat tilts that are small compared to the angular resolution of the system. Such tilts decenter the star behind the focal plane mask’s occulting spot without moving it out from behind the spot — which is itself at least a few resolution elements in diameter. Such aberrations in the wavefront prior to the focal plane mask result in light leaking through a supposedly perfect coronagraph, reaching the final coronagraphic image plane, thereby reducing the dynamic range of the instrument. We find that small amounts of tilt and astigmatism do not increase the light leak through the coronagraph, whereas the same amounts of coma and spherical aberration do. However, detrimental second order effects of astigmatism can be reduced by undersizing the Lyot stop. Our analysis shows that defocus and tilt produce characteristic intensity distributions in the Lyot plane, which suggests ways this signal can be used to align a high dynamic range coronagraph, and calibrate the offset between the focal plane mask location in the final coronagraphic image plane, thereby improving the coronagraph’s astrometric accuracy. Similar analyses on the various coronagraph designs being developed for the purpose of detecting Jovian and Earth-like planets around nearby stars will contribute to an informed selection of a design, in addition to providing insight into how to improve these designs.
2. Basic Coronagraphic Theory
A simple mathematical description of the fundamentals of Lyot coronagraphy (Lyot, 1939) can be found in Sivaramakrishnan et al. (2001), Aime & Soummer (2002), Lloyd & Sivaramakrishnan (2005), and references therein.
2.1. Monochromatic coronagraphic theory
Here we briefly recapitulate our basic monochromatic Fourier optics formalism, which follows that of Lloyd & Sivaramakrishnan (2005); Sivaramakrishnan & Lloyd (2005). A more detailed treatment can be found in Born & Wolf (1993). We recollect that a plane monochromatic wave travelling in the direction in a homogenous medium without loss of energy can be characterized by a complex amplitude representing the transverse (e.g., electric) field strength of the wave. The full spatio-temporal expression for the field strength is , where , the speed of the wave. We do not use the term field to denote image planes — the traditional optics usage — we always use the term to denote electromagnetic fields or scalar simplifications of them. The wavelength of the wave is . The time-averaged intensity of a wave at a point is proportional to , where the average is taken over one period, , of the harmonic wave. The phase of the complex number represents a phase difference from the reference phase associated with the wave. A real, positive corresponds to an electric field oscillating in phase with our reference wave. A purely imaginary positive value of indicates that the electric field lags by a quarter cycle from the reference travelling wave. Transmission through passive, linear filters such as apertures, apodizers, and so forth, is represented by multiplying the field strength by the transmission of these objects which modify the wave. Again, such multiplicative modification is accomplished using complex numbers to represent phase changes forced on the wave incident on such objects.
We assume that scalar Fourier optics describes our imaging system (cf. Breckinridge & Oppenheimer, 2004): image field strengths are given by the Fourier transform of aperture (or pupil — we use the two terms interchangeably) illumination functions, and vice versa.

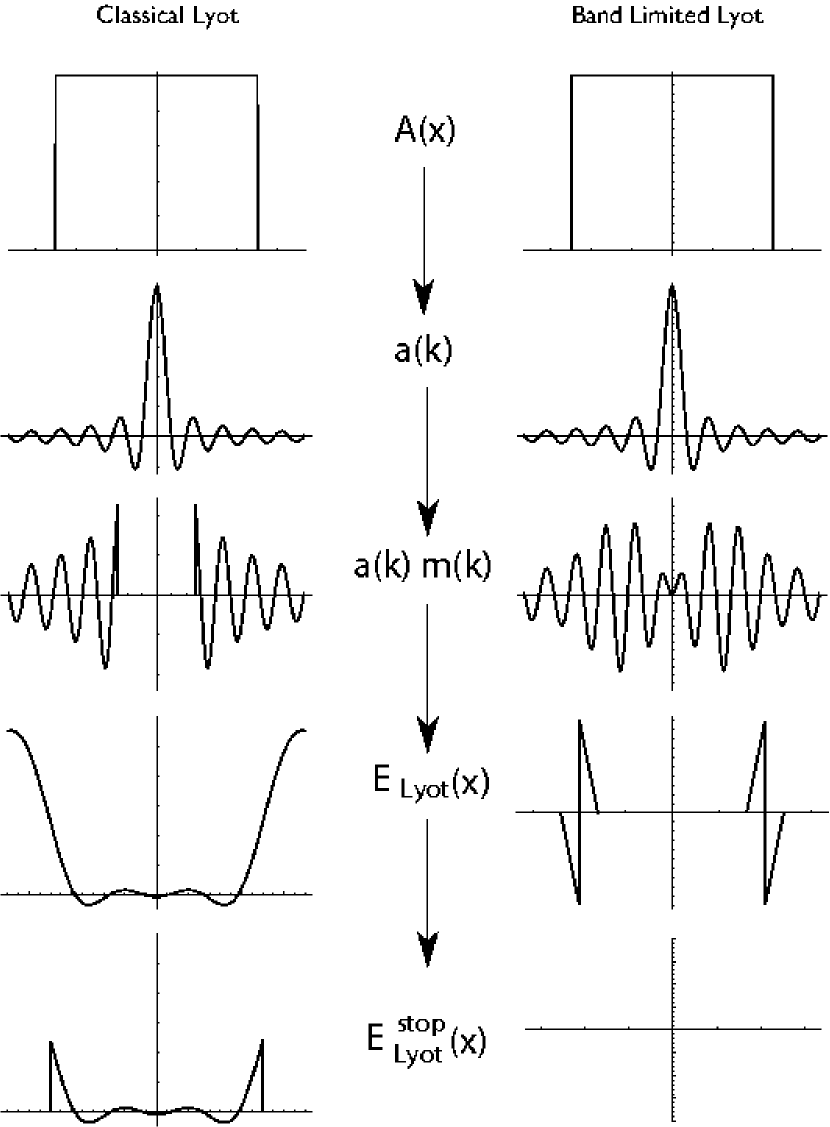
A telescope aperture is described by a transmission function pattern , where is the location in the aperture, in units of the wavelength of the light (see Fig. 1). The corresponding aperture illumination describing the electric field strength in the pupil (in response to an unaberrated, unit field strength, monochromatic incident wave) is . From this point onwards we drop the common factor when describing fields. The aperture intensities () for two coronagraphic designs are shown in Fig. 2 (top row). The field strength in the image plane, , is the Fourier transform of , where is the image plane coordinate in radians. Because of the Fourier relationship between pupil and image fields, is also a spatial frequency vector for a given wavelength of light. We refer to this complex-valued field as the ‘amplitude-spread function’ (ASF), by analogy with the PSF of an optical system. The PSF is . Our convention is to change the case of a function to indicate its Fourier transform. We multiply the image field by a mask function to model the focal plane mask of a coronagraph. The image field immediately after this mask is . The electric field in the re-imaged pupil after the focal plane mask is , which is the Fourier transform of . We use the fact that the transform of the image plane field is just the aperture illumination function itself, so the Lyot pupil field is , where is the convolution operator.
If the Lyot pupil stop transmission is , the electric field after the Lyot stop is . The transform of this last expression is the final coronagraphic image field strength: .
The aperture illumination function with phase aberrations is
| (1) |
In this paper we look at the way small phase aberrations pass through a band-limited coronagraph. Our approach is to expand the exponential in equation (1) in powers of , so the quantity that determines the rate of convergence of the expansion is the largest excursion of from its mean value over the clear aperture.
2.2. The Lyot plane field
A coronagraphic stop is modelled by multiplying the image field by a focal plane mask transmission function , so the electric field strength just after the focal plane mask is . When describing a Lyot coronagraph it is sometimes helpful to introduce a ‘mask shape function’ by the definition
| (2) |
When is unity at the origin the mask is opaque at its center. We can write the electric field at the Lyot plane as
| (3) |
Understanding the subtleties of this equation in the case of high Strehl ratio imaging is essential to understanding how small phase aberrations cause light to leak through a coronagraph designed to produce perfect on-axis image suppression with completely unaberrated on-axis light.
2.3. Band-limited coronagraphs
Kuchner & Traub (2002) use a focal plane mask shape function which is band-limited. This means that there is a minimum positive value of such that the mask function’s FT, , satisfies the property
| (4) |
The bandwidth or bandpass of is (note that is actually a physical distance in pupil space). We select the mask function in its transform (pupil) space, , rather than in physical (image) space, , even though it is applied in the image plane in any real coronagraph. If the telescope diameter is , then the characteristic scale of the mask function is resolution elements (a resolution element is radians, being the wavelength of the monochromatic light). This results in a focal plane mask about Airy rings in size.
2.4. The top-hat band-limited coronagraph
The simplest choice for is the ‘top-hat’ function , where
| (5) |
(see Fig. 2). The bandwidth of the corresponding mask function is . A normalizing factor of is applied to ensure that the area under is unity, thus ensuring that ; the focal plane mask is opaque at its center. A top-hat produces a multiplicative image stop function
| (6) |
Our interest such a choice is primarily didactic: this coronagraph leaks aberrated light in a manner similar to that of the more popular ‘sawtooth’ band-limited coronagraph, viz., one with a mask function FT of
| (7) |
where
| (8) |
The sawtooth coronagraph has a focal plane mask described by .
3. Expansion using the Phase Function
The phasor can be expanded as for any finite value of the aberration . Depending on the size of the aberration it is useful to truncate this expansion at various orders (e.g., Bloemhof et al., 2001; Sivaramakrishnan et al., 2002; Perrin et al., 2003). The first order perturbation of the field strength in the aperture is imaginary: i.e., the field due to phase aberrations is in phase-quadrature to the perfect aperture field. The second order aberration of the aperture field strength is in (anti-)phase with the perfect wave’s field strength.
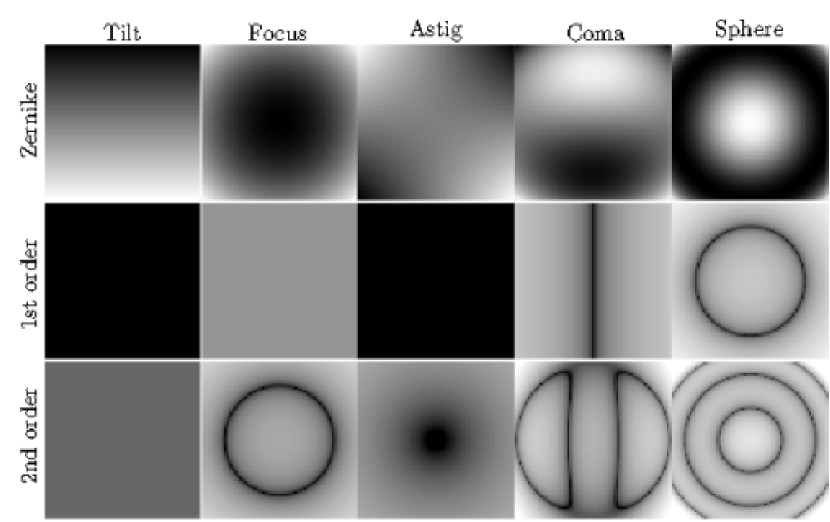
3.1. Zernike polynomials and Cartesian expansions
Zernike polynomials, which are a set of orthogonal polynomials on the unit radius 2-dimensional disk, are frequently used to describe phase aberrations in optical systems (e.g., Born & Wolf, 1993; Noll, 1976). These polynomials are expressible in either circular coordinates or Cartesian coordinates . Expressing Zernike polynomials in Cartesian coordinates leads to a mathematical simplicity that promotes a better understanding of the physics of an imperfect band-limited Lyot coronagraph. Because of this, we investigate coronagraphy on a square aperture in order to make integrals separable in and .
We have the choice of of writing the phase as either a simple polynomial or an expansion in terms of Zernikes. In the latter case, we must choose the Zernike functions’ normalized coordinates: we choose the disk on which we define our Zernike functions to possess an area equal to that of our square aperture. This choice results in extrapolating the Zernike polynomials to a radial coordinate of , which is beyond their usual range of validity. Doing so is a fruitful exercise if we restrict ourselves to low order aberrations. We emphasize that we do not invoke any of the Zernike polynomials’ orthonormal properties to prove any result. Thus our apparently cavalier extrapolation of the polynomials beyond the domain over which they are usually defined does not lead to grief. We only use them here because they are widely used in the optical literature. A more natural Fourier decomposition of the phase aberration over the aperture is of course possible, and may even preferrable to a Zernike decomposition for higher order aberrations.
Our choice of the equal-area circle for our Zernike polynomials is motivated by the following considerations: if we use the circumscribing circle around our square aperture, we miss the steep increases of Zernike functions describing e.g., spherical aberration at the edge of the disk, which for the most part will lie outside our square aperture. If we use an inscribed circle, we include large areas in the corners of the apertures where the magnitude of the third, fourth, and fifth order polynomials increase sharply, contributing features that we do not commonly associate with particular Zernike aberrations. Instead of either extreme, we stick to the middle ground, at the expense of mathematical purity: we miss some of the higher values of these Zernike polynomials where our circle extends outside the square aperture, but collect larger phase errors at the corners of our aperture, where the normalized Zernike arguments exceed unity. The net effect of this is that we can still talk about Zernike functions on our square aperture, in much the same way Zernike function aberrations on obscured apertures such as HST or Palomar are discussed, even though the annular Zernike functions of Mahajan (1981) should be used on annular apertures.
4. Propagation of Simple Polynomial Phase Aberrations
At any location in the pupil plane, can be expanded in an absolutely convergent series in for any finite value of the phase function:
| (9) |
If the phase over the aperture is expressed by
| (10) |
where the ’s are Zernike polynomials, and are constant coefficients, then equation (9) produces first, second, and higher order terms in and . A measure of the magnitude of the phase aberration — , the largest absolute value of the deviation of the phase from its aperture-weighted mean — can be used to estimate the size of a particular order term in equation (9). Given any particular value of one can estimate where the terms in the above expansion become negligible (Perrin et al., 2003). For example, in the Advanced Camera for Surveys (ACS) coronagraph on the Hubble Space Telescope (HST), which sits in the aberrated beam, with about half a wave of spherical aberration at a wavelength of 800nm, one must use about seven terms of the above expansion to model the gross features of the aberrated field strength over the aperture.
4.1. Power leak through a top-hat band-limited coronagraph
We can calculate how an arbitrary polynomial phase aberration of the form propagates through the coronagraph to the Lyot plane, using this expansion. The calculation is straightforward for a square aperture because the limits of integration and the basis functions are separable. From equation (3) we see that the Lyot field for such an aberration is described by
| (11) |
for the ‘top-hat’ band-limited coronagraph design. This calculation becomes difficult to perform analytically when the mask transform function has a more extended support, as in a classical Lyot design.
We define the function
| (12) |
which enables us to write equation (11) as
| (13) |
in the interior of the Lyot plane in the case of unapodized apertures. We define the interior of the aperture as that part of the aperture (or image of the aperture, such as the Lyot plane) which is further than from any point on the aperture boundary (where is the bandwidth of the mask shape function). This is the area of the Lyot pupil which would not be obstructed by a Lyot stop in a perfect band-limited coronagraph (see Kuchner & Traub, 2002; Lloyd & Sivaramakrishnan, 2005; Sivaramakrishnan & Lloyd, 2005, for further detail). The aperture function is unity everywhere in the interior of the aperture for an unapodized entrance pupil, and so does not appear explicitly in equation (13).
The 2.4 m HST ACS coronagraph has an image plane stop diameter of , or resolution elements at 800 nm. Therefore the results we derive here for band-limited coronagraphs apply even though the ACS coronagraph is not band-limited, because its Lyot plane can be said to possess an ‘interior’ area which is further than a few scale lengths away from the annular aperture boundaries (see Sivaramakrishnan et al., 2001, for a discussion of the natural scale length in the Lyot plane).
Explicit evaluation is a matter of straightforward integration: the first few values of produce
| (14) |
The right hand sides of these equations are the first order residual Lyot field strength given a small phase aberration of over the entrance pupil of a one-dimensional band-limited coronagraph.
Low order phase aberrations, along with the resultant first and second order Lyot plane intensities are shown in each column of Fig. 3. The band limit of this coronagraph is . The fraction of incident power leaking through into the Lyot plane interior is presented in Table 1. Each power leak fraction is renormalized by dividing by the fractional coronagraphic throughput, which is the ratio of the areas of the optimal Lyot stop and the entrance aperture. For a band limit of this ratio is (e.g., Sivaramakrishnan et al., 2001).
5. Extension to the Sawtooth Band-Limited Coronagraph
Designs similar to the sawtooth (sinc-squared focal plane mask function) coronagraph are being considered for the James Webb Space Telescope’s Near Infrared Camera, as well as for a dedicated coronagraphic space telescope. In order to calculate how the sawtooth band-limited coronagraph leaks low order aberrations, we can define a function using the analogy of equation (12):
| (15) |
and carry out the same analysis as in section 4.1. We present the top-hat band-limited coronagraph’s response to low order aberrations (Fig. 3); the sawtooth coronagraph’s response is qualitatively similar. The latter coronagraph’s mask function’s Fourier transform is a sawtooth function, which also yields tractable algebraic expressions for the Lyot pupil field strength for any order. For the sawtooth design the residual Lyot field in the interior of the Lyot plane has similar algebraic properties to that of the top-hat design. The powers of the relevant physical quantities for the mask function of the sawtooth coronagraph are the same as those in equation (14), although the numerical coefficients differ slightly.
6. Secondary Mirror Alignment Errors
When considering a simple on-axis two-mirror telescope, errors in positioning the secondary mirror result in aberrations described by a few low order Zernike polynomials.
Off-axis designs may have different sensitivities, but their phase aberrations due to secondary mirror tilt, despace, and decenter are still described by combinations of low order polynomials.
6.1. Sensitivity to stop size
The amount of energy leaking into the interior of the Lyot pupil is proportional to the fourth power of the bandwidth of the stop, or the inverse fourth power of the stop size expressed in resolution elements. This follows from inspection of equation (14). The leaked energy finds is way into the final image plane, unless the Lyot stop is adjusted to block some of this light. This strong dependence must play a significant role when choosing a coronagraph design given a desired contrast ratio derived from a scientific goal.
6.2. Crosstalk between aberrations
When two aberration, either simple monomials or Zernike polynomials, are present simultaneously, the Lyot pupil field contains energy due to a ‘crosstalk’ term in addition to effects from each individual term, even in the first order calculation. Cataloguing the various crosstalk energy leaks is beyond the scope of this work: we restrict ourselves to a few simple, traditional aberrations.
6.3. The effects of tilt and defocus
Equation (14) demonstrates that for a band-limited coronagraph there is complete cancellation of the central source even for small tilt errors (). This particular result has already been derived by Kuchner & Traub (2002); Lloyd & Sivaramakrishnan (2005): here it is derived as part of the band-limited coronagraph’s response to a sequence of small polynomial phase errors.
The way focus affects the field strength in the interior of the Lyot plane can be found by inspection of the term in equation (14). Given an aberration of the the form , the field strength in the interior of the Lyot plane is , to first order. The interior of our coronagraph’s Lyot plane fills uniformly with in-phase light. The effective telescope diameter describing the residual PSF for a circular aperture is , so a fraction of incident power leaks through the coronagraph. It is distributed in an Airy pattern corresponding to an aperture in diameter, assuming an optimally undersized Lyot stop is used.
In the absence of other aberrations, this places a ‘ghostly PSF’ with a calculable intensity in the final image. The form of this PSF for a circular unobstructed entrance aperture is just the Airy pattern of the undersized Lyot stop used in the coronagraph. This residual PSF is not to be confused with the spot of Arago (Born & Wolf, 1993), whose intensity varies with occulter size, depending on the relative size of an occulter in the pupil plane and the Fresnel zones it obscures. The spot of Arago’s brightness fluctuates in intensity as one increases the pupil plane occulter size. The leaked PSF power we describe here does not possess undulating fluctuations, characteristic of the spot of Arago. The spot of Arago occurs with unaberrated wavefronts, whereas this leaked PSF is entirely dependent on the presence of aberrations in the wavefront.
The analytical result presented here leaves no unresolved questions pertaining to the numerical accuracy or rounding error. The approximations used in deriving this result become more accurate as the magnitude of the phase aberrations decrease, so this result is pertinent to coronagraphs designed for very high Strehl ratio, high dynamic range applications. The bandwidth of the focal plane mask function is the only coronagraphic parameter that enters into the light leak through the coronagraph due to inexact focus in these regimes.
We note in passing that if there is sufficient tilt error to merit a second order expansion of the pupil field strength, this second order tilt term will have a mathematically identical behavior to a small pure focus: a similar ‘ghostly’ PSF will appear in the final coronagraphic image. The fraction of incident power that leaks through the coronagraph can be calculated in a similar fashion to the way we estimate the power leak due to the first order effects of defocus. However, given the real or imaginary nature of the coefficients in the expansion of the electric field in terms of the phase, the second order effect of tilt is in quadrature with the first order focus term (the former being purely imaginary, the latter real), so the two cannot be made to cancel each other: they will add power to the Lyot field (and the final coronagraphic PSF) in quadrature.
If there is sufficient defocus to warrant a second order expansion of the pupil field, the amount of light leaking through the interior of the Lyot stop increases dramatically (Fig. 3, second row, second column).
6.4. Astigmatism
Small amounts of astigmatism have no first order effect on the band-limited coronagraph. This is easy to understand because of the separability of the polynomial, and the nature of the convolution in the definition of equation (14). The second order astigmatic power leak into the Lyot plane is comparable to that of the second order tilt term, especially at the edges of the interior of the Lyot stop (Fig. 3, third column). Thus, off-axis telescope designs with residual astigmatism could be used with Lyot stops which are undersized relative to a Lyot stop tailored for perfect optics.
6.5. Coma and spherical aberration
Leak through an unapodized Lyot coronagraph is dependent on local curvature of the wavefront, so the first order leak due to these terms is high, especially at the edges of the Lyot pupil interior. First order light leak into the Lyot pupil interior due to spherical aberration has the same form as that of the second order leak due to defocus (Fig. 3), but, because of the relative quadrature of the first and second order field strengths, these aberrations cannot be used to cancel each other by design.
7. Conclusion
Analytical studies of the mathematically simple band-limited coronagraph provide us with tools to help evaluate coronagraphic behavior without the need for extensive numerical investigations. The analysis also helps identify design strategies to reduce coronagraphic sensitivity to selected aberrations. Our results suggest that off-axis unobscured high dynamic range apertures can be allowed more astigmatism if the Lyot pupil of a band-limited coronagraph is reduced in size, thereby reducing the demands made upon the structural stability of the telescope.
The theory developed here suggests that the coronagraphic PSF of the nominally on-axis source can be used to determine best focus, by minimizing the on-axis intensity behind the focal plane mask, utilizing focus sweep data. If the imaging quality is sufficiently high, leaked power due to small tilts (i.e., small decentration of the target behind the focal plane mask, rather than moving the target out from behind the spot) can be used to determine the location of the focal plane mask. This latter exercise would aid astrometric calibration of the coronagraph.
Further theoretical analyses of coronagraphic response to aberrations could assist coronagraph design and operational plans to be made, to improve the scientific productivity of high dynamic range space-based coronagraphs dedicated to detecting and characterizing extrasolar planets.
References
- Aime & Soummer (2002) Aime, C. & Soummer, R. 2002, in Astronomy With High Contrast Imaging: from planetary systems to avtive galactic nuclei, C. Aime & R. Soummer Eds (EAS Publication Series)
- Aime & Soummer (2003) Aime, C. & Soummer, R. 2003, EAS Publications Series, Volume 8, 2003. Astronomy with High Contrast Imaging, Proceedings of the conference held 13–16 May, 2002 in Nice, France. Edited by C. Aime and R. Soummer, 8
- Aime et al. (2002) Aime, C., Soummer, R., & Ferrari, A. 2002, A&A, 389, 334
- Bloemhof et al. (2001) Bloemhof, E. E., Dekany, R. G., Troy, M., & Oppenheimer, B. R. 2001, ApJ, 558, L71
- Born & Wolf (1993) Born, M. & Wolf, E. 1993, Principles of Optics, 6th ed. (Cambridge: Cambridge University Press)
- Breckinridge & Oppenheimer (2004) Breckinridge, J. B. & Oppenheimer, B. R. 2004, ApJ, 600, 1091
- Digby et al. (2004) Digby, A. P., Oppenheimer, B. R., Newburgh, L., Brenner, D., Shara, M., Mey, J., Mandeville, C., Makidon, R. B., Sivara- makrishnan, A., Soummer, R., Graham, J. R., Kalas, P., Perrin, M. D., Roberts, L. C., Kuhn, J., Whitman, K., & Lloyd, J. P. 2004, in Proc. SPIE Vol. 5490, Advances in Adaptive Optics, Roberto Ragazzoni and Domenico Bonaccini; Eds.
- Frigo & Johnson (1997) Frigo, M. & Johnson, S. G. 1997, in Technical Report MIT-LCS-TR-728 (Massachusetts Institute of Technology)
- Green et al. (2003) Green, J. J., Shaklan, S. A., & Redding, D. C. 2003, in Proc. SPIE, Vol. 4860, High-Contrast Imaging for Exo-planet Detection, ed. A. B. Schultz & R. G. Lyon
- Greenfield et al. (2003) Greenfield, P., Miller, J. T., Hsu, J.-C., & White, R. L. 2003, in PyCon 2003 Proceedings, ed. S. Holden
- Greenfield et al. (2002) Greenfield, P., Miller, T., Hsu, J.-C., & White, R. L. 2002, in ASP Conf. Ser. 281: Astronomical Data Analysis Software and Systems XI, 140–+
- Hunter (2005) Hunter, J. 2005, The Matplotlib User’s Guide (University of Chicago Medical School)
- Kasdin et al. (2003) Kasdin, N. J., Vanderbei, R. J., Spergel, D. N., & Littman, M. G. 2003, ApJ, 582, 1147
- Kuchner & Traub (2002) Kuchner, M. J. & Traub, W. A. 2002, ApJ, 570, 900
- Lloyd & Sivaramakrishnan (2005) Lloyd, J. P. & Sivaramakrishnan, A. 2005, ApJ, 621, 1153
- Lyot (1930) Lyot, B. 1930, C. R. Acad. Sci Paris, 191, 834
- Lyot (1939) —. 1939, MNRAS, 99, 580
- Mahajan (1981) Mahajan, V. N. 1981, JOSA, 71, 75
- Makidon et al. (2005) Makidon, R. B., Sivaramakrishnan, A., Perrin, M. D., i Roberts, L. C., Oppenheimer, B. R., Soummer, R., & Graham, J. R. 2005, PASP, in press
- Malbet (1996) Malbet, F. 1996, A&AS, 115, 161
- Nisenson & Papaliolios (2001) Nisenson, P. & Papaliolios, C. 2001, ApJL, 549
- Noll (1976) Noll, R. J. 1976, Optical Society of America Journal, 66, 207
- Oppenheimer et al. (2004) Oppenheimer, B. R., Digby, A. P., Newburgh, L., Brenner, D., Shara, M., Mey, J., Mandeville, C., Makidon, R. B., Sivaram- akrishnan, A., Soummer, R., Graham, J. R., Kalas, P., Perrin, M. D., Roberts, L. C., Kuhn, J., Whitman, K., & Lloyd, J. P. 2004, in Proc. SPIE Vol. 5490, Advances in Adaptive Optics, Roberto Ragazzoni and Domenico Bonaccini; Eds.
- Oppenheimer et al. (2003) Oppenheimer, B. R., Sivaramakrishnan, A., & Makidon, R. B. 2003, Imaging Exoplanets: The Role of Small Telescopes (The Future of Small Telescopes In The New Millennium. Volume III - Science in the Shadow of Giants), 155
- Perrin et al. (2003) Perrin, M. D., Sivaramakrishnan, A., Makidon, R. B., Oppen- heimer, B. R., & Graham, J. R. 2003, ApJ, 596, 702
- Sivaramakrishnan et al. (2001) Sivaramakrishnan, A., Koresko, C. D., Makidon, R. B., Berkefeld, T., & Kuchner, M. J. 2001, ApJ, 552, 397
- Sivaramakrishnan & Lloyd (2005) Sivaramakrishnan, A. & Lloyd, J. P. 2005, ApJ, in press
- Sivaramakrishnan et al. (2002) Sivaramakrishnan, A., Lloyd, J. P., Hodge, P. E., & Macintosh, B. A. 2002, ApJ, 581, L59
- Soummer (2005) Soummer, R. 2005, ApJ, 618, L161
- Soummer et al. (2003a) Soummer, R., Aime, C., & Falloon, P. 2003a, A&A, 397, 1161
- Soummer et al. (2003b) Soummer, R., Dohlen, K., & Aime, C. 2003b, A&A, 403, 369
| 99% Strehl | 98% Strehl | 95% Strehl | ||||||
|---|---|---|---|---|---|---|---|---|
| 1st Order | 2nd Order | 1st Order | 2nd Order | 1st Order | 2nd Order | |||
| Power | Power | Power | Power | Power | Power | |||
| Tilt | ||||||||
| Focus | ||||||||
| Astig | ||||||||
| Coma | ||||||||
| Sphere | ||||||||