Time scales of Li evolution: a homogeneous analysis of open clusters from ZAMS to late-MS
We have performed a new and homogeneous analysis of all the Li data available in the literature for main sequence stars (spectral-types from late F to K) in open clusters. In the present paper we focus on a detailed investigation of MS Li depletion and its time scales for stars in the 6350–5500 K effective temperature range. For the first time, we were able to constrain the age at which non-standard mixing processes, driving MS Li depletion, appear. We have also shown that MS Li depletion is not a continuous process and cannot be simply described by a law. We confirm that depletion becomes ineffective beyond an age of 1–2 Gyr for the majority of the stars, leading to a Li plateau at old ages. We compared the empirical scenario of Li as a function of age with the predictions of three non-standard models. We found that models including only gravity waves as main mixing process are not able to fit the Li vs. age pattern and thus this kind of mixing can be excluded as the predominant mechanism responsible for Li depletion. On the other hand, models including slow mixing induced by rotation and angular momentum loss, and in particular those including also diffusive processes not related to rotation, can explain to some extent the empirical evidence. However, none of the currently proposed models can fit the plateau at old ages.
Key Words.:
Stars: abundances – Li – Stars: Evolution – Open Clusters and Associations: Individual:1 Introduction
Lithium, as well as the other light elements beryllium and boron, is burned at relatively low temperatures in stellar interiors ( K). As a consequence, it survives only in the external layers of a star and it is a very powerful tracer of mixing mechanisms at work in stellar structures.
A huge amount of observational and theoretical work has been devoted to the understanding of Li and its evolution. In particular, during the last two decades, several datasets for Li in open clusters and in both Population i and ii field stars have been collected. Focusing on Pop. i, observations of unevolved stars in open clusters and the field evidenced several features that disagree with the predictions of the standard models. With “standard” or “classical” we refer to those models that include convection only as a mixing process and do not take into account transport phenomena like diffusion, gravity waves, angular momentum loss and transport, etc. The main open problems concerning Li evolution during the pre-main sequence (PMS) and main sequence (MS) phases of solar-type and lower mass stars have been recently discussed by Jeffries (jef_cast04 (2005)) and Randich (R05_cast04 (2005)) and are summarized below:
(i) PMS: G-type stars hotter than 5300–5400 K in zero-age main sequence ( ZAMS, 30–100 Myr) open clusters (e.g., Soderblom et al. 1993b — hereafter S93b; Randich et al. R98 (1998); Randich et al. R01 (2001)) have Li abundances ((Li)) only slightly below the initial abundance for Pop. i stars ((Li), see, e.g., Jeffries jef_cast04 (2005)); a larger amount of PMS Li depletion is instead expected from standard models. Note however that the predicted Li destruction strongly depends on the physical assumptions adopted in stellar codes. In addition, K-type stars of presumably similar effective temperatures () in clusters younger than Myr are characterized by a wide dispersion in Li abundance whose origin is not yet understood, although different explanations have been proposed.
(ii) MS: at variance with standard model predictions, the empirical evidence for clusters older than the Pleiades (e.g., the Hyades; Thorburn et al. T93 (1993) —hereafter T93) suggests that solar-type stars do deplete their photospheric Li after having reached the ZAMS. Another puzzling feature concerns the discovery of a “Li dip” for F-type stars around 6700–7000 K (e.g. Balachandran bala95 (1995) and references therein): stars of the Hyades and clusters of similar (and older) ages within this range have Li abundances lower by a factor 30 (or more) than those of stars within a range of 300 K. Such a gap in the Li distribution may start appearing at ages as young as 200 Myr (see Steinhauer & Deliyannis SD04 (2004) and references therein).
Observations of old open clusters show that past the Hyades age Li depletion for solar analogs can be either very slow or very fast: in fact, solar-type stars in the solar age/solar metallicity M~67 are characterized by a large amount of dispersion in Li (see Pasquini et al. P97 (1997), Jones et al. jones99 (1999) and references therein), with about 40 % of the stars more Li depleted (by factors 5–10) than the remaining fraction (“upper envelope”). On the other hand, the other old open clusters investigated so far (IC~4651 and NGC~3680, Randich et al. R00 (2000); NGC~188, Randich et al. R03 (2003); NGC 752, Sestito et al. sestito04 (2004)) have tight Li distributions with abundances similar to those in the upper envelope of M 67 and only 2 times lower than those of similar stars in the Hyades. We mention that preliminary analysis of the old cluster Cr 261 suggests that this cluster could also be characterized by a dispersion, although not as large as the one observed in M 67 (Pallavicini et al. pal05 (2005)). A large spread similar to that present in M 67 is also observed for solar analogs in the field (e.g., Pasquini et al. P94 (1994)); the Sun is representative of Li-poor stars in the field, and its Li abundance cannot be reproduced by standard models.
(iii) Finally, Li depletion does not seem to significantly depend on the cluster metal content; both young and old clusters with different metallicities — varying within dex around the solar [Fe/H] — seem to share a very similar Li distribution (e.g., Jeffries & James blanco1 (1999); Sestito et al. sestito03 (2003), sestito04 (2004)).
These puzzling features, not expected from standard models, suggest that Li depletion is not driven uniquely by convection, and that extra-mixing processes (or processes able to inhibit Li depletion during the PMS) not included in classical theory are at work in stars during the various evolutionary phases. Several efforts have been done in the last years aimed to understand this (these) process(es) and non-standard models have been developed, but so far the mechanism(s) driving Li depletion remain(s) poorly constrained.
In the present paper we focus on point (ii) above, and more specifically on the detailed investigation of MS Li depletion and its time scales in solar-type stars. Since proposed non-standard mixing processes have different time scales of Li depletion, our main goal is to put empirical constraints on these time scales for stars with different temperatures/masses and thus to provide feedback to the models. In order to carry out such an analysis, not only the number of observed open clusters and of stars per cluster should be enlarged to have a good age sampling, but — most important — all the already available Li data for open clusters should be analyzed with the same method, to reduce the possibility of spurious results due to an inhomogeneous analysis.
For this reason, we collected all the available information on Li in late F, G and K-type MS stars in open clusters and we performed a new analysis of Li abundances111The database is available upon request to P. Sestito.. Our final objective is to provide a homogeneous (at least as far as the analysis is concerned) database for open clusters, that can be used to study Li evolution and to test theoretical models. We stress that, whereas most of the papers on Li in open clusters have so far focused on the comparison of samples with similar ages or in a restricted age range, our goal here is to investigate the evolution of Li and its timescales from the ZAMS up to very old ages. The database will be also made available in the web. Note that the discussion in the present paper focuses on MS Li depletion in solar-type stars, but we included in the database also warmer and cooler stars (F and K-type) in order to provide a more complete picture for Li evolution in open clusters. F and K-type stars will not be discussed here, since they are characterized by different structures and evolutionary histories with respect to solar analogs and deserve to be studied separately.
As a final but fundamental remark we would like to emphasize that, even though our method of analysis can be affected by systematic errors, we are interested in the investigation of differential depletion of Li during the MS and not in the absolute abundance values for each cluster: in this context, the importance of performing a consistent analysis with all the samples on the same scale appears even more evident.
In Sect. 2 we present the data sample, while in Sect. 3 the method of analysis is described; Sect. 4 includes the results and a discussion; some conclusions are reported in Sect. 5.
| Cluster | Ref. | Age | Ref. | Ref. | [Fe/H] | Ref. | range | No. of | |||
|---|---|---|---|---|---|---|---|---|---|---|---|
| Li data | (Gyr) | age | (mag) | (mag) | distance, reddening | [Fe/H] | (K) | stars (*) | |||
| NGC 2264 | 1 | 0.005 | 2 | 9.4 | 0.071 | 57 | 0.15 | 77 | 4050–6350 | 12(4) | 50–100 |
| 2 | 4100–5550 | 37(8) | 25–105 | ||||||||
| IC~2602 | 3,4 | 0.030 | 43 | 6.11 | 0.04 | 58 | 0.05 | 4 | 4150–6450 | 31(1) | 30–100 |
| IC 2391 | 5 | 0.030 | 5 | 6.05 | 0.01 | 59,60 | 0.03 | 4 | 4100–6050 | 6 | – |
| IC~4665 | 6 | 0.035 | 44 | 8.3 | 0.18 | 61 | – | – | 4750–5950 | 13 | – |
| NGC 2547 | 7 | 0.035 | 45 | 8.30 | 0.06 | 62 | sub-solar | 7 | 4100–5100 | 7(2) | 80–190 |
| Per | 8,9 | 0.050 | 8 | 6.06 | 0.08 | 63 | 0.05 | 78 | 4450–6450 | 39 | 100–200 |
| 10 | 4150–5400 | 18 | – | ||||||||
| NGC~2451 | 11 | 0.050 | 46 | 7.57 | 0.05 | 64,65 | 0.01 | 11 | 4350–6350 | 17(5) | 20–150 |
| Pleiades | 12 | 0.07 | 47 | 5.36 | 0.04 | 66,67 | 0.03 | 78 | 4100–4700 | 7 | – |
| 13 | 4000–6500 | 95(22) | – | ||||||||
| 14 | 4000–4250 | 4 | 90–300 | ||||||||
| 15 | 4050–5250 | 10 | 70 | ||||||||
| 16 | 4750–5150 | 9(1) | 90–110 | ||||||||
| Blanco 1 | 17 | 0.1 | 48 | 6.9 | 0.02 | 68 | +0.14 | 17 | 4550–5850 | 17 | 30 |
| NGC~2516 | 18 | 0.15 | 49 | 8.18 | 0.12 | 69 | 18 | 4810–6250 | 22(3) | 10–65 | |
| M~35 | 19 | 0.2 | 50 | 9.60 | 0.225 | 50 | 0.21 | 19 | 4750–6250 | 27 | 40–160 |
| NGC~6475 | 20 | 0.25 | 49 | 7.35 | 0.06 | 70,20 | +0.14 | 22 | 4450–6400 | 24(6) | 15–50 |
| 21 | 5150–6200 | 10 | – | ||||||||
| 22 | 5000–6300 | 32(11) | 50–150 | ||||||||
| M~34 | 23 | 0.25 | 49 | 8.28 | 0.07 | 71,72 | +0.07 | 79 | 4150–6450 | 38(3) | 70 |
| Coma Ber | 24 | 0.6 | 51 | 4.71 | 0.013 | 73,64 | 0.05 | 80 | 6200 | 1(1) | 75–105 |
| 25 | 4200–6300 | 14(4) | 150–250 | ||||||||
| 26 | 4950–6200 | 13(2) | 200 | ||||||||
| NGC~6633 | 27 | 0.6 | 52 | 7.77 | 0.017 | 27 | 0.10 | 27 | 4600–6500 | 22(3) | 100 |
| Hyades | 24,28 | 0.6 | 53 | 3.31 | 0.01 | 53,64 | +0.13 | 78 | 4900–6200 | 14(1) | 90–120 |
| 29 | 4600–6400 | 58(31) | 150–220 | ||||||||
| Praesepe | 30 | 0.6 | 30 | 6.39 | 0.009 | 64 | +0.03 | 80 | 4850–6450 | 57(22) | 100 |
| NGC 752 | 31 | 2 | 54 | 8.25 | 0.035 | 74 | +0.01 | 32 | 4900–6350 | 5 | 30–80 |
| 32 | 5550–6300 | 18(1) | 50–80 | ||||||||
| NGC 3680 | 33 | 2 | 54 | 10.5 | 0.05 | 75 | 0.17 | 34 | 5900–5950 | 2(1) | 30–60 |
| 34 | 5900–5950 | 4(1) | 60–150 | ||||||||
| IC 4651 | 33 | 2 | 54 | 10.1 | 0.083 | 76 | +0.10 | 81 | 5800–6250 | 10(1) | 30–60 |
| M 67 | 35 | 5 | 55 | 9.69 | 0.05 | 56,39 | 0.05 | 82 | 5650–6200 | 6 | – |
| 36 | 5900–6000 | 3 | 20–70 | ||||||||
| 37 | 6150–6200 | 3(1) | 50–100 | ||||||||
| 38 | 5900–6150 | 7(2) | 50 | ||||||||
| 39 | 5500–6150 | 25(1) | 60–100 | ||||||||
| 40 | 5900–6150 | 2 | 100–200 | ||||||||
| NGC 188 | 41 | 8 | 56 | 11.44 | 0.09 | 56 | +0.01 | 42 | 5750–5950 | 2 | 45 |
| 42 | 5700–6000 | 11 | 20–35 |
* = The number in brackets in Col. 11 indicates the number of binaries present in the samples.
References: (1) King (king (1998)); (2) Soderblom et al. (sod2264 (1999)); (3) Randich et al. (R97 (1997)); (4) Randich et al. (R01 (2001)); (5) Stauffer (stauffer2391 (1989)); (6) Martín & Montes (mm97 (1997)); (7) Jeffries et al. (jef2547 (2003)); (8) Balachandran et al. (bala88 (1988)); (9) Balachandran et al. (bala96 (1996)); (10) Randich et al. (R98 (1998)); (11) Hünsch et al. (hun04 (2004)); (12) Butler et al. (butler (1987)); (13) Soderblom et al. (1993b ; S93b); (14) García López et al. (GL94 (1994)); (15) Jones et al. (jones96 (1996)); (16) Jeffries (1999b ); (17) Jeffries & James (blanco1 (1999)); (18) Jeffries et al. (jef2516 (1998)); (19) Barrado et al. (barrado35 (2001)); (20) James & Jeffries (JJ97 (1997)); (21) James et al. (J00 (2000)); (22) Sestito et al. (sestito03 (2003)); (23) Jones et al. (jones97 (1997)); (24) Soderblom et al. (S90 (1990)); (25) Jeffries (1999a ); (26) Ford et al. (fordcoma (2001)); (27) Jeffries et al. (jef6633 (2002)); (28) Soderblom et al. (S95 (1995)); (29) Thorburn et al. (T93 (1993); T93); (30) Soderblom et al. (1993c ); (31) Hobbs & Pilachowski (1986a ); (32) Sestito et al. (sestito04 (2004)); (33) Randich et al. (R00 (2000)); (34) Pasquini et al. (P01 (2001)); (35) Hobbs & Pilachowski (1986b ); (36) Spite et al. (spite87 (1987)); (37) García López et al. (GL88 (1988)); (38) Pasquini et al. (P97 (1997)); (39) Jones et al. (jones99 (1999)); (40) Randich et al. (R02 (2002)); (41)Hobbs & Pilachowski (HP88 (1988)); (42) Randich et al. (R03 (2003)); (43) Stauffer et al. (stauffer97 (1997)); (44) Mermilliod et al. (mermi (1981)); (45) Naylor et al. (naylor (2002)); (46) Hünsch et al. (hun03 (2003)); (47) Patenaude (pate (1978)); (48) Panagi & O’Dell (panagi (1997)); (49) Meynet et al. (meynet (1993)); (50) Sung & Bessel (phot_sung99 (1999)); (51) García López et al. (GL00 (2000)); (52) Strobel (strobel (1991)); (53) Perryman et al. (phot_perryman (1998)); (54) Friel (friel95 (1995)); (55) Hobbs & Thorburn (ht91 (1991)); (56) Sarajedini et al. (Sa99 (1999)) (57) Sung et al. (phot_sung97 (1997)); (58) Whiteoak (phot_white (1961)); (59) Becker & Fenkart (phot_bf70 (1970)); (60) Patten & Simon (phot_ps96 (1996)); (61) Prosser (phot_prosser93 (1993)); (62) Claria (phot_claria (1982)); (63) Mitchell (phot_mitch (1960)); (64) Lyngå Catalogue (1987 — fifth edition; Lyngå lynga (1985)); (65) Feinstein (fein (1966)); (66) Robichon et al. (phot_robichon (1999)); (67) Stauffer & Hartmann (phot_sh87 (1987)); (68) Epstein & Epstein (phot_epep (1985)); (69) Dachs & Kabus (phot_dk89 (1989)); (70) Snowden (phot_snowden (1976)); (71) Ianna & Schlemmer (phot_is93 (1993)); (72) Jones & Prosser (jp96 (1996)); (73) Odenkirchen et al. (phot_oden (1998)); (74) Daniel et al. (daniel (1994)); (75) Nordström et al. (phot_nord (1997)); (76) Anthony-Twarog et al. (phot_AT (1988)); (77) King (king93 (1993)); (78) Boesgaard & Friel (bf90 (1990)); (79) Schuler et al. (schuler (2003)); (80) Friel & Boesgaard (fb92 (1992)); (81) Pasquini et al. (P04 (2004)); (82) Randich et al. (R05 (2005)).
2 Data samples
Our sample includes 22 clusters (listed in Col. 1 of Table 1) with different ages and metallicities (Cols. 3 and 8; the references for age and [Fe/H] are reported in Cols. 4 and 9 respectively, while Col. 2 lists references for Li data). Cols. 5 to 7 list the distance modulus and reddening with the proper reference(s). For the present analysis we considered stars with 4000 6500 K; as mentioned, the discussion in Sect. 4 will concern solar-type stars, i.e. objects with 5500 6350 K.
The ages of the clusters range from 5 Myr for NGC~2264, to 6–8 Gyr for NGC 188, while [Fe/H] values are within an interval of 0.2 dex from solar. We considered the “classical” ages for each cluster, i.e. those determined from isochrone fitting. We would like to stress here that, as Table 1 shows, our assumptions for cluster ages are a collection of independent determinations, i.e. they were derived by different authors and using disparate models. Thus our dataset is not homogeneous as far as ages are concerned. In addition, we mention that for four young clusters included in our sample (IC~2391, NGC~2547, $α$ Per, Pleiades) new independent estimates of the ages have been obtained based on the position of the “Li depletion boundary” (LDB; see Stauffer et al. LDBple (1998), LDBaPer (1999); Barrado y Navascués et al. LDB2391 (2004); Jeffries & Oliveira JO05 (2005)). LDB ages are in general higher than the classical ones: in the references mentioned above ages of 50 Myr for IC 2391, 90 Myr for Per and 125 Myr for the Pleiades have been reported, to be compared with those listed in Table 1. In the case of NGC 2547 (Jeffries & Oliveira JO05 (2005)) there is instead a perfect agreement between the LDB age and the classical one (35 Myr).
The classical methods for estimating the age of a cluster, i.e. the fit of the turn off or of the low MS, are affected by uncertainties mainly due to physical inputs adopted in models; on the contrary, the LDB technique is less model dependent. However, we adopt here the classical ages to be consistent with the whole sample, since LDB ages are available only for four clusters.
The metallicities listed in Table 1 were all derived from high-resolution data (see the quoted references), with the exception of those of NGC 2264 and NGC 6633 that were estimated from intermediate resolution spectra (King king93 (1993); Jeffries et al. jef6633 (2002)); however these are the most recent and reliable estimates for the Fe content of the two samples. No estimate of the metallicity is available for IC 4665; for NGC 2547 we only indicate that the cluster has a sub-solar Fe content (see also Jeffries et al. jef2547 (2003)) since no precise estimate is present in the literature. As in the case of ages, we caveat that also the [Fe/H] values for most clusters were not derived with a homogeneous analysis, with exception of IC 2391, IC 2602, NGC 2451, NGC 6475, NGC 752, M67 for which we have derived the metallicity on the same scale as for the Hyades.
Several clusters were studied by more than one author; in these cases we identified the stars in common between the different samples and we selected the more recent observations (which have in most cases a better signal-to-noise ratio — — and/or higher resolving powers — ); among the various clusters the data selection for the Pleiades deserves a slightly more accurate description. For this cluster we adopted the following priority order: (1) data of Jeffries (1999b ); the author carried out observations of a sample of cool Pleiades stars in order to investigate the variability of Li i and K i and its possible relationship with the spread among K-type objects. For this reason several objects were observed twice (November 1997 and November 1998): since the equivalent widths () measured from the two sets of spectra are in good agreement (no Li variability was found over a 1 year time scale) we chose the value obtained from the spectrum with the highest ratio. In one case the two spectra have the same and thus we computed an average of the s; (2) data of Jones et al. (jones96 (1996); although they have lower than those of García López et al. (GL94 (1994)), the resolution is higher); (3) data of S93b, if the spectra has a “a” quality (see the quoted reference), otherwise (4) data of García López et al. (GL94 (1994)). We preferred the “a” quality data of S93b with respect to those of García López et al. (GL94 (1994)) since they have in principle a slightly better ; we note however that this subsample contains only two stars, for which the errors in quoted by the two authors are very similar; (5) data of Butler et al. (butler (1987)). Note that S93b re–observed some stars included in the sample of Butler et al., but they quoted a larger error in with respect to the previous paper (and thus, probably a worse ). For this reason, we retained the original measurements by Butler et al. (butler (1987)). Finally, (6) all the remaining stars included in the sample of S93b.
The number of stars and the relative range of effective temperatures (as computed by us, see Sect. 3.1) for each sample are reported in Cols. 11 and 10 of Table 1, while the references for the source papers are listed in Col. 2. Most obviously only confirmed cluster members were considered. The number in brackets in Col. 11 represents the number of binaries present in the samples; double systems can be safely included in our analysis since in general they do not affect the Li distributions (but see also Sect. 4.2).
We finally mention that the cluster datasets considered here were observed during the last 20 years using different telescopes and/or instruments; therefore, the various subsamples are characterized by disparate and . Spectral resolutions range from 1 Å in the case of NGC 2264 (Soderblom et al. sod2264 (1999)) up to 0.1 Å () for NGC 752 and NGC 188 (Sestito et al. sestito04 (2004); Randich et al. R03 (2003)); ratios (listed in Col. 12 of Table 1) range approximatively from 20–30 — e.g., in the cases of Blanco 1 (Jeffries & James blanco1 (1999)) and of the old and rather distant cluster NGC 188 (Randich et al. R03 (2003)) — up to the very good quality of the spectra of some stars in in the Pleiades ( — García López et al. GL94 (1994)), in Per ( — Balachandran et al. bala88 (1988)), in NGC 6475 ( — Sestito et al. sestito03 (2003)) and other young/intermediate age clusters. In other words, from the point of view of the data quality the complete set cannot be considered homogeneous; homogeneity would imply that all the stars in all the clusters should have been re-observed with a unique instrument and possibly in similar weather conditions. Thus, a homogeneous dataset on the point of view of cannot be obtained, since also spectra collected during the same night can be characterized by discrepant qualities due to changes in weather conditions.
Errors in s depend on the ratio of the spectra, but also the spectral resolution affects the estimate of the Li s: as we will explain in more detail in Sect. 3.2 this spectral feature can be blended with a nearby Fe i line. When the resolution is not large enough (or in presence of large rotation) the two lines cannot be separated and we subtract the contribution of the Fe i feature to the total using an analytical expression in which (Fe) is a function of . As a consequence, Li abundances derived from spectra with different resolving powers are differently affected by errors introduced with the theoretical estimate of the Fe contribution (see Sect.3.3.1).
3 Li analysis
3.1 Effective temperature
We started our new analysis from the published s of the Li i line and from photometry used in the original papers; the proper references will be reported in the web database. As already mentioned, the adopted reddening values towards each cluster are listed in Col. 6 together with the reference (Col. 7). Note that the values adopted for each cluster are rather “safe”, in the sense that discrepancies with other estimates reported in the literature are very low ( 0.03 mag at most); this is due to the fact that the clusters considered in the current analysis are relatively close and well studied. In addition, none of the sample clusters is characterized by differential reddening (see the database by J.-C. Mermilliod and references therein — http://obswww.unige.ch/webda).
We decided to use photometry since for the large majority of F, G and K-type stars there are by far more observations available than for any other color index: this allows us not to restrict the dataset too much (for example photometry is in general available only for cool stars). In addition, and most important, it has been shown (Soderblom et al. 1993a — hereafter S93a; T93) that colors provide reliable values at least for F and G-type stars, the latter ones being the objects of main interest for our investigations; in fact, photometric temperatures obtained from color indices are in general in good agreement with temperatures obtained via spectroscopic analysis (see, e.g., Sestito et al. sestito04 (2004)). On the other hand, are not very good indicators for cool and/or active stars: first of all there is an intrinsic effect due to the fact that at lower the peak of the blackbody distribution shifts towards lower energies (higher wavelengths); for this reason, the dependence of the effective temperature on becomes rather flat for above 1 (see, e.g., Gray gray (1976); Bessel bessel (1979)). Second, as discussed by S93a, in ultra-fast rotators, which represent a significant fraction of young late-type objects, colors can be altered either by effects of surface activity (e.g., spots; Stauffer et al. stauffer84 (1984)) or the color distortion may arise from structural changes due to rotation.
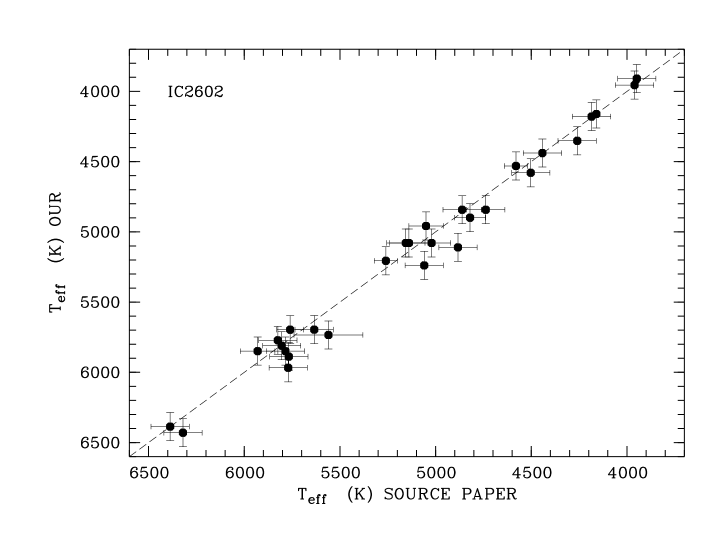
In order to check on possible differences among derived from different color indices, particularly for young cool and active stars, we show in Fig. 1 a comparison between the derived by us from photometry (see below) and those published in the original papers for the young cluster IC 2602 (Randich et al. R97 (1997); R01 (2001)), derived as an average of the results from two calibrations (based on and ). The figure indicates that the two sets of temperatures are in good agreement, not only for warm stars, but also for cooler objects, implying that the use of colors should not introduce major internal errors in the present study.
Effective temperatures were computed by us from dereddened colors using the calibration of S93a: K; the authors found this temperature scale to be reasonably consistent with the temperatures used for the Pleiades by Boesgaard & Friel (bf90 (1990)), who performed a calibration using F-type stars, and with that of Arribas & Rogers (arribas (1989)) derived from cool stars with the IR flux method.
3.2 Li abundances
The Li i feature can be blended with a nearby Fe i line at , depending on the spectral resolution; for this reason, if necessary, the s were corrected from the Fe contribution following the prescriptions of S93b: (Fe)=20. For the following samples the resolving power was high enough to allow the separation of the two features: Pleiades of Jones et al. (jones96 (1996)), M 34 (Jones et al. jones99 (1999)), NGC 752 (Sestito et al. sestito04 (2004), Hobbs & Pilachowski 1986a ) and NGC 188 of Randich et al. (R03 (2003)). On the other hand, James & Jeffries (JJ97 (1997)) and James et al. (J00 (2000); for NGC 6475), Jeffries & James (blanco1 (1999); Blanco 1) and Balachandran et al. (bala88 (1988), bala96 (1996); Per) published s already corrected from the Fe i contribution but with a method different from that of S93b. Sestito et al. (sestito03 (2003)) carried out a Li analysis of NGC 6475 and showed that, for stars in common with James & Jeffries (JJ97 (1997)) and James et al. (J00 (2000)), there is a good agreement between the different sets of deblended s. Also Randich et al. (R98 (1998)), in the analysis of Per trusted in the Fe i correction performed by Balachandran et al. (bala88 (1988), bala96 (1996)). Thus, we could safely use the deblended equivalent widths reported by these authors. We finally mention that upper limits in were never corrected for the Fe i blending.
Li abundances were computed from and deblended s by an interpolation of the curves of growth (COG) of S93b. These authors tested the accuracy of the results obtained from the COGs and reduced the possible systematic errors by calculating also synthetic spectra for broad-line stars. The two techniques were found to be in good agreement, while discrepant results for a subsample of stars were attributed to the saturation of the lines; a brief discussion of systematic errors due to different methods of analysis is reported in Sect. 3.3.2
The COGs of S93b are based on the assumption of local thermodynamic equilibrium (LTE), thus Li abundances were corrected for non-local thermodynamic equilibrium (LTE) effects — which are very important especially in the case of cool stars — using the prescription of Carlsson et al. (carlsson (1994)).
3.3 Uncertainties in Li abundances
3.3.1 Random errors
Random errors in Li abundances derive mainly from uncertainties in effective temperatures — due to photometry uncertainties — and in s, while other parameters, such as surface gravities and microturbulence velocities do not significantly affect the determination of Li abundance from the Li i feature.
Random errors in s come obviously from uncertainties in the measurement, depending on the of the spectrum, and in addition, as mentioned in Sect. 2, they depend on the spectral resolution, i.e. on whether or not the Li i doublet can be resolved from the nearby Fe i line. In order to check how large can be the error introduced in estimating (Fe) via the correction of S93b, we measured its value in spectra of stars with different and for which we were able to separate the two features. We found that for solar-type stars ( 5700 K; in NGC 752) the measured (Fe) range between 9 and 12 mÅ, while one would obtain (Fe) 10 mÅ using the S93b formula; for hotter stars ( 6200 K) the observed (Fe) is 5–8 mÅ (analytical: 7 mÅ), while for cooler stars (in the Hyades) around 5000 K the analytical estimate gives 14 mÅ, to be compared with our measurement of (Fe) ranging from 13 up to 18. Therefore, the largest difference between the measured s(Fe) and those estimated with the S93a prescriptions is of the order of 5 mÅ: this difference can be significant only in the worse case of rather cool stars (below 5000 K) and low ( 10–20 mÅ) since it would correspond to an error in (Li) of 0.15 dex. Note however that stars with below 5000 K in young cluster have much larger Li s; on the other hand, the few measurements at these temperatures in older clusters (e.g., Coma Ber) are upper limits in Li, from which the Fe i contribution is not subtracted. On the contrary, for solar-type stars in old clusters (e.g., with 6000 K and 50 mÅ), even in the most conservative case, an error of 5 mÅ would correspond to 0.05 dex in (Li), which is well below the uncertainties usually estimated for these objects.
Errors in s were published in the original paper only for a part of the clusters in the dataset; for these samples we retrieved the published and we assumed errors in effective temperatures according to the uncertainties in the photometry or in the same , when quoted by the authors using calibrations consistent with ours. Thus, we were able to estimate errors in Li abundances by quadratically adding and .
On the other hand, for about half of the sample (including the most populous ones — Pleiades of S93b and Jones et al. jones96 (1996), Hyades of T93 and Praesepe) and for each star were not reported in the original papers and the authors quoted only typical average errors in these parameters or in (Li). In those cases we computed a mean error for each cluster starting from the typical average uncertainties.
A detailed description of the error estimates for each cluster is given in Appendix.
3.3.2 Systematic errors
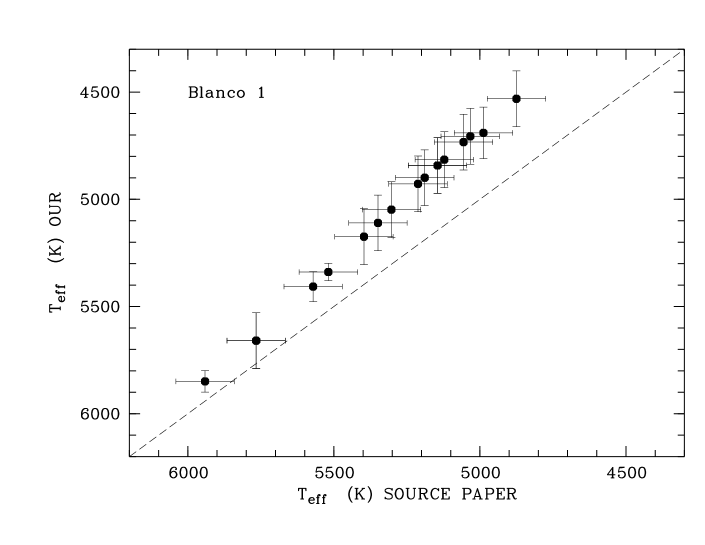
In order to investigate possible systematic effects on our temperature scale, in Figure 2 we compare the values determined by us for the 100 Myr old open cluster Blanco 1 with those derived by Jeffries & James (blanco1 (1999)): this is the sample for which we found the largest difference between our scale and that used by previous authors. Jeffries & James (blanco1 (1999)) derived effective temperatures for the hottest star () from colors using the calibration of Saxner & Hammarbäck (SH85 (1985)), which contains a metallicity dependent term; for cooler objects Jeffries & James applied the Böhm-Vitense (bohm (1981)) solar metallicity calibration modified to take into account the higher than solar Fe content of this cluster ([Fe/H] ; Jeffries & James blanco1 (1999)). Random errors in our were estimated from uncertainties in the photometry (ranging from up to 0.03), while for the temperatures of Jeffries & James we considered an average error bar similar to those plotted in their Fig. 1 (since they do not quote a value in their tables). A reasonable agreement between the two samples is reached only for the two hottest stars; in the other cases our temperatures are systematically lower, with differences of 200 K for stars around 5500 K, increasing up to almost 350 K for stars cooler than 5000 K.
In the case of other clusters analyzed by the group of Jeffries (Coma Ber, NGC 2516, NGC 6633), all with slightly sub-solar Fe contents, the differences between our and those quoted in the original papers, derived using the metal-dependent Saxner & Hammarbäck (SH85 (1985)) calibration, are rather small and within the errors: this indicates that the latter calibration is consistent with the S93a one, at least for [Fe/H]0.0. The large discrepancies present in the case of Blanco 1 instead suggest that when over-solar [Fe/H] are considered, the metallicity correction for the vs. relationship might be important.
As a test, we derived effective temperatures for Blanco 1 using also the metal dependent calibration by Alonso et al. (alonso99 (1999)) and assuming [Fe/H]=+0.14. We found that for stars with the derived with the Alonso calibration are cooler than ours by 50 K. On the contrary, for larger colors, the values found using the Alonso calibration are hotter than ours, with differences up to 250 K for the coolest star ( 4500 K). This confirms that the [Fe/H] correction is not negligible for over–solar metallicities and cool stars, and it represents an additional warning for the future users of the database. We stress however that only four clusters in the database have metallicities significantly higher than solar (Blanco 1, NGC 6475, the Hyades and IC 4651) and, as evidenced above, the –() relationship for solar-type stars — the objects of main interest for our discussion in Sect. 4 — is not strongly affected by [Fe/H].
| Star | (Li) | (Li) | ||
|---|---|---|---|---|
| (K) | mÅ | MOOG | COGs (S93b) | |
| NGC 6475 | ||||
| R14 | 5888 | 98 | 2.85 | 2.76 |
| R39A | 5696 | 98 | 2.64 | 2.58 |
| R49A | 5772 | 82 | 2.61 | 2.54 |
| R102 | 5079 | 67 | 1.76 | 1.69 |
| Hyades | ||||
| vB22 | 5477 | 56 | 2.12 | 2.03 |
| vB92 | 5407 | 15 | 1.36 | 1.34 |
| vB162 | 5659 | 59 | 2.34 | 2.25 |
| NGC 752 | ||||
| P475 | 5932 | 59 | 2.59 | 2.50 |
| P520 | 6151 | 67 | 2.86 | 2.76 |
| P983 | 5986 | 45 | 2.48 | 2.40 |
Systematic errors for the Li distributions of open clusters are mainly due to the method of analysis; we derive Li abundances with the COGs of S93b, but slightly discrepant results would be obtained using a different method. In Table 2 we show a comparison between (Li) values obtained with the COGs of S93b (Col. 5) and those obtained using the program MOOG (version 2002 — Sneden sneden (1973); Col. 4) for stars with various s and in clusters of three different ages (NGC 6475, the Hyades and NGC 752). In the computation with MOOG we adopted the same surface gravity () for all the stars, while the microturbulence was calculated as (Nissen nissen (1981), Boesgaard & Friel bf90 (1990)); we recall from Sect. 3.3.1 that Li abundances are not significantly affected by these two stellar parameters.
Li abundances derived with MOOG and with the COGs appear to be in reasonable agreement: whereas values derived with MOOG are systematically higher than the others, all the differences are 0.1 dex, i.e. smaller than (or comparable with) typical errors quoted for the three clusters (see Appendix); note that the discrepancies in the final (Li) values decrease for lower (in stars with similar ).
4 Results and discussion
4.1 New Li abundances
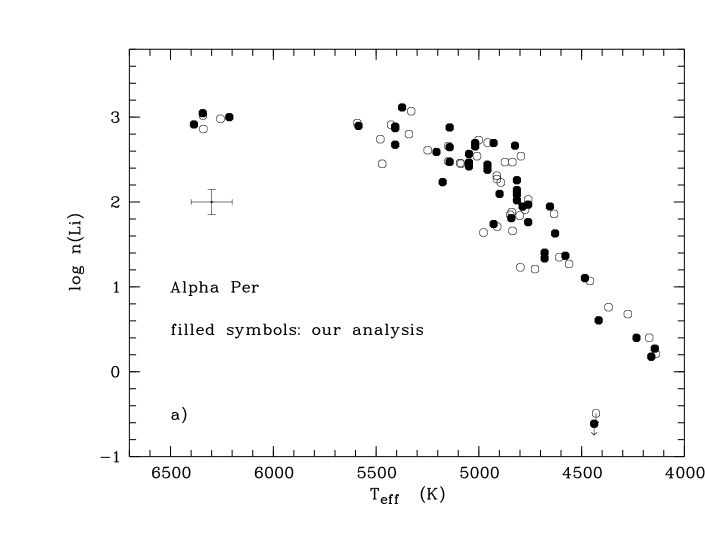
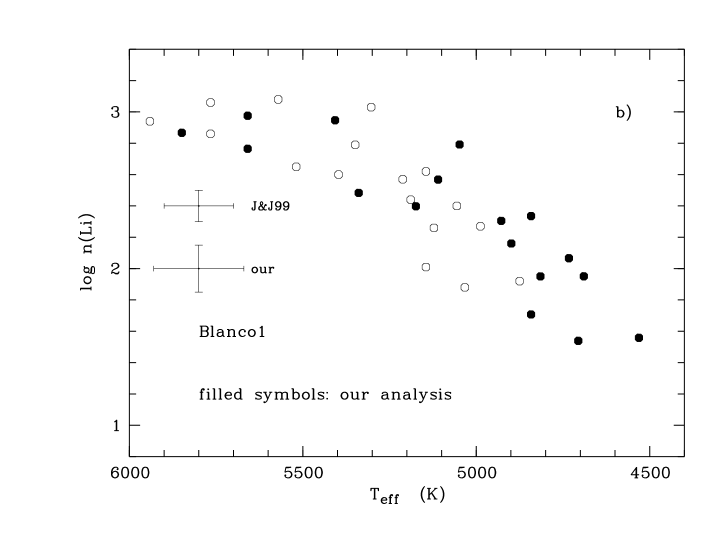
Figure 3 shows the comparison between the “new” Li abundances obtained with our method of analysis and those reported in the original papers for two open clusters: Per (panel a) and Blanco 1 (panel b); filled symbols represent our estimates. Error bars represent indicative average errors in (Li) and ; in the case of Per we found values very similar to those published in the original reference (for this reason we report only one error bar), while for Blanco 1 our errors are slightly more conservative than those quoted by Jeffries & James (blanco1 (1999)).
Data for Per were taken from Randich et al. (R98 (1998)); note that we included in the plot also part of the sample of Balachandran et al. (bala88 (1988); bala96 (1996)) that was re-analyzed by Randich et al. As evident, differences in the Li distributions do exist, depending on the method of analysis. Figure 3a shows that in the case of Per the two sets of Li abundances and are characterized by random differences; however, in most cases the differences in and (Li) are not very large and they lie within the errors.
As shown in Fig. 3b and as already discussed, in the case of Blanco 1 there are significant systematic differences between our and those retrieved from the original paper (see also Fig 2); this example shows how systematic errors due to different methods of analysis can affect the comparison between open clusters. Differences in Li abundances are only due to the discrepancies in since also Jeffries & James (blanco1 (1999)) derived (Li) values using the COGs of S93b. However, the two sets of (Li) appear to be in good agreement, and the net effect is that the two Li distributions are shifted one with respect to the other.
In summary Fig. 3 confirms that distinct methods of analysis result into random and systematic differences in the various sets of and (Li); therefore the sign and the size of the error introduced by comparing clusters analyzed by different authors cannot be estimated a priori. This reinforces the conclusion that comparisons between clusters of different ages and with stars covering a wide range of greatly benefit from the use of a unique method of analysis.
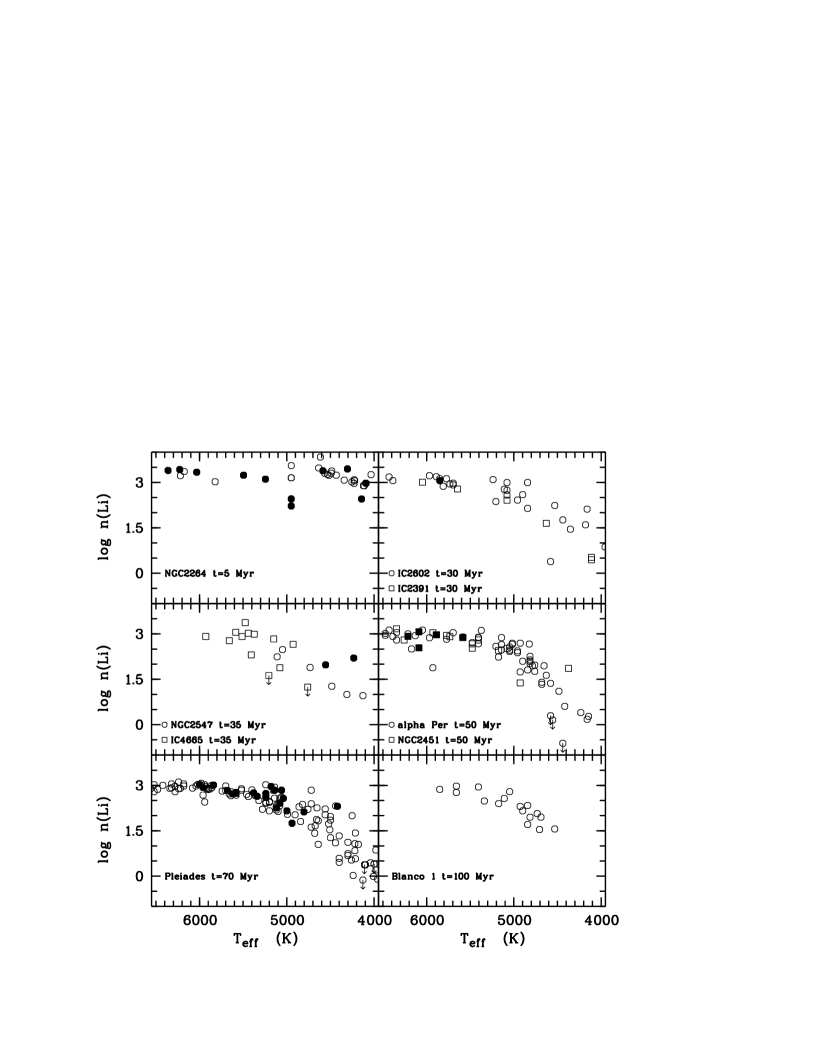
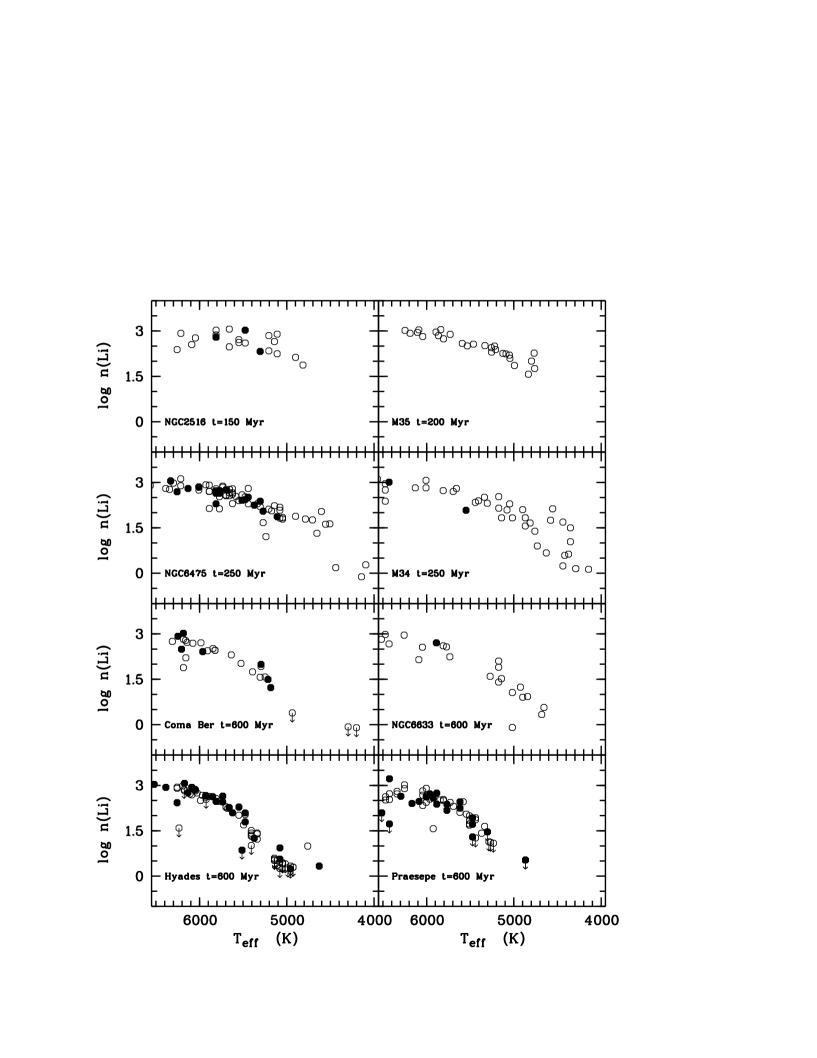
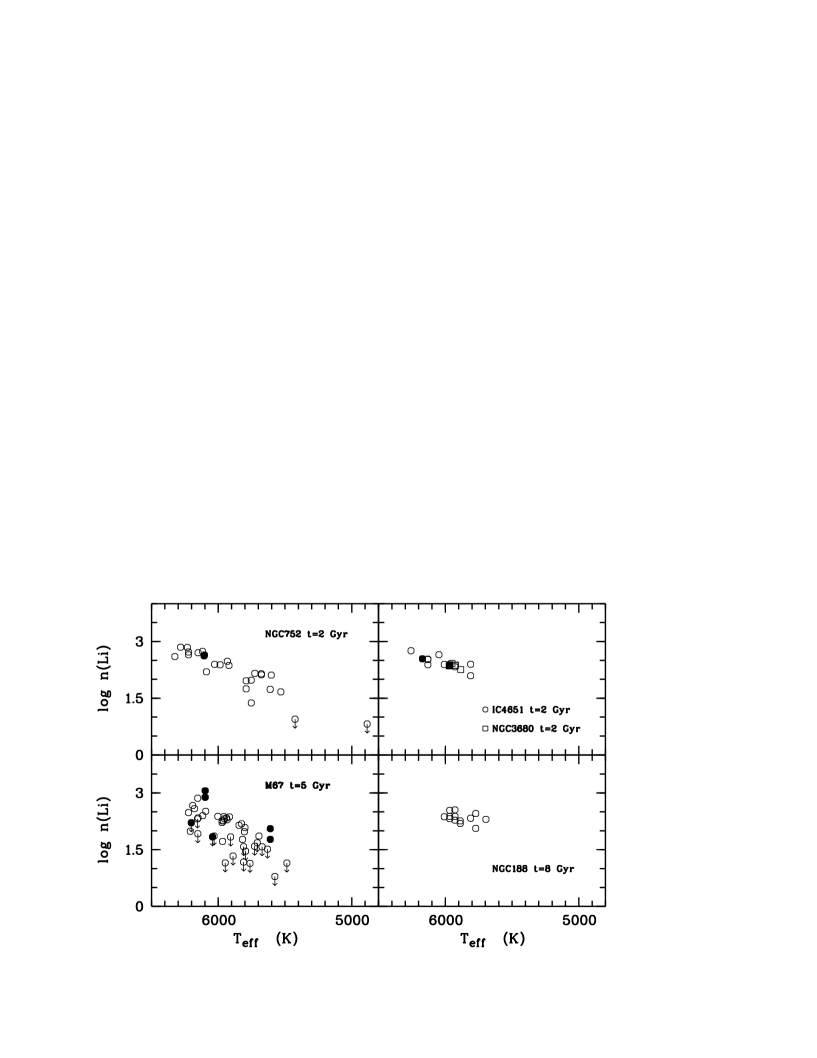
The complete dataset for Li in open clusters obtained with our method of analysis is presented in Figs. 4, 5 and 6: in the first figure the Li distributions of young clusters (ages ranging from few Myr up to 100 Myr) have been plotted, while in the other two we show the distributions for intermediate age (150–600 Myr) and old samples ( 1 Gyr.) Binary stars have been evidenced by filled symbols. We will not describe in detail the Li vs. distributions, whose features have been widely discussed in the original papers; we only note that the the star-to-star scatter is indeed evident both for cool stars in young clusters and among solar-type stars in the M 67, and that binary stars in general do not deviate from the average trends (see Sect. 4.2).
4.2 Time scales of Li depletion
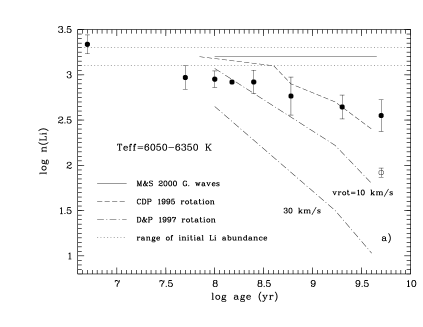
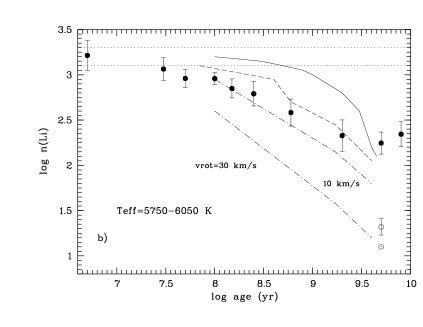
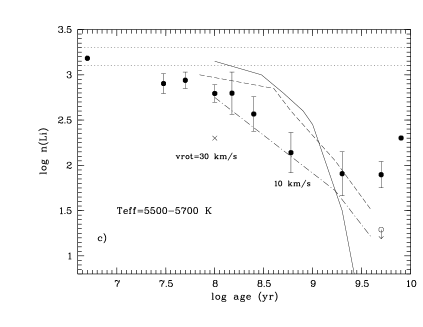
In Fig. 7 we plot the average Li abundance as a function of age for all the stars in the clusters in three temperature ranges: K (late F-type; panel a), K (G-type; b) and K (late G-type; c); we chose a width of K for the first two intervals in agreement with the largest conservative uncertainties in for some clusters (see Appendix); in the case of stars around 5600 K we restricted instead the range since in clusters as old (or older than) the Hyades the Li distributions are rather steep at these temperatures. Note that in some cases the cluster samples contain only few stars in the three ranges considered; thus, in order to base our discussion on statistically more significant samples, the datasets of clusters with similar ages have been merged. Specifically, we merged the samples of IC 2602 with those of IC 2391 and IC 4665 (age 30 Myr); Per with NGC 2451 ( 50 Myr); Blanco 1 with the Pleiades ( 100 Myr); M 34 with M 35 and NGC 6475 ( 250 Myr); the Hyades with NGC 6633, Coma Ber and Praesepe ( 600 Myr); the three clusters at 2 Gyr (NGC 752, NGC 3680 and IC 4651). Part of the merged samples include clusters with different Fe contents: however, as we have discussed in Sect. 1 (and as visible from Figs. 4, 5 and 6), observations of cluster with the same age, but disparate [Fe/H] clearly indicate that overall metallicity does not affect Li depletion. For this reason, we can safely merge the datasets of clusters with similar age but different metallicity. We add again some words of caution about this choice to remind that ages and [Fe/H] values for the sample clusters are the results of independent, and thus not homogeneous, investigations. Error bars in Fig. 7 indicate 1 standard deviations from the average; stars significantly deviating from the mean Li pattern in each merged sample have not been included; in the case of M 67 we computed the mean (Li) separately for the upper envelope and for the lower envelope. The average values for the lower envelope in the 6200 K and 5900 K temperature ranges were computed using ASURV that allows taking into account upper limits. For the coolest temperature interval we can instead only provide an upper limit to the mean, since we do not have enough data points. The average (Li) values for the various clusters (or groups of clusters) are summarized in Table 3.
| Cluster(s) | Age | (Li) | (Li) | (Li) |
|---|---|---|---|---|
| (Gyr) | ||||
| K | K | K | ||
| NGC 2264 | 0.005 | 3.340.10 | 3.210.17 | 3.18 |
| IC 2391/IC 2602/IC 4665 | 0.03 | – | 3.060.13 | 2.900.11 |
| Per/NGC 2451 | 0.05 | 2.970.13 | 2.960.10 | 2.940.09 |
| Pleiades/Blanco 1 | 0.1 | 2.950.09 | 2.960.07 | 2.790.10 |
| NGC 2516 | 0.15 | 2.92 | 2.850.11 | 2.800.23 |
| M 34/M 35/NGC 6475 | 0.25 | 2.920.13 | 2.790.14 | 2.570.19 |
| Hyades/Praesepe/Coma Ber/NGC 6633 | 0.6 | 2.770.21 | 2.580.15 | 2.140.22 |
| NGC 752/NGC 3680/IC 4651 | 2 | 2.650.13 | 2.330.17 | 1.910.24 |
| M 67 – upper envelope | 5 | 2.550.18 | 2.250.12 | 1.900.15 |
| M 67 – lower envelope | 5 | 1.92 | 1.320.09 | 1.29 |
| NGC 188 | 8 | – | 2.340.14 | 2.30 |
With only few exceptions, binaries have been included in the determination of the average abundance, since we find that their presence does not affect the Li distributions, i.e. their Li abundances in general follow the average trend for each cluster (Figs. 4, 5 and 6; see also Sestito et al. sestito03 (2003)); for example, among the few binaries excluded, there is star S1045 in M 67 (with 6100 K) since, as discussed in Pasquini et al. (P97 (1997)), it lies significantly above the mean Li trend. Also star RX76A ( 4200 K) in NGC 2547 has an abnormally high Li abundance, and it is suspected to be a tidally locked binary in which Li depletion was inhibited (Jeffries et al. jef2547 (2003)); anyway this is a very cool object, not included in our discussion of the time scales of Li depletion. We mention in passing that Barrado y Navascués & Stauffer (barradohyades (1996)) investigated a sample of Hyades binaries already observed by T93 finding that, whereas the general pattern is the same for double systems and single stars, binaries show slight over-abundances, that appear more conspicuous in tidally locked systems. Anyway, Barrado y Navascués & Stauffer obtained higher s for binaries with respect to T93; in our analysis we retain the values published by T93 and we find indeed that binary systems in the Hyades perfectly follow the average Li pattern of the cluster.
The two dotted lines in the figure represent the allowed range for the initial Li abundance in Pop. i stars; the other curves represent models including non-standard physical processes (see below). Standard models are not shown in the plots since, as already mentioned, they do not predict any MS Li depletion; on the contrary, we are interested in the evolution of Li during this phase. As for the PMS phases, we recall that the amount of Li destroyed in this stage is a strong function of the assumed input physics in the models; different standard models result into distinct amount of PMS depletion and thus into disparate (Li) values on the ZAMS (e.g., D’Antona & Mazzitelli dm94 (1994); Siess et al. siess (2000)), but, as stressed in Sect. 1, our aim is the investigation of the differential Li depletion during the MS, neglecting the absolute ZAMS abundances of the stars.
Fig. 7a shows that late F-type stars ( K) deplete a certain amount of Li during the PMS phase; note that in this plot data for IC 2602, IC 2391 and IC 4665 are lacking (since no observations are available for stars within this interval), thus a lower limit for Li abundances of ZAMS stars is represented by the mean (Li) of Per + NGC 2451 (age 50 Myr). Then, only a small amount of destruction is suffered by these stars from 50 Myr to 250 Myr; Li depletion slightly increases again beyond this age, as suggested from the points representative of clusters at the age of the Hyades and older (NGC 752 + IC 4651 + NGC 3680 and the upper envelope of M 67); Li destruction then appears to slow down between 2 and 5 Gyr (see below — plateau at old ages). Finally, stars in the lower envelope of M 67 have depleted an amount of Li larger by a factor 4 with respect to their Li-rich counterpart.
Panels b) and c) show that the Li evolution histories for stars in the range 5500–6050 K are qualitatively similar to that of hotter stars: these objects deplete Li by a factor lower than 2 (depending on the assumed initial content) during the PMS; then Li depletion virtually slows down/stops between the age of Per up to 150 Myr in the case of panel c) and up to 250 Myr for panel b), and subsequently it accelerates again up to 2 Gyr. After this age a plateau in average Li abundance is present in the case of the three oldest groups of clusters (i.e. up to the age of NGC 188), meaning that depletion might become ineffective, as discussed by Randich et al. (R03 (2003)); note however that in panel c) only one star of NGC 188 is present, with (Li) much higher than that of other old clusters, thus it cannot be considered as significant in the overall comparison. In these ranges the spread among stars in M 67 is even larger than for stars considered in panel a): the mean (Li) for the upper and lower envelopes of M 67 differ indeed by a factor 8 for stars with K, and by a factor 4 at least, for objects with K. The Li content of the Sun is also shown in Fig. 7b and it is similar to that of the most Li-poor objects in M 67 (and in the solar neighborhood; Pasquini et al. P94 (1994)).
Although stars in the three ranges investigated are characterized by a similar qualitative behavior of Li depletion, it is important to note that the quantitative amount of surface Li destroyed within the various age intervals increases for cooler stars. The “final” abundances beyond 2 Gyr have indeed values of 2.5, 2.3 and 1.9 for stars in panel a), b), c) respectively (and also the average abundance of the lower envelope in M 67 decreases — 1.9, 1.3, and less).
In summary, this discussion suggests that late F and G-type stars within the three ranges ( K, K and K) have qualitatively similar Li depletion histories which can be schemed as follows:
-
•
a small amount of PMS Li destruction;
-
•
plateau during the early stages of the MS;
-
•
MS depletion;
-
•
plateau at old ages.
However, the cooler is the temperature, the higher is the amount of Li destruction suffered during the various phases and the shorter is the epoch of the early-MS plateau.
Two features are worth being stressed: first, Li depletion is not a continuous process that can described with a law. Indeed Li depletion is characterized by different timescales in the various age ranges. Second, the current homogeneous analysis of Li abundances in open clusters covering a wide range of ages allows us to constrain for the first time the age at which extra-mixing processes or other non-standard mechanisms start working in solar-type stars and objects of similar temperatures. Whereas solar-type stars do not undergo further Li depletion during the early stages of the MS (convection is not sufficient, since the convective zones — CZ — are too shallow at these ages), an additional mechanisms driving Li depletion appears around an age of 150–250 Myr.
4.3 Comparison with the models
Several non-standard processes have been proposed in the last years to be included in models: mixing driven by rotation or by internal waves (see below); magnetic fields, which might either enforce rigid rotation in stars or produce differential rotation (e.g., Charbonneau & McGregor ChMc92 (1992); ChMc93 (1993); ChMc96 (1996)); microscopic diffusion, determining the separation of atomic species in the stellar gas (e.g., Richer & Michaud RM93 (1993); Chaboyer et al. 1995a ); mass loss through stellar winds (e.g., Swenson & Faulkner sf92 (1992)), causing Li dilution in stars; tachocline mixing (Piau et al. piau (2003)). The tachocline is a thin layer of separation between the CZ, in which differential rotation occurs, and the internal radiative core, rotating as a rigid body; tachocline mixing is a hydrodynamic process, not related to magnetic effects.
We focus here on those mechanisms for which detailed predictions of Li depletion for solar–type stars as a function of age and are available. Namely: (i) slow mixing induced by rotational instabilities and angular momentum loss (AML; Chaboyer et al. 1995a , 1995b — hereafter CDP95b, dashed line in Fig. 7; Deliyannis & Pinsonneault dp97 (1997) — DP97, dot-dashed line/cross in panel c)) and (ii) mixing driven by internal waves (Montalban & Schatzman MS00 (2000) — MS00, solid line). Note that the latter models include only gravitational waves, neglecting rotational mixing. It is worth mentioning that very recently other models have been developed which take into account the transport of angular momentum through internal gravitational waves together with the effect of rotation (Talon & Charbonnel talon05 (2005)).
In the models by MS00 (see also references therein) chemical mixing is induced by the non-adiabatic propagation in the stellar interiors of internal waves generated at the boundary of the CZ. Panel a) shows that these models do not predict any surface Li destruction in stars hotter than 6000 K during the whole age interval considered, at variance with observations; on the other hand, too high Li abundances are predicted for cooler stars (panel b)) up to an age of 3 Gyr. After this epoch the depletion suddenly increases and the theoretical value for stars with solar age is only slightly lower than that observed for the upper envelope in M 67; however, although models at older ages are not present, it is clear that the plateau for objects older than 2 Gyr is not reproduced and that the theoretical behavior is opposite to the empirical one. The same happens for objects with K (panel c), but in this case the depletion predicted by the models strongly increases around 1 Gyr, due to the deeper convective zones of these stars. In conclusion, MS00 models are not able to reproduce quantitatively and qualitatively the observed time scales of Li depletion, thus mixing induced only by gravity waves can be excluded as the main process responsible for MS Li destruction.
Rotation can drive Li depletion since meridional circulation and/or instabilities triggered by differential rotation in the stellar structure induce a slow mixing over time scales comparable to those of light element burning. The agent responsible for the rising of differential rotation would be an external torque, i.e. AML (spin down): this process acts to generate radial gradients of angular velocity and instabilities leading to AM redistribution and mixing of material. Stars born as fast rotators can either undergo a large amount of AML during the PMS or the early stages of the MS and lose a large amount of their initial Li content, or they can continue to rotate rapidly preserving a high (Li); initial slow rotators cannot suffer a large amount of AML and as a consequence the stellar structure adjusts itself on a circulation-free state.
We report in the three panels of Fig. 7 two different rotational models. The models by DP97 include AML and AM transport dominated by the secular shear instability (Zahn zahn (1992)), while other parameters such as the velocity estimates for meridional circulation and other instabilities were not varied in that study (see also Pinsonneault et al. pinso89 (1989), pinso90 (1990) for a detailed description of the models).
The CDP95b models (see the quoted reference and Chaboyer et al. 1995a ) include both AML and meridional circulation, treated as a diffusive process. In addition these authors take into account also diffusive mechanisms not related to rotation (e.g., gravitational settling). Chaboyer and collaborators computed several models by varying a series of parameters, namely: the mixing length parameter; the He and metal contents ( and ); the efficiency of overshooting; a constant multiplying the diffusion coefficients (); and five rotational parameters including the initial rotational velocity and a critical angular velocity at which AML reaches a saturation level. We chose to represent the “best fit” model by CDP95b, i.e. the one which in their opinion provides the best agreement with observations of open clusters. This model is labeled as VN in the reference paper; the initial rotational velocity is 30 km s-1.
Figure 7 shows that in some cases it is present a reasonable agreement between the predictions of rotational models and the empirical patterns. To be noticed that the models by CDP95b indeed predict a discontinuous Li depletion. More specifically, for stars with K (panel a), the model by CDP95b gives a rather good qualitative agreement with the empirical behavior — at least up to 2 Gyr; whereas the theoretical early MS plateau is too high with respect to the empirical one (no PMS depletion is predicted), as already stressed, we are only interested in the differential amount of MS Li depletion, thus the absolute Li value in the plateau is not important. On the other hand, the slowing down of Li destruction after 2 Gyr is not reproduced adequately. The DP97 isochrones are apparently not able to well fit the shape of the early MS plateau, but actually models are available for three ages only (100 Myr, 1.7 Gyr and 4 Gyr). Thus, data between the early MS and the age of the Hyades are lacking for these models and we cannot draw any conclusion. In any case, the DP97 model with km s-1 is in strident quantitative disagreement with the empirical evidence.
Similar arguments apply to stars in panel b) ( K) and c) ( K). The two panels show that the value of the early MS plateau is only slightly overestimated by the CDP95b models, while a good agreement is present between the Hyades age and 2 Gyr. However, the plateau for old stars is not fitted, i.e. Li abundances decrease towards the solar age. Also the models by DP97 are not able to reproduce the shape of the late MS plateau. A too strong depletion is predicted by the model with km s-1 and K, if compared with open clusters; this track would be able instead to fit the solar abundance; only one (Li) value (at the Pleiades age) is available for the track with km s-1 and K (represented by a cross in panel c)), much lower than the empirical one.
In summary, the approach of models including slow mixing related to rotation (and diffusion) appears reasonable since these models can somehow reproduce the observed Li depletion pattern. The CDP95b tracks are able to reproduce the discontinuous rate of MS Li depletion up to the Hyades age, while no conclusion can be drawn for the DP97 models.
The models by CDP95b are probably best suited for reproducing the early-MS plateau and the subsequent acceleration of Li depletion, due to the competition between rotation and diffusion. The theories by DP97 ignore microscopic diffusion, which instead can have an important role in particle transport: for example (see Chaboyer et al. 1995a ) the diffusion of 4He induces gradients in the mean molecular weight, which inhibit rotational mixing (since extra energy would be needed to move material to zones of different molecular weight). On the opposite, rotational mixing might inhibit the separation processes of diffusion. In this sense, the plateau after the ZAMS could be the result of this competition. Also AML and meridional circulation might be competitive mechanisms; such combined effects are not present in DP97 models. As final comments, we remark that neither the CDP95b models nor those of DP97 can reproduce the plateau at old ages. In addition, these rotational models are not able to reproduce the solar rotational profile measured by helioseismology. In a very recent paper, Talon & Charbonnel (talon05 (2005)) presented models including gravitational waves and rotation, showing that the combined effect of such mechanisms leads to Li abundances for stars at the Hyades age in agreement with observations, and at the same time they are able to shape the solar rotational profile.
5 Conclusions
We presented a new homogeneous analysis of all the Li data available in the literature for F, G and K-type stars in open clusters. The need of a dataset with all the clusters on the same scale of Li abundance and arises from the fact that comparisons between samples analyzed with different methods are affected by random and systematic errors which cannot be estimated a priori. We have indeed shown that differences between the methods of analysis do exist. The database will be made available on the web, in order to allow homogeneous comparisons between the various samples and to test updated models: it includes 21 open clusters observed by various authors spanning the age range 5 Myr – 8 Gyr and with metallicities 0.2[Fe/H]+0.2.
Based on the new Li abundances obtained by us for open clusters, we have determined average Li abundances for stars in different temperature bins and age ranges in order to investigate the time scales of Li depletion from ZAMS to late MS. For the first time we were able to put a limit in age to the appearance of non-standard mixing mechanisms at work on the MS: stars do not appear to destroy Li in the early stages of MS, but Li depletion starts again around an age of 150–250 Myr. Then the destruction is ineffective beyond 1–2 Gyr in late F and G stars, except for a fraction of stars in M 67. Overall we showed that MS Li depletion is not a continuous process. We also confirmed the existence of a plateau at old ages. A caveat to our results is represented by the fact that ages and metallicities for the clusters have not been derived with a homogeneous method. Whereas our quantitative estimates of time scales may be somewhat affected by this fact, we believe that our qualitative results, and in particular, the existence of a Li plateau at old ages do not change.
As to the possible extra-mixing mechanisms operating during the MS, we compared the empirical scenario with the predictions of models including slow mixing related to gravity waves (Montalban & Schatzmann MS00 (2000)) and to rotation and angular momentum loss (Chaboyer et al. 1995b ; Deliyannis & Pinsonneault dp97 (1997)).
We found that gravity waves (at least when not coupled with rotation — models by MS00) can be excluded as the main agent responsible for MS Li depletion, while slow mixing induced by rotation might explain to some extent the empirical behavior. In particular, the models by CDP95b including AML, meridional circulation and diffusion are those which appears at the moment to be the most appropriate. Nevertheless, several uncertainties are still present and none of the models proposed is able to reproduce the Li plateau observed for solar-type stars in clusters older than the Hyades. Understanding this empirical behavior is instead very important for its connection with Primordial Nucleosynthesis and Galactic evolution. We conclude that improvements in theoretical work are certainly needed for a proper comprehension of the properties of mixing and Li evolution in stars.
Acknowledgements.
We are grateful to D. Barrado y Navascués, A. Ford, R.D. Jeffries and D.R. Soderblom for sending us tables with their Li data. We are indebted to S.N. Shore for helpful discussion on this work. Finally, we thank the referee C. Charbonnel for constructive comments on the manuscript.Appendix
We report here a more detailed description of the computation of random errors in Li abundances (due to uncertainties in and ) for the open clusters included in the database and presented in Table 1 (see also Sect. 3.3.1).
The clusters with published errors in s are the following:
-
IC 2602: Randich et al. (R01 (2001)) published the for each star, but their temperatures were derived in most cases from both (with the S93a calibration) and colors, thus in principle we cannot use directly these values. Since no error is quoted in the photometry used (Prosser et al. prosser (1996)), we adopted a conservative K, as Randich et al. (R01 (2001)) did for stars with derived from only one color index.
-
IC 2391: the same as for IC 2602 (Randich et al. R01 (2001)).
-
Per: for the sample of Randich et al. (R98 (1998)) we used the quoted in the paper ( 100, 150 and 200 K), since no error information is present in the source of photometry (Prosser & Randich PR98 (1998); Prosser et al. prosser98 (1998)); Randich et al. derived by averaging two different calibrations (Bessel bessel (1979); Alonso et al. alonso (1996)) which provide temperature errors very similar to those obtained with the S93a calibration. For Balachandran et al. (bala88 (1988); bala96 (1996)) see below.
-
NGC 2451: we used the of 200 K quoted by Hünsch et al. (hun04 (2004)), which derived the temperatures from colors with the S93a calibration.
-
Pleiades: (i) García López et al. (GL94 (1994)): the same as for Per of Randich et al. R98 (1998) (but García López et al. use three different calibrations); (ii) Jeffries (1999b ) does not compute neither Li abundances, nor the temperatures (he only measures the s); we adopted K, which is a conservative value for Pleiades stars.
-
Blanco 1: we derived from errors in the photometry ().
-
NGC 2516: we derived K from errors in the photometry.
-
M 35: we derived K from errors in the photometry.
-
Hyades: we were able to compute the errors for the two stars of Soderblom et al. (1990) for which we assumed K ().
-
Coma Ber: in the three source papers the authors quoted the uncertainties in the photometry; we used these values to compute the errors in (ranging from 25 to 150 K).
-
NGC 6633: conservative derived from errors in the photometry are of 100 K.
-
IC 4651: K from the photometry, with the exception of two stars which have K.
-
NGC 188: Randich et al. (R03 (2003)) assumed conservative uncertainties in of 100 K deriving from the photometry.
These are instead the clusters for which we roughly estimated an average uncertainty in Li abundances, since errors in are not quoted:
-
NGC 2264: (i) Soderblom et al. (sod2264 (1999)) quote only a mean error in Li abundance, dex; we retained this value, since we used the same method of analysis. (ii) King (king (1998)) give uncertainties of about 20–30 mÅ in and of 140 K in for his sample. From these values he obtained , in agreement with us. Note that King used a different calibration (Bessel bessel (1979)) however perfectly consistent with that of S93a.
-
Per: Balachandran et al. (bala88 (1988); bala96 (1996)) quote deriving from uncertainties in s and from uncertainties in of K. We cannot use this latter value, since, besides the different calibration, we adopted a different photometric source (Prosser & Randich PR98 (1998); Prosser et al. prosser98 (1998)), where errors in are not given; as to the error deriving from , we can trust the value quoted by Balachandran et al. since they derived Li abundances with MOOG, which appears to be consistent with the COGs of S93b (see Sect. 3.3.1). Thus, we can compute indicative errors by assuming K (quoted for most stars by Randich et al. R98 (1998)) and deriving from uncertainties: we obtain errors in (Li) ranging from 0.13 for the warmest stars up to 0.17 for the latest spectral-type objects.
-
Pleiades: (i) S93b give =15 mÅ, without estimating the uncertainty in . Considering K, which we think to be conservative for this well studied cluster, we find average (the error increases for the coolest stars). (ii) Jones et al. (jones96 (1996)): =5 mÅ for slow rotators and =20 mÅ for fast rotators. Assuming K we obtain a conservative of 0.15 dex, both for fast rotators (which are mainly Li rich stars) and for slow rotators. (iii) Butler et al. (butler (1987)): they quoted an uncertainty of 15 % in ; as for the , we used the errors quoted by García López et al. (GL94 (1994)), who reanalyzed the Butler sample; errors in (Li) range from 0.15 to 0.40 dex.
-
M 34 (Jones et al. jones97 (1997)): K (using the calibration of S93a) and relative uncertainties of about 10%. It follows .
-
Hyades: (i) T93: =2 mÅ, K, from uncertainties in of 0.01 (conservative; see the detailed analysis in the original paper); we find for cool Li poor stars and for hotter stars.
-
Praesepe (Soderblom et al. 1993c ): =5 mÅ, no uncertainty quoted. Assuming K, errors in (Li) range from 0.1 dex for late F and G-type stars up to 0.17 dex for later spectral types.
-
NGC 3680: for stars of Pasquini et al. (P01 (2001)), we started from K quoted by them and we assumed a conservative uncertainty of 15% in . Errors in (Li) turned out to be 0.10–0.15 dex. Note that they used the calibration of Alonso et al. (alonso (1996)), which results into errors similar to deriving from S93a.
References
- (1) Alonso, A., Arribas, S., & Martínez-Roger, C. 1996, A&A, 313, 873
- (2) Alonso, A., Arribas, S., & Martínez-Roger, C. 1999, A&A, 140, 261
- (3) Anthony-Twarog, B.J., Mukherjee, K., Twarog, B.A., & Caldwell, N. 1988, AJ, 95, 1453
- (4) Arribas, S., & Martìnez Roger, C. 1988, A&A, 206, 63
- (5) Arribas, S., & Rogers, C.M. 1989, A&A, 215, 305
- (6) Balachandran, S. 1995, ApJ, 446, 203
- (7) Balachandran, S., Lambert, D.L., & Stauffer, J.R. 1988, ApJ, 333, 267
- (8) Balachandran, S., Lambert, D.L., & Stauffer, J.R. 1996, ApJ, 470, 1243
- (9) Barrado y Navascués, & Stauffer, J.R. 1996, A&A, 310, 879
- (10) Barrado y Navascués, D., Deliyannis, C.P., & Stauffer, J.R. 2001, ApJ, 549, 452
- (11) Barrado y Navascués, D., Stauffer, J.R., & Jayawardhana, R. 2004, ApJ, 614, 386
- (12) Becker, J., & Fenkart, Q. 1970, Astr. Ap. Suppl., 4, 240
- (13) Bessel, M.S. 1979, PASP, 91, 589
- (14) Boesgaard, A.M., & Friel, E.D. 1990, ApJ, 351, 467
- (15) Böhm-Vitense, E. 1981, Ann. Rev. Astr. Ap., 19, 295
- (16) Butler, R.P., Marcy, G.W., Cohen, R.D., & Duncan, D.K. 1987, ApJ, 319, 19
- (17) Carlsson, M., Rutten, R.J., Bruls, J.H.M., & Schukina, N.G. 1994, A&A, 288, 860
- (18) Chaboyer, B., Demarque, P., & Pinsonneault, M.H. 1995a ApJ, 441, 865
- (19) Chaboyer, B., Demarque, P., & Pinsonneault, M.H. 1995b
- (20) Charbonneau, P., & MacGregor, K.B. 1992, ApJL, 397, L63
- (21) Charbonneau, P., & MacGregor, K.B. 1993, ApJ, 417, 762
- (22) Charbonneau, P., & MacGregor, K.B. 1996, ApJ, 473, 49
- (23) Claria, J.J. 1982, A&AS, 47, 323
- (24) Dachs, J., & Kabus, H. 1989, A&AS, 78, 25
- (25) Daniel, S.A., Latham, D.W., Mathieu, R.D., & Twarog, B.A. 1994, PASP, 106, 281
- (26) D’ Antona, F., & Mazzitelli, I. 1994, ApJS, 90, 467
- (27) Deliyannis, C.P & Pinsonneault, M. 1997, ApJ, 488, 836
- (28) de Epstein, A.E.A., & Epstein, I. 1985, AJ, 90, 1211
- (29) Feinstein, A. 1966, PASP, 78, 301
- (30) Ford, A., Jeffries, R.D, James, D.J, & Barnes, J.R. 2001, A&A, 369, 871
- (31) Friel, E.D. 1994, ARA&A, 33, 381
- (32) Friel, E.D., & Boesgaard, A.M. 1992, ApJ, 387, 170
- (33) García López, R.J., Rebolo, R., & Beckmann, J.E. 1988, PASP, 100, 1489
- (34) García López, R.J., Rebolo, R., & Martín, E. 1994, A&A, 282, 518
- (35) García López, R.J., Randich, S., Zapatero Osorio, M.R., & Pallavicini, R. 2000, A&A, 363, 958
- (36) Gray, D.F. 1976, “Observations and analysis of stellar photospheres”, Cambridge University Press
- (37) Hobbs, L.M., & Pilachowski, C. 1986a, ApJ, 309, L17
- (38) Hobbs, L.M., & Pilachowski, C. 1986b, ApJ, 311, L37
- (39) Hobbs, L.M., & Pilachowski, C. 1988, ApJ, 334, 734
- (40) Hobbs, L.M., & Thorburn, J.A. 1991, AJ, 102, 1070
- (41) Hünsch, M., Weidner, C., & Schmitt, J.H.M.M. 2003, A&A, 402, 571
- (42) Hünsch, M., Randich, S., Hempel, M., Weidner, C., & Schmitt, J.H.M.M. 2004, A&A, 418, 539
- (43) Ianna, P.A., & Schlemmer, D.M. 1993, AJ, 105, 209
- (44) James, D.J, & Jeffries, R.D. 1997, MNRAS, 291, 252
- (45) James, D.J., Collier Cameron, A., Barnes, J.R., & Jeffries, R.D. 2000 in “Stellar Clusters and Associations: Convection, Rotation, and Dynamos”, ed. R. Pallavicini, G. Micela, & S. Sciortino, ASP Conf. Ser. 198, p. 277
- (46) Jeffries, R.D. 1999a, MNRAS, 304, 821
- (47) Jeffries, R.D. 1999b, MNRAS, 309, 189
- (48) Jeffries, R.D. 2005, in “Chemical Abundances and Mixing in Stars in the Milky Way and its Satellites”, eds. L. Pasquini, & S. Randich, ESO Astrophysic Symposia, in press (astro-ph/0411111)
- (49) Jeffries, R.D., & James, D.J. 1999, ApJ, 511, 218
- (50) Jeffries, R.D., & Oliveira, J.M. 2005, MNRAS, 358, 13
- (51) Jeffries, R.D., James, D.J., & Thurston, M.R. 1998, MNRAS, 300, 550
- (52) Jeffries, R.D., Totten, E.J., Harmer, S., & Deliyannis, C.P. 2002, MNRAS, 336, 1109
- (53) Jeffries, R.D., Oliveira, J.M., Barrado y Navascués, D., & Stauffer, J.R. 2003, MNRAS, 343, 1271
- (54) Jones, B.F., & Prosser, C.F. 1996, AJ, 111, 1193
- (55) Jones, B.F., Shetrone, M., Fischer, D., & Soderblom, D.R. 1996, AJ, 112, 186
- (56) Jones, B.F., Fischer, D., Shetrone, M., & Soderblom, D.R. 1997, AJ, 114, 352
- (57) Jones, B.F., Fischer, D., & Soderblom, D.R. 1999, AJ, 117, 330
- (58) King, J.R. 1993, AJ, 105, 1087
- (59) King, J.R. 1998, AJ, 116, 254
- (60) Lyngå, G. 1985, IAUS, 106, 143
- (61) Martín, E.L., & Claret, A. 1996, A&A, 306, 408
- (62) Martín, E., & Montes, D. 1997, A&A, 318, 805
- (63) Mermilliod, J.-C. 1981, A&A, 97, 235
- (64) Meynet, G., Mermilliod, J.-C., & Maeder, A. 1993, A&AS, 98, 477
- (65) Mitchell, R.I. 1960, ApJ, 132, 68
- (66) Montalbán, J., & Schatzmann, E. 2000, A&A, 354, 943
- (67) Naylor, T., Totten, E.J., Jeffries, R.D., et al. 2002, MNRAS, 335, 291
- (68) Nissen, P. 1981, A&A, 97,145
- (69) Nordström, B., Andersen, J, & Andersen, M.I. 1997, A&A, 322, 460
- (70) Odenkirchen, M., Soubiran, C., & Colin, J. 1998, NewA, 3, 583
- (71) Pallavicini, R., Spanò, P., Prisinzano, L., Randich, S., and Sestito, P., 2005 in “Chemical Abundances and Mixing in Stars in the Milky Way and its Satellites”, eds. L. Pasquini, & S. Randich, ESO Astrophysic Symposia, in press
- (72) Panagi, P.M., & O’Dell, M.A. 1997, A&AS, 121, 213
- (73) Pasquini, L., Liu, Q., & Pallavicini, R. 1994, A&A, 287, 191
- (74) Pasquini, L., Randich, S., & Pallavicini, R. 1997, A&A, 325, 535
- (75) Pasquini, L., Randich, S., & Pallavicini, R. 2001, A&A, 374, 1017
- (76) Pasquini, L., Randich, S., Zoccali, M., et al. 2004, A&A, 424, 951
- (77) Patenaude, M. 1978, A&A, 66, 225
- (78) Patten, B.M., & Simon, T. 1996, ApJS, 106, 489
- (79) Perryman, M.A.C., Brown, A.G.A., Lebreton, Y., et al. 1998, A&A, 331, 81
- (80) Piau, L., Randich, S., & Palla, F. 2003, A&A, 408, 1037
- (81) Pinsonneault, M., Kawaler, S.D., Sofia, S., & Demarque, P. 1989, ApJ, 338, 424
- (82) Pinsonneault, M., Kawaler, S.D., & Demarque, P. 1989, ApJS, 74, 501
- (83) Prosser, C.F. 1993, AJ, 105, 1441
- (84) Prosser, C.F., & Randich, S. 1998, AN, 319, 201
- (85) Prosser, C.F., Randich, S., & Stauffer, J.R. 1996, AJ, 112, 649
- (86) Prosser, C.F., Randich, S., & Simon, T. 1998, AN, 319, 215
- (87) Randich, S. 2005, in “Chemical Abundances and Mixing in Stars in the Milky Way and its Satellites”, eds. L. Pasquini, & S. Randich, ESO Astrophysic Symposia, in press
- (88) Randich, S., Aharpour, N., Pallavicini, R., Prosser, C.F., & Stauffer, J.R. 1997, A&A, 323, 86
- (89) Randich, S., Martín, E., García López, R.J., & Pallavicini, R. 1998, A&A, 333, 591
- (90) Randich, S., Pasquini, L., & Pallavicini, R. 2000, A&A, 356, L25
- (91) Randich, S., Pallavicini, R., Meola, G., Stauffer, J.R., & Balachandran, S.C. 2001, A&A, 372, 862
- (92) Randich, S., Primas, F., Pasquini, L., & Pallavicini, R. 2002, A&A, 387, 222
- (93) Randich, S., Sestito, P., & Pallavicini, R. 2003, A&A, 399, 133
- (94) Randich, S., Primas, F., Sestito, P., Pasquini, L., & Pallavicini, R. 2005, in preparation
- (95) Richer, J., & Michaud, G. 1993, ApJ, 416, 312
- (96) Robichon, N., Arenou, F., Mermilliod, J.-C., & Turon, C. 1999, A&A, 345, 471
- (97) Sarajedini, A., von Hippel, T., Kozhurina-Platais, V., Demarque, P., 1999, AJ, 118, 2894
- (98) Saxner, M., & Hammarbäck, G. 1985, A&A, 151, 372
- (99) Schuler, S., King, J.R., Fischer, D., Soderblom, D.R., & Jones, B.F. 2003, AJ, 125, 2085
- (100) Sestito, P., Randich, S., Mermilliod, J.-C., & Pallavicini, R. 2003, A&A, 407, 289
- (101) Sestito, P., Randich, S., & Pallavicini, R. 2004, A&A, 426, 809
- (102) Siess, L., Dufour, M., & Forestini, M. 2000, A&A, 358, 593
- (103) Sneden, C.A. 1973, ApJ, 184, 839
- (104) Snowden, M.S. 1976, PASP, 88, 174
- (105) Soderblom, D.R. 1989, ApJ, 342, 823
- (106) Soderblom, D.R., Oey, M.S., Johnson, D.R.H., & Stone, R.P.S. 1990, AJ, 99, 595
- (107) Soderblom, D.R., Stauffer J.R., Hudon, J.D., & Jones, B.F. 1993a, ApJS, 85, 315 (S93a)
- (108) Soderblom, D.R., Jones, B.F., Balachandran, S., et al. 1993b, AJ, 106, 1059 (S93b)
- (109) Soderblom, D.R., Fedele, S.B., Jones, B.F., Stauffer, J.R., & Prosser, C.F. 1993c, AJ, 106, 1080
- (110) Soderblom, D.R., Jones, B.F., Stauffer, J.R., & Chaboyer, B. 1995, AJ, 110, 729
- (111) Soderblom, D.R., King, J.R., Siess, L., Jones, B.F., & Fischer, D. 1999, AJ, 118, 1301
- (112) Spiegel, E.A., & Zahn, J.-P. 1992, A&A, 265, 106
- (113) Spite, F., Spite, M., Peterson, R.C., & Chaffee, F.H. 1987, A&A, 171, L8
- (114) Stauffer, J.R. 1984, ApJ, 280, 189
- (115) Stauffer, J.R., & Hartmann, L.W. 1987, ApJ, 318, 337
- (116) Stauffer, J., Hartmann, L.W., Jones, B.F., & McNamara, B.R. 1989, ApJ, 342, 285
- (117) Stauffer, J.R., Hartmann, L.W., Prosser, C.F., et al. 1997, ApJ, 479, 776
- (118) Stauffer, J.R., Schultz, G., & Kirkpatrick, J.D. 1998, ApJ, 499, L199
- (119) Stauffer, J.R., Barrado y Navascués, D., Bouvier, J., et al. 1999, ApJ, 527, 219
- (120) Steinhauer, A., & Deliyannis, C.P. 2004, ApJ, 614, 65
- (121) Strobel, A. 1991, AN, 312, 177
- (122) Sung, H. & Bessel, M.S. 1999, MNRAS, 306, 361
- (123) Sung, H. Bessel, M.S., & Lee, S.W. 1997, AJ, 114, 2644
- (124) Swenson, F.J., & Faulkner, J. 1992, ApJ, 395, 654
- (125) Talon, S., & Charbonnel, C. 2005, A&A in press (astro-ph/0505229)
- (126) Tautvaisiene, G., Edvardsson, B., Tuominen, I., & Ilyin, I. 2000, A&A, 360, 499
- (127) Thorburn, J.A., Hobbs, L.M., Deliyannis, C.P., & Pinsonneault, M.H. 1993, ApJ, 415, 150 (T93)
- (128) Whiteoak, J.B. 1961, MNRAS, 123, 245
- (129) Zahn, J.-P. 1992, A&A, 265, 115