The XMM-Newton/2dF survey-VIII: The extended X-ray sources
Abstract
We present a sample of eight extended X-ray sources detected in the wide-field (), bright (2-10 ksec) XMM-Newton/2dF survey, reaching a flux limit of erg s-1 cm-2. Of these, seven are identified as secure X-ray clusters in the soft 0.3-2 keV band using a standard wavelet algorithm on either the PN or the MOS images. Spectroscopic or photometric redshifts are available for five clusters, spanning a range between 0.12 and 0.68. The X-ray spectral fittings show temperatures between 1 and 4.6 keV, characteristic of poor clusters and groups of galaxies. We derive for the first time the XMM-Newton cluster number count distribution albeit with poor statistics. Both the and the Luminosity-Temperature relation are in good agreement with previous ROSAT results.
keywords:
Surveys: galaxies: clusters; Cosmology: large–scale structure of Universe; Surveys1 Introduction
Surveys of cluster of galaxies have been constructed using a variety of identification algorithms, applied mostly on optical wide-field observations (eg. Abell, Corwin & Olowin 1989; Lumsden et al. 1992; Dalton et al. 1994; Postman et al. 1996; Olsen et al. 1999; Gladders & Yee 2000; Goto et al. 2002; Bahcall et al. 2003). Although the recent cluster identification algorithms are increasingly more sophisticated, the optical surveys are known to suffer from projection effects and related biases.
Alternatively, X-ray selected cluster samples have a number of advantages with respect to surveys based in the optical. The detection of the diffuse Intra-Cluster Medium (ICM), which emits strongly at X-ray wavelengths, can be securely associated with clusters of galaxies, since the X-ray emission traces the central part of the cluster and is proportional to the square of the hot gas density. This fact results in a high contrast with respect to the X-ray background.
A number of recent works have attempted to understand cluster selection procedures applied on different wavelength data and quantify their differences (eg. Donahue et al 2002; Basilakos et al 2004 and references therein). In a recent paper we have investigated the X-ray properties of a subset of the Cut and Enhance (CE) SDSS clusters of Goto et al. (2002) using seven public XMM-Newton pointings (Plionis et al. 2005). We have found that only 8 out of the 17 CE clusters, in the areas investigated, appear in X-rays with ergs cm-2 s-1.
The great advantage of X-ray selected clusters is that they are less susceptible to projection effects while due to their strong ICM emission they can also be observed to very large distances. They have a well defined flux-limit from which it is relatively straight forward to derive their redshift selection function which is instrumental in measuring their clustering properties and the evolution of their physical and dynamical state. These studies can then provide us with a wealth of cosmological information (eg. Borgani & Guzzo 2000; Rosati, Borgani & Norman 2002) which in conjunction with the WMAP results should provide a consistent cosmological framework.
The Einstein as well as the ROSAT satellites, supplemented by follow-up studies with Asca and Beppo-Sax allowed a leap forward in the cluster X-ray astronomy, producing large samples of both nearby and distant clusters (eg. Stocke et al. 1991; Castander et al. 1995; Ebeling et al. 1996a, 1996b; Scharf et al. 1997; de Grandi et al. 1999; Ebeling et al. 2000; Böhringer et al. 2001; Gioia et al. 2001; Rosati, Borgani & Norman 2002; Moretti et al. 2004). The last few years the XMM-Newton and the Chandra observatories, with much larger effective area and better spatial resolution than the previous missions are playing a key role in the detection of relatively distant clusters. For example, the medium-deep Large Scale Survey is aimed in studying the evolution of the cluster-cluster correlation function and the cluster number density out to (Pierre et al. 2004; Valtchanov et al. 2004). A serendipitous survey, conducted by Kolokotronis et al. (2005) using public XMM-Newton data and wide-field optical multiband follow-ups, aims to investigate not only the global properties of the X-ray cluster distribution but also the optical and X-ray properties of individual clusters at different redshifts (see also Land et al. 2005 for an XMM-Newton-SDSS cluster survey). Note that with integrations of a few tens of ksec, the XMM-Newton can reach to a sensitivity of erg cm-2 s-1 and detect rich clusters ( erg ) as extended sources out to (eg. Pierre et al. 2004).
In this work we use the XMM-Newton/2dF survey (see Georgakakis et al. 2004) which covers an area of and reaches a flux limit of erg cm-2 s-1. This flux depth is comparable to the RDCS ROSAT survey of Rosati et al. (1998). The main aim of this work is to find candidate clusters from their extended emission, producing an X-ray selected cluster catalogue. In Section 2 we present our XMM-Newton/2dF survey, we describe the reduction of the X-ray data and the cluster identification method. In section 3 we present the cluster flux and temperature estimation method, the details of the candidate clusters, the corresponding and luminosity-temperature relations. Finally in section 4 we summarise our conclusions. Throughout this paper we adopt km s-1 Mpc-1, and and note that all X-ray luminosities and fluxes are reported in the 0.3-2 keV energy band.
2 The XMM-Newton/2dF Survey
Two regions near the North and South Galactic Pole regions (F864; RA(J2000)=; Dec.(J2000)= and SGP; RA(J2000)=, Dec.(J2000)=, respectively) were surveyed by the XMM-Newton between May 2002 and February 2003 as part of the guaranteed time program. Details of the observations, data reduction procedures and overall project aims can be found in Georgakakis et al. (2004). Briefly, we note that the observations consist of a total of 18 pointings equally split between the SGP and the F864 regions each with an exposure time between ks. Our survey overlaps with the 2dF Galaxy Redshift Survey (2dFGRS111http://msowww.anu.edu.au/2dFGRS/; Colless et al. 2001) and hence, high quality spectra, redshifts and spectral classifications are available for all mag galaxies in our regions. Note that the F864 region overlaps with the Sloan Digital Sky Survey (York et al. 2000), which provides optical photometry in 5 bands (; Fukugita et al. 1996; Stoughton et al. 2002) down to a limiting magnitude mag.
2.1 Data reduction
The XMM-Newton observations have been analysed using the Science Analysis Software (SAS 5.3.3). Event files for the PN and the two MOS detectors have been produced using the epchain and the emchain tasks of SAS respectively. These were then screened for high particle background periods by rejecting times with 0.2-10 keV count rates higher than 25 and 15 cts/s for the PN and the two MOS cameras respectively. A total of 5 fields suffering from significantly elevated and flaring particle background were excluded from the analysis. As a result our final XMM-Newton/2dF survey comprises a total of 13 fields in the SGP and F864 regions covering an effective area of . Note that only events corresponding to patterns 0–4 for the PN and 0–12 for the two MOS cameras have been used. The exposure maps have been created using the SAS task eexpmap. To increase the signal–to–noise ratio and to reach fainter fluxes, the two MOS event files have been combined into a single event list using the merge task of SAS. We choose to analyse the images in the soft spectral band (0.3-2 keV). This is because the groups and poor clusters have low temperature and hence their X-ray emission peaks at soft energies ( keV). Therefore poor clusters could remain undetected in the total band images where the background is much higher.
2.2 Source detection
The source detection is performed on the MOS 1 and 2 merged image and the PN image separately, by combining a wavelet detection algorithm and a maximum likelihood fitting of the detected sources. We use the SAS ewavelet task222http://xmm.vilspa.esa.es/sas/current/doc/ewavelet/ with a detection threshold of which detects both point and extended sources by convolving images with the Mexican hat filter (eg. Damiani et al. 1997a, b). The scale of the Mexican hat filter used is 2, 4, 6, 8, up to 32 pixels. The ewavelet task uses the exposure maps to take into account sharp gradients in the exposure (chip edges) and hence to avoid the detection of spurious sources. The output list is then fed into the SAS emldetect task which performs a maximum likelihood PSF fit on each source yielding a likelihood for its extension. The likelihood threshold corresponds to a probability smaller than 0.001 of detecting spurious extended sources. The detected sources in each field were then visually inspected and detections clearly associated with CCD gaps, field of view edges or multiple point sources were removed.
3 The Extended Source Sample
The extended X-ray source sample, compiled from the threshold 0.3-2 keV source catalogue, contains 8 objects with detected flux greater than . In particular, we have (a) 3 SGP candidates in the merged MOS mosaic and 3 in the PN (out of which all 3 overlap with the MOS detections) and (b) 4 F864 candidates in the merged MOS mosaic and 4 in the PN (out of which 3 overlap with the MOS detections). In Table 1 we present the names, coordinates of the candidate X-ray clusters as well as the detector on which the extended emission was identified. Visual inspection suggests that the 60% overlap between the PN and the MOS detected cluster candidates can be mostly attributed to the presence of gaps in the PN images and the elevated particle background of this detector. For example, candidate 3, detected only on MOS, is located near one of the CCD gaps of the PN detector, which seems to be the reason for which it was not detected in the PN image.
| Name | Detector | Other Names | ||||
| (J2000) | (J2000) | |||||
| 1 | XMM2DF J134139.2+001739 | 13 41 39.2 | +00 17 39 | MOS+PN | CE J205.412231+00.3032711 | |
| 2 | XMM2DF J134304.8-000056 | 13 43 04.8 | –00 00 56 | MOS+PN | J1836.23 TR2 | |
| 3 | XMM2DF J134511.9-000953 | 13 45 11.9 | –00 09 53 | MOS | CE J206.296951-00.1460281 | |
| 4 | XMM2DF J134413.8-002952 | 13 44 13.8 | –00 29 52 | MOS+PN | ||
| 5 | XMM2DF J134446.4-003019 | 13 44 46.4 | –00 30 19 | PN | ||
| 6 | XMM2DF J005656.8-274029 | 00 56 56.8 | –27 40 29 | MOS+PN | J1888.16 CL2 | |
| 7 | XMM2DF J005847.8-280027 | 00 58 47.8 | –28 00 27 | MOS+PN | ||
| 8 | XMM2DF J005623.2-281818 | 00 56 23.2 | –28 18 18 | MOS+PN | ||
| 1: Goto et al. (2002) SDSS; 2: Couch et al. (1991) | ||||||
Furthermore, note that had we accepted candidates with a lower extension probability, the overlap between the detections in the merged MOS and PN images would be significantly lower. This fact has guided us to impose such a high probability limit for accepting candidates. The high limit although it secures that the resulting candidates are most probably real X-ray clusters or groups, may also lead to the omission X-ray faint or distant clusters. Such is the case of cluster 9 of Table 1 in Basilakos et al. (2004), which is also identified in the SDSS optical data but has a lower extension probability (99%) than the limit imposed in the present work.
Out of these 8 cluster candidates, one (4 of Table 1) has been observed by Chandra and we have found that it consists of three point sources blended, in the XMM-Newton image, in one common extended envelope. This shows a possible problem from which our extended detections may suffer. Therefore, source 4 was excluded from our final sample of X-ray cluster candidates.
We have performed a cross-correlation with all known cluster catalogues using a search radius of 1.5 arcmin (corresponding to Mpc at ) and we have found that four out of our seven final cluster candidates have been detected previously (either by Couch et al. 1991 or by Goto et al. 2002).
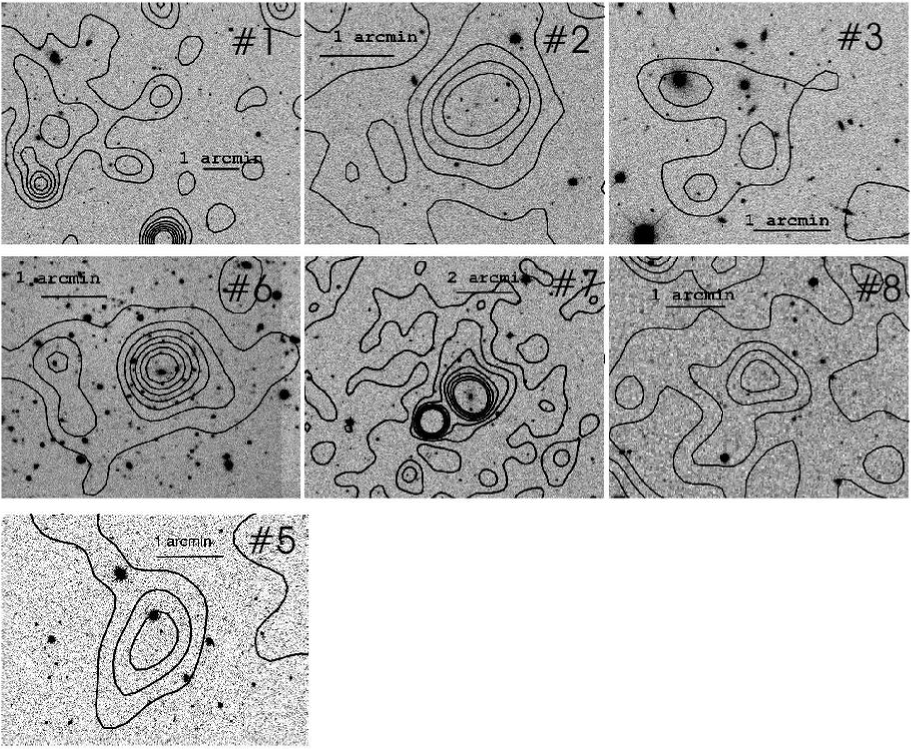
In Figure 1 we present optical images of our seven final X-ray clusters overlayed with their corresponding X-ray contours. The contours were constructed from their smoothed X-ray image, using a Gaussian with a 1 radius of 3 pixels ( arcsec). The four brightest clusters ( 1, 2, 6 and 7) have successive contour width separation corresponding to 0.1 smoothed counts, while the fainter ones ( 3, 5 and 8) have contour width separation of 0.05 smoothed counts. For the F864 northern clusters we use the optical -band SDSS images, while for two of the SGP clusters we use the available DSS optical images. For the cluster #6 we use a WFI (Wide Field Imager) r-band exposure (2400 s) taken in 27 December 2000 at the Anglo-Australian Telescope. More details of these optical observations are given in Georgakakis et al. (2004).
3.1 Flux Correction
Since clusters of galaxies are extended X-ray sources, their flux measured by any detection algorithm is only a fraction of the total flux. To take into account the undetected low surface brightness emission in the far wings of the source we apply a correction procedure which is based on fitting a King’s profile (King 1962) to the cluster X-ray surface brightness:
| (1) |
where is the projected X-ray surface brightness as a function of radius, is the central X-ray surface brightness, is the core radius of the cluster and is the ratio of the specific energy in galaxies to the specific energy in the hot gas. The true cluster integral source count rate, including the undetected flux, can be determined from:
| (2) |
Using the CIAO’s Sherpa task333http://cxc.harvard.edu/sherpa/ which is a minimization procedure, we estimate the values of , and the background surface brightness. Because of the relatively few X-ray counts, we fix the value of to two possible values ( and 1) which are good approximations for relatively high redshift clusters (eg. Arnaud et al 2002). We have verified that the convolution of the detector’s PSF with the fitted Kings-like profile does not significantly affect the resulting values of the core radii (difference ). For three of our clusters which have either very irregular X-ray emission or very few counts ( 1, 3 and 5) the King’s-like profile fitting is not as good, giving large . values. However, the fitted values of their core radii, , are corroborated also by visual inspection of their X-ray extension. These are: (1), (3) and (5).
We use the Energy Conversion Factors (ECF) of the individual detectors in order to convert count rates to flux. We assume a thermal emission (MEKAL) spectrum with a temperature estimated from the X-ray spectrum (see section 3.2) and a Galactic absorption of .
3.2 X-ray spectral fitting
We explore the X-ray spectral properties of our X-ray clusters using the xspec v11.2 package to fit their X-ray spectra. The spectra from the three detectors (MOS1, MOS2 and PN) were regrouped to have at least 25 counts per bin, thus ensuring that Gaussian statistics apply for the standard spectral fitting.
For each cluster an X-ray spectrum was extracted from a region large enough to include the cluster emission. A background spectrum was taken from nearby source free regions. We removed in advance the contribution of all point sources within the cluster and the background regions. A photon redistribution matrix (RMF) and ancillary region file (ARF) were created using the SAS rmfgen/arfgen tasks.
To derive the global cluster X-ray characteristics, the binned spectra in each instrument were fitted to a MEKAL) model of thermal plasma emission with photo-electric absorption using XSPEC (Arnaud 1996). We have kept only two free parameters, the temperature and the normalisation. The mean Galactic absorption of , the metal abundance of and the redshift were fixed.
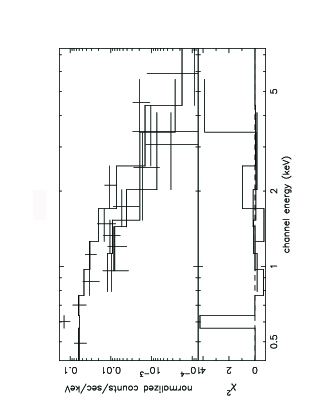
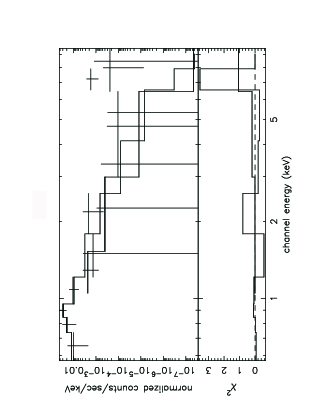
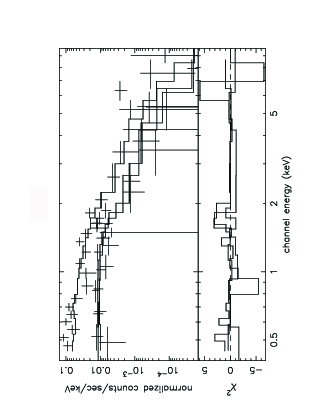
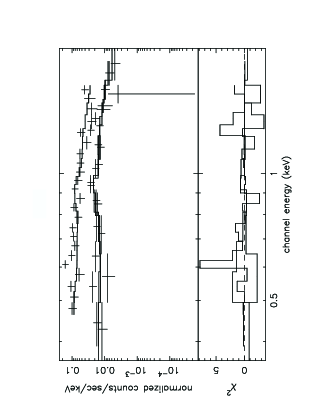
In Figure 2 we show the X-ray spectra for 4 of our cluster candidates.
3.3 Individual Cluster properties
The King’s profile and the spectral fits were used to derive the cluster corrected flux, luminosities and temperature and the results for the 7 cluster candidates are shown in Table 2. Note that the candidate X-ray clusters 2, 6, 7 and 8 of Table 1 are well fitted by a King’s profile (with ). Also listed in Table 2 is the reduced of the spectral fit while the errors presented are estimates.
| (′′) | (0.3-2 keV) | /d.f. | |||||||
|---|---|---|---|---|---|---|---|---|---|
| (keV) | |||||||||
| 1 | 30.0 | 30.0 | 19.4 | 15.4 | 43.62 | 43.52 | 4.6 | 1.46 | 0.391 |
| 2 | 39.4 | 50.7 | 18.9 | 11.9 | 44.12 | 43.92 | 2.6 | 0.93 | 0.682 |
| 3 | 10.0 | - | 15.8 | - | 42.16 | - | 1.0 | 0.63 | 0.121 |
| 5 | 15.0 | 15.0 | 2.5 | 2.0 | - | - | - | - | - |
| 6 | 20.6 | 29.5 | 11.4 | 8.6 | 43.73 | 43.61 | 3.4 | 1.22 | 0.562 |
| 7 | 26.2 | 36.2 | 15.8 | 11.2 | 42.90 | 42.75 | 2.6 | 1.10 | 0.203 |
| 8 | 26.8 | 35.2 | 4.4 | 3.0 | - | - | - | - | - |
1 estimated by Goto et al. (2002); 2 spectroscopically confirmed by Couch et al. (1991); 3 2df redshift of central BCG with , Colless et al (2001).
Note that XMM2DF J134139.2+001739 is also found in the SDSS optical data, by a variety of detection algorithms, with an estimated redshift of by Goto et al. (2002) and , based on the matched filter algorithm, by Basilakos et al. (2004). XMM2DF J134304.8-000056 was detected also by Couch et al. (1991) and its redshift was spectroscopically measured to be (detected on the SDSS data by Basilakos et al 2004 but not by Goto et al. 2002). XMM2DF J134511.9-000953 is most probably a group of galaxies located at , detected also by Goto et al. (2002) The cluster J1888.16 CL was identified also in ROSAT data (Vikhlinin et al. 1998) while its spectroscopic redshift was measured to be by Couch et al. (1991).
For XMM2DF J005847.8-280027 we provide a prediction of the cluster redshift using the 2dF redshift () of the BCG (called 2MASX J00584850-2800414), which is centered on peak of the extended X-ray emission. Finally, the XMM2DF J005623.2-281818 and XMM2DF J134446.4-003019 candidates have not been previously detected and thus there is no reference in the literature of their redshift. The relatively compact form of their X-ray emission together with the faintness of the underline -band galaxy distribution suggests that they are very distant galaxy clusters, probably with . Moreover, due to their low photon statistics we were not able to estimate their temperature.
3.4 The and relations
We have attempted to construct the X-ray cluster relation and compare it with previous studies based on a ROSAT deep cluster survey (Rosati et al. 1998). We estimate the survey sky coverage for our extended sources assuming a cluster size with a mean radius of 35 arcsec (8 pixels), which is typical of the extent of our extended sources. Sliding a circular aperture of that size across the 0.3-2 keV background maps of the survey area we estimate at each position the background count fluctuations. These are then divided with the corresponding exposure time from the exposure map and converted to flux adopting a bremsstrahlung SED with temperature keV and Galactic absorption appropriate for each field. We finally correct these fluxes for the emission outside the aperture used by adopting a King’s surface brightness profile with the individual cluster core radii listed in Table 2. Note that 25 arcsecs correspond to a core radius of kpc at a characteristic depth of . The area in square degrees available to an extended cluster source of a given 0.3-2 keV flux is shown in Figure 3.
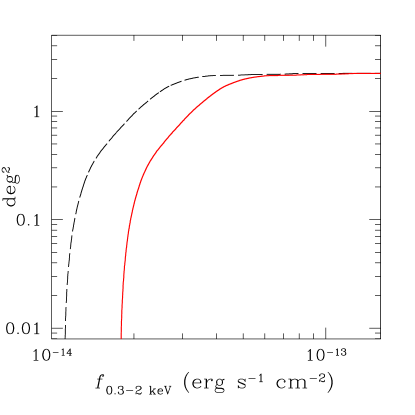
The solid and dashed lines correspond to models with and respectively, also note that we have verified that the area curve is not particularly sensitive to the choice of the aperture size used to sum the background counts, the SED adopted to convert count rates to fluxes or the correction factor to total flux.
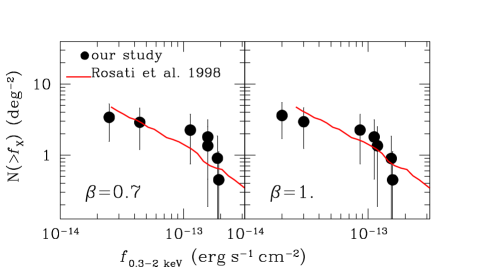
The X-ray cluster using the seven extended X-ray sources in our sample is plotted in Figure 4, together with the Rosati et al. (1998) ROSAT based relation. In the left panel we plot the based results while in the right panel the corresponding results. Within 1 there is a good agreement although our results appear to be somewhat higher than those of Rosati et al. (1998). This is probably attributed to our small number statistics.
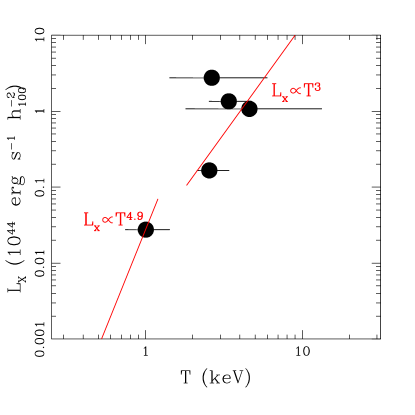
Finally, in Figure 5 we plot the cluster against cluster (symbols) for the case (see table 2). Due to our poor statistics we do not perform a direct fit to extract the relation. However, we show in Figure 5 the expected relation for keV with a normalization corresponding to the local relation (see Rosati et al 2002) while for keV we plot the relation found by Helsdon & Ponman (2000). It is evident that our clusters roughly follow the expected trends.
4 Conclusions
We have applied the SAS wavelet detection algorithm on a wide field () shallow, , XMM-Newton survey to find extended emission associated with clusters of galaxies. After excluding spurious detections due to CCD gaps, image edges and the blending of point sources we identified eight extended sources in either the merged MOS or PN images. One of these was excluded from our final list because using available Chandra data it was found to be three point sources blended together. In the case where good quality optical observations are available, galaxy overdensities were detected in 4 out of 5 cases. We have analysed the X-ray spectra of all seven candidates and derived an estimate of the cluster temperature for the five which had enough photon statistics. We derive for the first time the XMM-Newton cluster ; despite the limited number statistics, and the relation which appear to be in agreement with previous ROSAT results (see Rosati et al. 2002).
5 Acknowledgments
This work is jointly funded by the European Union and the Greek Government in the framework of the program “Promotion of Excellence in Technological Development and Research”, project “X-ray Astrophysics with ESA’s mission XMM”.
References
- [] Abell, G.O., Corwin, H.G. & Olowin, R.P., 1989, ApJS, 70, 1
- [] Arnaud, K.A., 1996, in Astronomical Data Analysis Software and Systems V, ASP. Conference Series, Vol. 101, 1996, G.H. Jacoby & J.Barnes, eds., p.17.
- [] Arnaud, M. et al., 2002, A&A, 390, 27
- [] Bahcall, N., et al., 2003, ApJS, 148, 243
- [1] Basilakos, S., Plionis, M., Georgakakis, A., Georgantopoulos, I., Gaga, T., Kolokotronis, V., Stewart, G.C., 2004, MNRAS, 351, 989
- [] Böhringer H., et al. , 2001, A&A, 369, 826
- [] Borgani, S., &, Guzzo, L., 2001, Nature, 409, 39
- [] Castander, F.J., et al., 1995, Nature, 377, 39
- [] Colless M., Dalton G., Maddox S. et al., 2001, MNRAS, 328, 1039.
- [] Couch, W.J., Ellis, R.S., Malin, D.F., MacLaren, I., 1991, MNRAS, 249, 606
- [] Dalton, G. B., Efstathiou, G., Maddox, S.J., Sutherland, W.J., 1994, MNRAS, 269, 151
- [] Damiani, F., Maggio, A., Micela, G., Sciortino, S., 1997a, ApJ, 483, 350
- [] Damiani, F., Maggio, A., Micela, G., Sciortino, S., 1997b, ApJ, 483, 370
- [] de Grandi, S., et al., 1999, ApJ, 514, 148
- [] Donahue, M., et al., 2002, ApJ, 569, 689
- [] Ebeling, H., et al., 1996a, Proc. Roentgenstrahlung from the Universe, MPE, Report 263, ed. H. U. Zimmerman, J. Trümper, H. Yorke (ISSN 0178-1719), 579
- [] Ebeling, H., Voges, W., Böhringer H., Edge, A. C., Huchra, J. P., Briel, U. G., 1996b, MNRAS, 281, 799
- [] Ebeling, H., et al., 2000, ApJ, 534, 133
- [] Fukugita M., Ichikawa T., Gunn J. E., Doi M., Shimasaku K., Schneider D. P., 1996, AJ, 111, 1748
- [] Georgakakis, A., Georgantopoulos, I., Vallb , M., Kolokotronis, V., Basilakos, S., Plionis, M., Stewart, G.C., Shanks, T., Boyle, B.J., 2004, MNRAS, 349, 135
- [] Gioia, I.M., Henry, J.P., Mullis, C. R., Voges, M., Briel, U.G., Böhringer H., Huchra, J.P., 2001, ApJ, 553, L105
- [] Gladders, M.D., Yee, H.K.C, 2000, AJ, 120, 2148
- [] Goto, T. et al., 2002, AJ, 123, 1807
- [] Helsdon, S.F., Ponman, T.J., 2000, MNRAS, 315, 356
- [] King, I., 1962, AJ, 67, 471
- [] Kolokotronis, V., Georgakakis, A., Basilakos, S., Georgantopoulos, I., Plionis, M., Kitsionas, S., Gaga, T., 2005, astro-ph/0503409
- [] Land, K.R., et al., 2004, astro-ph/0405225
- [] Lumsden, S.L., Nichol, R.C., Collins, C.A., Guzzo, L., 1992, MNRAS, 258, L1
- [] Moretti, A. et al., 2004, A&A, 428, 21
- [] Olsen, L.F et al., 1999, A&A, 345, 681
- [] Pierre, M., et al., 2004, JCAP, 409, 11
- [] Plionis, M., Basilakos, S., Georgantopoulos, I., Georgakakis, A., 2005, ApJ, 622, L17
- [] Postman, M., Lubin, L.M., Gunn, J.E., Oke, J.B., Hoessel, J.G., Schneider, D.P., Christensen, J.A., 1996, AJ, 111, 615
- [] Rosati P., della Ceca R., Norman C., Giacconi R., 1998, ApJL, 492, L21
- [] Rosati P., Borgani, S., Norman, 2002, Ann. Rev. Astron. & Astroph., 40, 539
- [] Scharf, C.A., Jones, L.R., Ebeling, H., Perlman, E., Malkan, M., Wegner, G., 1997, ApJ, 477, 79
- [] Stocke, J. T., Morris, S. L., Gioia, I. M., Maccacaro, T., Schild, R., Wolter, A., Fleming, T. A., Henry, J. P., 1991, ApJS, 76, 813
- [] Stoughton, C., et al., 2002, AJ, 123, 485
- [] Valtchanov, I., et al., 2004, A&A, 423, 75
- [] Vikhlinin A., McNamara B., Forman, W., Jones, C., Quintana, H., Hornstrup, A., 1998, ApJ, 502, 558.
- [] York D. G., et al., 2000, AJ, 120, 1579.