Stellar disk truncations at high–z: probing inside–out galaxy formation
Abstract
We have conducted a systematic search for stellar disk truncations in disk–like galaxies at intermediate redshift (z1.1) using the Hubble Ultra Deep Field (UDF) data. We use the position of the truncation as a direct estimator of the size of the stellar disk. After accounting for the surface brightness evolution of the galaxies, our results suggest that the radial position of the truncations has increased with cosmic time by 1–3 kpc in the last 8 Gyr. This result indicates a small to moderate (25%) inside–out growth of the disk galaxies since z1.
Subject headings:
galaxies: spiral — galaxies: high–redshift — galaxies: structure — galaxies: evolution1. Introduction
Understanding the formation and evolution of galactic disks is an important goal of current cosmology. The surface brightness of the disks of present–day galaxies are well described by an exponential law (Freeman 1970), with a certain scalelength, taken as the characteristic size of the disk. However, since van der Kruit (1979) it is known that some stellar disks are truncated in the outer parts (for a recent review see Pohlen et al. 2004). Stellar disk truncations have been explained as a consequence of the inhibition of widespread star formation below a critical gas surface density (Kennicutt 1989; Martin & Kennicutt 2001). Alternatively, van der Kruit (1987), has proposed that the truncation radius corresponds to the material with the highest specific angular momentum in the protogalaxy. Recent models (Elmegreen & Parravano 1994; Schaye 2004) emphasize the transition to the cold interstellar medium phase as responsible for the onset of local gravitational instability, triggering star formation.
To date it is not systematically explored whether the above description of present–day galactic disks is valid at high–z, and consequently, it is not clear whether the truncation radius of high–z disks evolves with cosmic time. However, very recently, Pérez (2004) has shown that such kind of analysis is feasible at intermediate redshift (z1). Addressing the question of how the radial truncation evolves with z is strongly linked to our understanding of how the galactic disks grow and how the star formation is taking place. In this paper we propose the use of the truncation of stellar disks as a direct estimator of their sizes. The evolution of the position of the truncation, consequently, will clarify whether the galaxies are growing inside-out with the star formation propagating radially outward with time.
The above issue can be addressed observationally with a structural analysis of galaxy samples both in the near and in the high–z universe. Such studies require to follow the galaxy surface brightness distributions down to very faint magnitudes (27–28 V–band mag/arcsec2) with enough signal to noise to assure a reliable measurement of the disk truncation. The depth of the images plays a critical role in the high–z truncation detections because of the cosmological surface brightness dimming. In addition, it is necessary to work with high resolution images to avoid the seeing effects on the shape of the surface brightness distribution. This means to use the deepest observations taken with the HST telescope. For that reason we have decided to analyse the disk–like galaxies in the UDF. In order to maintain our analysis in the optical restframe, the combination of k–correction and the cosmological dimming restricts the use of the optical HST imaging for this project up to z1. Throughout, we will assume a flat –dominated cosmology (=0.3, =0.7 and H0=70 km s-1 Mpc -1).
2. Data, Sample Selection and Surface Brightness Profiles
Our galaxies have been selected in the Hubble Ultra Deep Field (Beckwith et al. 2005). This survey is a 400-orbit program to image a single field with the Wide Field Camera (WFC) of the Advanced Camera for Surveys (ACS) in four filters: F435W (B), F606W (V), F775W (i), and F850LP (z). We have used the public available V, i and z-band mosaics with a pixel scale of 0.03′′/pixel. The FWHM is estimated to be 0.09 seconds of arc.
To make the selection of our sample we have taken advantage of the fact that the UDF field is within the Galaxy Evolution from Morphology and SEDs (GEMS; Rix et al. 2004) imaging survey with the ACS pointing to the Chandra Deep Field South (CDF–S). Focusing on the redshift range 0.1z1.1, GEMS provides morphologies and structural parameters for nearly 10000 galaxies (Barden et al. 2005; McIntosh et al. 2005). For these galaxies photometric redshift estimates, luminosities, and SEDs exist from COMBO–17 (Classifying Objects by Medium–Band Observations in 17 Filters; Wolf et al. 2001, 2003). The COMBO–17 team has made this information publically available through a catalog with precise redshift estimates (z/(1+z) 0.02) for approximately 9000 galaxies down to mR24 (Wolf et al. 2004). Rest–frame absolute magnitudes and colors, accurate to 0.1 mag, are also available for these galaxies.
Barden et al. (2005) have conducted the morphological analysis of the late–type galaxies in the GEMS field by fitting Sérsic (1968) r1/n profiles to the surface brightness distributions. Ranvidranath et al. (2004) have shown that using the Sérsic index as a criteria, it is feasible to disentagle between late– and early– type galaxies at intermediate redshifts. Late–types (Sab–Sdm) are defined through 2–2.5. Moreover, the morphological analysis conducted by Barden et al. provides the information about the inclination of the galaxies. This is particularly important since we want to study the truncations of the stellar disks in objects with low inclination. The edge–on view facilitates the discovery of truncations but introduces severe problems caused by the effects of dust and line–of–sight integration that we want to avoid (Pohlen et al. 2002).
Our sample is selected as follows, we have taken all the galaxies in the COMBO-17 CDF–S catalog with R24 mag that are in common with the UDF object detection catalog (Beckwith et al. 2005). This leaves a total of 166 objects. From these, 133 have photometric redshift estimation (i.e. a 80% completeness). To maintain our analysis in the optical restframe we select only the 118 galaxies with z1.1. The mean redshift of these galaxies is 0.68. At that redshift, the faintest absolute B–band restframe magnitude able to be analysed is MB-18.6 mag (AB system). We take this value as a compromise between maximizing the number of objects in our final sample and at the same time assuring as much as possible homogeneity (equal luminous objects) through the full redshift range. Applying this magnitude cut we get 63 galaxies. It is important to note however that, strictly, only those objects brighter than MB-20 are observable homogeneously up to z=1.1. Finally, we select from the 63 galaxies only those objects that according to the GEMS morphological analysis have n2.5 (i.e. those which have disk–like surface brightness profiles) and e0.5 (i.e. i60∘). Our final sample contains 36 galaxies. These galaxies are presented in Table 1.
To analyse the surface brightness profiles of our galaxies in a similar rest–frame band along the explored redshift range (0.1z1.1), we have extracted the profiles in the following bands: V–band for galaxies with 0.1z0.5, i–band for 0.5z0.8 and z–band for 0.8z1.1. This allows us to explore the surface brightness distribution in a wavelength close to the B–band restframe. In addition, to probe whether the position of the truncation depends on the observed wavelength we have analysed all galaxies in the reddest band available: the z–band.
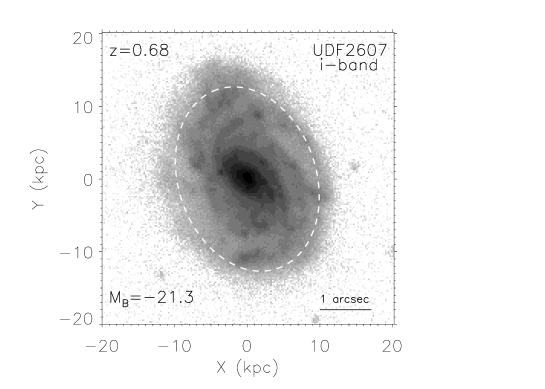
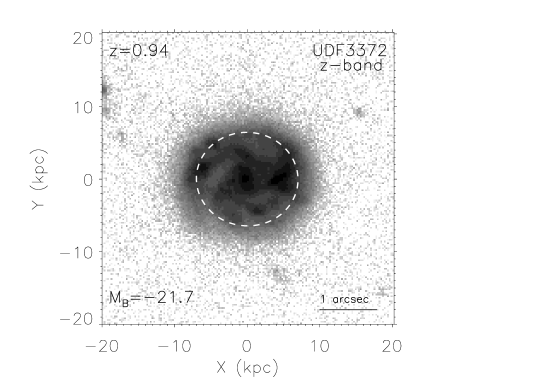
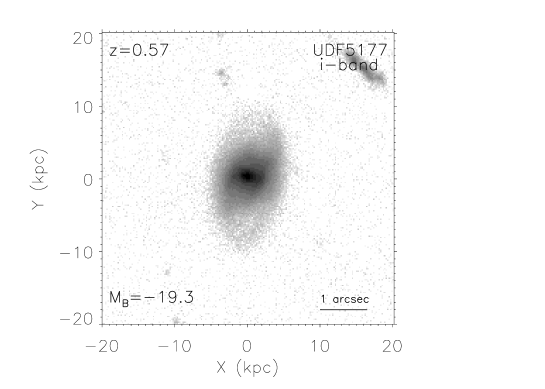
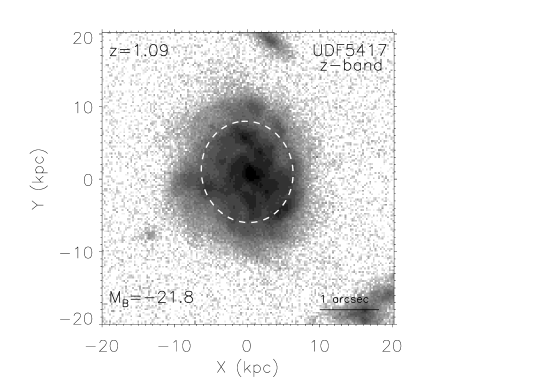
The surface brightness profiles were extracted through ellipse fitting using the ELLIPSE task within IRAF. Fitting ellipses over the whole galaxy produces similar surface brightness profiles than those obtained through averaging different image segments (Pohlen et al. 2002; Pérez 2004). Initially the ellipticity (E) and the position angle (PA) of the elliptical isophotes are left as free parameters in order to determine the best set of E and PA describing the outer disk. This is done for all the galaxies in the z–band. The isophote fitting in the z–band is less affected by additional structure in the galaxies like spiral arms and prominent blobs of star formation and, consequently, the above parameters are retrieved more accurately. We select the E and PA at the radius where the mean flux of the best fitted free ellipse reaches 1 of the background noise (this means 26.3 mag/arcsec2 in the z–band in the AB system). We have checked visually that for all the cases this criteria is selecting an isophote well outside the inner region of the disk. Once E and PA are determined we run again ELLIPSE with these parameters fixed. In order to avoid contamination in our isophote fitting we masked all the surrounding neighbors. Examples of the final surface brightness profiles obtained are shown in Fig. 1.
From our sample of 36 galaxies there were 21 galaxies which show a truncation in the surface brightness profiles. We have named these galaxies Type DB (i.e. DownBending). The exact details of how the position of the breaks were estimated are explained in Pohlen & Trujillo (2005), consequently here we explain only very briefly the technique. According to the observations, around the break the surface brightness profile is well described by two exponential functions with scalelenghts h1 and h2, so we use the derivative of the surface brightness profile to estimate the position of the transition. The position of the break is measured at the radial position were the derivative profile crosses the horizontal line defined by (h1+h2)/2. The values obtained that way match very well with our estimations done by eye. The position of the break depends on the shape of the transition region between both exponentials. A conservative estimate of the uncertainty of the position is 8%. In addition, we do not find any systematic difference in the position of the break at using the z–band or the band closest to the B–band restframe.
There were 6 galaxies where we do not observe any signature of a break along the profile. These galaxies are named Type I (Freeman 1970). We have another 9 galaxies where the outer profiles are distinctly shallower in slope that the main disk profile. We classify these as Type III following the notation by Erwin, Beckman & Pohlen (2005). We plan to study these objects in more detail in future papers.
3. Discussion
In Fig. 2a we show the absolute B–band restframe magnitude versus the position of the break for our high–z galaxy sample and, for comparison, a volume selected local sample (Pohlen & Trujillo 2005). The local sample comprises the 85 Sb–Sdm galaxies from the LEDA catalogue having a mean heliocentric radial velocity relative to the Local Group (corrected for virgocentric inflow) 3250 km/s and MB-18.5 (AB system), with useful imaging data available in the Sloan Second Data Release (DR2). These galaxies were selected to be face–on to intermediate inclined (e0.5). This sample represents the largest sample ever used to homogeneously probe for truncations using low inclination galaxies. From this sample we plot in Fig. 2a the 35 galaxies which present a truncation. The truncation radii of the local sample shown in Fig. 2a were estimated in the SLOAN g–band.
The most simple description, a linear fit, of the local sample provides with the following fit: Rbreak=-2.3MB-35.7. We overplot this in Fig. 2a and Fig. 2b. On the other hand, galaxies at z0.65 present 4–5 kpc smaller truncation radii at a given luminosity than the present–day galaxies (Fig. 2a). A linear fit gives: Rbreak=-2.0MB-34.9. A concern is whether our high–z galaxies are biased towards brighter surface brightness truncations (and consequently towards smaller sizes). To test this we explored the surface brightness distribution (in the observed band closest to the B–band rest–frame) at the break positions. The distribution peaks at 24.1 mag/arcsec2 with a scatter of 0.9 mag. Our faintest surface brightness at the break is 25.5 mag/arcsec2. We do not detect truncations between 25.5 and 27 mag/arcsec2 (approximately our surface brightness detection limit). This indicates our sample is not biased and we are probing all the truncations much brighter than 27 mag/arcsec2.
The stellar population of the galaxies are known to be younger at high–z and consequently we expect that the galaxies were much brighter in the past than what they are today. To check whether the evolution of the surface brightness alone is able to explain the different distribution of the galaxies, we have applied a correction on the observed absolute magnitudes of the high–z galaxies using the observed mean surface brightness evolution found in Barden et al. (2005) for disk–like objects (i.e. we use d/dz=-1.430.03). Under the assumption of no evolution in the size of the objects this corresponds to the same degree of evolution in the absolute magnitude (i.e. MB(0)=MB(z)+1.43z). The result of doing this is shown in Fig. 2b. After the magnitude correction the position of the breaks for the high–z population is still systematically smaller by 1–3 kpc at a given “corrected” luminosity. A linear fit results on Rbreak=-1.9MB-30.5. This corresponds to an increase of 25% in the size of the inner disk since z1. Although we are using the largest samples in existence where the truncations have been explored systematically, the estimation of the exact evolution is limited by the small number statistic. It is important, however, to note that this is the first time that the position of the high–z stellar disk truncations is used to probe directly the growth of disk galaxies with cosmic time.
Our results are consistent with a moderate inside–out formation of galactic disks. This agrees with the conclusions obtained indirectly by Barden et al. (2005) and Trujillo et al. (2004; 2005) analysing the evolution of the luminosity and stellar mass–size relations since z3.
References
- (1)
- (2) Barden, M. et al. 2005, ApJ, submitted, astro-ph/0502416
- (3) Beckwith, S. V. W. et al. 2005, in preparation
- (4) Elmegreen, B. G., & Parravano, A., 1994, ApJ, 435, L121
- (5) Erwin, P., Beckman J.E., & Pohlen, M., 2005, ApJL, in press
- (6) Freeman, K. C., 1970, ApJ, 160, 811
- (7) Kennicutt, R. C., Jr., 1989, ApJ, 344, 685
- (8) Martin, C. L., & Kennicutt, R. C., Jr. 2001, ApJ, 555, 301
- (9) McIntosh et al., 2005, ApJ, submitted, astro-ph/0411772
- (10) Pérez, I., 2004, A&A, 427, L17
- (11) Pohlen, M., Dettmar, R. J., Lütticke, R., Aronica, G., 2002, A&A, 392, 807
- (12) Pohlen, M., Beckman J.E., Hüttemeister, S., Knapen, J. H., Erwin, P., Dettmar, R.-J., 2004, astro-ph/0405541
- (13) Pohlen, M., & Trujillo, I., 2005, in preparation
- (14) Ravindranath, S., et al., 2004, ApJ, 604, L9
- (15) Rix, H.-W., et al., 2004, ApJS, 152, 163
- (16) Schaye, J., 2004, ApJ, 609, 667
- (17) Sérsic, J.-L., 1968, Atlas de Galaxias Australes (Cordoba: Observatorio Astronomico)
- (18) Trujillo et al. 2004, ApJ, 604, 521
- (19) Trujillo et al. 2005, ApJ, submitted, astro-ph/0504225
- (20) van der Kruit, P. C., 1979, A&AS, 38, 15
- (21) van der Kruit, P. C., 1987, A&A, 173, 59
- (22) Wolf, C., et al. 2001, A&A, 365, 681
- (23) Wolf, C., Meisenheimer, K., Rix, H. W., Borch, A., Dye, S., Kleinheinrich, M., 2003, A&A, 401, 73
- (24) Wolf, C. et al., 2004, A&A, 421, 913
- (25)


| UDF ID | zphot | MB | Break Type | Rbreak | |
|---|---|---|---|---|---|
| (mag) | (arcsec) | (mag/arcsec2) | |||
| 328 | 0.24 | -20.6 | DB | 2.4 | 22.9 |
| 900 | 0.45 | -20.8 | III | – | – |
| 901 | 1.00 | -20.1 | I | – | – |
| 968 | 0.66 | -21.4 | DB | 1.1 | 23.3 |
| 1971 | 0.14 | -19.2 | DB | 3.9 | 25.4 |
| 2525 | 0.69 | -19.6 | DB | 0.9 | 25.5 |
| 2607 | 0.68 | -21.3 | DB | 1.8 | 24.4 |
| 3180 | 0.80 | -20.1 | DB | 1.1 | 25.2 |
| 3203 | 0.35 | -18.6 | I | – | – |
| 3268 | 0.28 | -18.6 | DB | 1.4 | 25.4 |
| 3372 | 0.94 | -21.7 | DB | 0.9 | 22.7 |
| 3613 | 1.09 | -21.4 | I | – | – |
| 3822 | 0.19 | -20.0 | III | – | – |
| 4142 | 0.67 | -20.6 | III | – | – |
| 4394 | 0.66 | -21.1 | DB | 1.1 | 23.6 |
| 4438 | 1.06 | -21.3 | DB | 1.1 | 24.2 |
| 4491 | 1.07 | -20.7 | DB | 0.6 | 24.1 |
| 4929 | 0.45 | -20.3 | III | – | – |
| 5177 | 0.57 | -19.3 | I | – | – |
| 5268 | 0.61 | -19.0 | DB | 0.4 | 23.3 |
| 5417 | 1.09 | -21.8 | DB | 0.9 | 23.4 |
| 6821 | 1.07 | -20.1 | DB | 0.5 | 23.9 |
| 6853 | 0.79 | -19.2 | III | – | – |
| 6862 | 0.68 | -20.3 | III | – | – |
| 6974 | 0.61 | -20.1 | DB | 1.2 | 25.1 |
| 7112 | 1.00 | -20.0 | DB | 0.4 | 23.2 |
| 7556 | 0.63 | -21.7 | DB | 2.3 | 24.4 |
| 7559 | 0.93 | -20.4 | III | – | – |
| 8040 | 0.22 | -18.9 | I | – | – |
| 8049 | 0.46 | -20.4 | III | – | – |
| 8125 | 1.07 | -20.5 | I | – | – |
| 8257 | 0.57 | -20.1 | III | – | – |
| 8275 | 0.71 | -21.3 | DB | 1.4 | 24.4 |
| 8810 | 0.72 | -20.1 | DB | 0.4 | 22.7 |
| 9253 | 0.68 | -21.8 | DB | 1.3 | 23.3 |
| 9455 | 0.53 | -19.7 | DB | 1.4 | 25.1 |
Note. — Col. (1): Galaxy ID number according to the UDF catalog Col. (2): Photometric redshift from COMBO-17 Col. (3): Absolute B–band restframe magnitude from COMBO-17 (AB system) Col. (4): Surface brightness break type; Type I: no break detected, Type DB: DownBending break, Type III: anti–truncation (upbending). Col (5): Truncation Radius Col. (6) Observed surface brightness at the break position in the band closest to the rest–frame B–band.