11email: krips@ph1.uni-koeln.de 11email: eckart@ph1.uni-koeln.de 22institutetext: Institut de Radio-Astronomie Millimétrique (IRAM), 300, rue de la Piscine, 38406 St.Martin-d’Hères, France
22email: neri@iram.fr 33institutetext: Instituto de Astrofísica de Andalucía (CSIC), C/ Camino Bajo de Huétor,24, Apartado 3004, 18080 Granada, Spain
33email: stephane@iaa.es 44institutetext: Observatoire de Paris, LERMA, 61 Av. de l’Observatoire, 75014 Paris, France
44email: francoise.combes@obspm.fr 55institutetext: Observatorio Astronómico Nacional (OAN)-Observatorio de Madrid, Alfonso XII, 3, 28014 Madrid, Spain
55email: burillo@oan.es 66institutetext: Istituto di Radioastronomia/CNR, Sez. Firenze, Largo Enrico Fermi, 5, 50125 Firenze, Italy
66email: hunt@arcetri.astro.it 77institutetext: Jansky Fellow, National Radio Astronomy Observatory Department of Astronomy, University of Maryland, College Park, MD 20742-2421
77email: ajb@astro.umd.edu 88institutetext: Max-Planck-Institut für extraterrestrische Physik, Postfach 1312, 85741 Garching, Germany
88email: linda@mpe.mpg.de 99institutetext: Max-Planck-Institut für Astronomie, Königstuhl 17, 69117 Heidelberg, Germany
99email: schinner@mpia-hd.mpg.de 1010institutetext: Max Planck Institut für Radioastronomie, Auf dem Hügel 69, 53121 Bonn, Germany
1010email: fboone@mpifr-bonn.mpg.de 1111institutetext: ESO, Karl-Schwarzschild-Str. 2, 85748 Garching, Germany
1111email: jpott@eso.org 1212institutetext: Astronomisches Institut, Universität Basel, Venusstr. 7, 4102 Binningen, Switzerland
1212email: ppe@astro.unibas.ch
Molecular Gas in NUclei of GAlaxies (NUGA)
III. The
warped LINER NGC 3718 ††thanks: Based on observations carried out
with the IRAM Plateau de Bure Interferometer. IRAM is supported
by INSU/CNRS (France), MPG (Germany) and IGN (Spain).
We present the first interferometric observations of CO(1–0) and CO(2–1) line emission from the warped LINER NGC~3718, obtained with the IRAM Plateau de Bure Interferometer (PdBI). This L1.9 galaxy has a prominent dust lane and on kiloparsec scales, a strongly warped atomic and molecular gas disk. The molecular gas is closely associated with the dust lane across the nucleus and its kinematic center is consistent with the millimeter continuum AGN. A comparison of our interferometric mosaic data, which fully cover the warped disk, with a previously obtained IRAM 30 m single dish CO(1–0) map shows that the molecular gas distribution in the disk is heavily resolved by the PdBI map. On the nucleus the interferometric maps alone contain less than one half of the single dish line flux, and the overall mosaic accounts for about a tenth of the total molecular gas mass of . After applying a short-spacing correction with the IRAM 30 m data to recover the missing extended flux, we find in total six main source components within the dust lane: one associated with the nucleus, four symmetrically positioned on either side at galactocentric distances of about 1.3 kpc and 4.0 kpc from the center, and a sixth on the western side at with only a very weak eastern counterpart. In the framework of a kinematic model using tilted rings, we interpret the five symmetric source components as locations of strong orbital crowding. We further find indications that the warp appears not only on kpc scales, but continues down to . Besides the sixth feature on the western side, the lower flux (a factor of ) of the eastern components compared to the western ones indicates an intrinsic large scale asymmetry in NGC 3718 that cannot be explained by the warp. Indications for a small scale asymmetry are also seen in the central 600 pc. These asymmetries might be evidence for a tidal interaction with a companion galaxy (large scales) and gas accretion onto the nucleus (small scales). Our study of NGC 3718 is part of the NUclei of GAlaxies (NUGA) project that aims at investigating the different processes of gas accretion onto Active Galactic Nuclei (AGN).
Key Words.:
galaxies: individual: NGC~3718 – galaxies: active – galaxies: kinematics and dynamics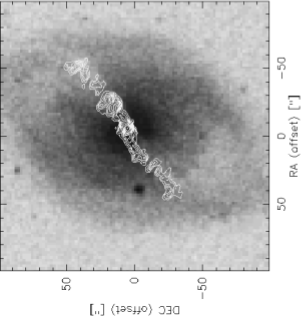
1 Introduction
Knowledge of the distribution and kinematics of the circumnuclear molecular gas in active galaxies is essential for understanding the fueling of the central engine and the role of gas and dust in obscuring the active nucleus (AGN). Although we have begun to understand the factors that influence nuclear activity, a wealth of unanswered questions still remain. In contrast to large scales () where dynamical perturbations like galaxy collisions, mergers, or mass accretion (Heckman et al. 1986) as well as bars, spirals and their gravity torques (Combes 1988) are responsible for the infall of gas, the processes responsible for removing angular momentum at small scales (sub-kpc) are not very well understood. Various scenarios invoking nested bars (e.g., Shlosman et al. 1993), spirals (e.g., Martini & Pogge 1999), warped nuclear disks (Schinnerer et al. 2000a,b), and lopsidedness or instabilities (Kormendy & Bender 1999; García-Burillo et al. 2000) have been proposed. Millimeter interferometry allows qualitative studies of molecular gas emission in these galaxies with arcsecond spatial resolution (and even below), high spectral resolution ( a few km s-1per channel) and high sensitivity (detectability thresholds a few tens pc-2). The NUclei of GAlaxies (NUGA) project (García-Burillo et al. 2003a,2003b) aims at establishing a high-resolution and high-sensitivity CO survey of 12 nearby AGN covering the full sequence of activity types including Seyfert 1 and Seyfert 2 galaxies as well as Low Ionization Nuclear Emission-line Region (LINER) and transition objects. The CO observations are conducted with the IRAM Plateau de Bure Interferometer (PdBI: Guilloteau et al. 1992), which currently provides the highest sensitivity and resolution for the study of the distribution and dynamics of molecular gas in the nuclei of these galaxies. Besides case by case analyses and simulations of each object (García-Burillo et al. 2003b, Combes et al. 2004), the collected data will also be used for a first-order approach to a statistical study of how gas flows into nuclei and the different mechanisms that account for further accretion inward.
One of the active galaxies belonging to the NUGA survey is NGC 3718 (Fig. 1), a peculiar, elliptical galaxy at a distance of 13 Mpc (Pott et al. 2004; Schwarz 1985). Together with its companion NGC 3729 it belongs to the Ursa Major group. It still remains unclear if and to what extent a gravitational interaction is taking place between these two galaxies. A large warped dust lane runs across the entire stellar bulge of NGC 3718; it has a width of at the center and diverges into several smooth filaments across the bulge ( corresponds to for NGC 3718). At a radius of about 1.5′ from the center, the dust lane bends by almost 90 degrees towards the north and south. This warp signature is also observed in the cold gas distribution, with the H I line emission tracing it out to a radius of more than 6′ (24 kpc) and CO line emission tracing it towards the center ( 20′′: Pott et al. 2004). The outer parts of the warp were kinematically modeled by Schwarz (1985), while the inner parts down to were modelled by Pott et al. (2004).
| 2000/01 | 2001/02 | ||
| cont@ | cont@ | cont@ | |
| 3 mm | 1 mm | 3 mm | |
| R.A. | 11:32:34.852 | 11:32:34.878 | 11:32:34.83 |
| (hhmmss) | 0.003 | 0.005 | 0.01 |
| Dec | 53:04:04.51 | 53:04:04.3 | 53:04:04.2 |
| (∘:) | 0.06 | 0.1 | 0.1 |
| peak flux | 9.40.7 | 102 | 71 |
| () | |||
NGC 3718 is classified as a LINER galaxy of type 1.9 (Ho et al. 1997). Weak, broad H emission with FWHM is emitted from the nucleus as well as strong [O I] =6300Åwith FWHM indicative of a hidden AGN (Filippenko et al. 1985; Ho et al. 1997). So far no ultraviolet emission has been detected towards NGC 3718 (Barth et al. 1998), probably due to obscuration of the nucleus by dust, whereas a radio source has been confirmed at the position of the nucleus (this work; Burke & Miley 1973; Nagar et al. 2002).
2 Observations
NGC 3718 was observed with the IRAM 30m and the IRAM PdBI. The IRAM 30m observations are already described in detail by Pott et al. (2004) and will thus here only be discussed in the context of the short-spacing correction and resolution effects. The IRAM PdBI observations were carried out in two different modes: central pointing (one single field on the center) and mosaic (seven fields along the dust lane).
2.1 Central pointing
During winter 2000/2001, we mapped the CO(1–0) and CO(2–1) lines in a single field centered at the radio position of the AGN in NGC 3718, i.e., and (see section3.1.1). The PdBI was at this time deployed in the CD set of configurations with 5 antennae. The bandpass calibrator was 3C273, while the phase and amplitude calibration were performed on 1150+497. Fluxes have been calibrated relative to CRL618 and MWC349. The frequencies were centered on the redshifted 12CO(1–0) line in the USB at 3 mm and on the redshifted 12CO(2–1) line in the LSB at 1 mm. For each line, the total bandwidth was 580 MHz and the spectral resolution 1.25 MHz. The integration time for the central pointing amounts to hr on source. This gives a point source sensitivity of about 7 mJy ( 16 mJy) in channels of 1.25 MHz width at 3 mm (1 mm). The precipitable water vapor ranged between 4 and 10 mm (i.e., opacities of 0.2-0.3) resulting in system temperatures of approximately 200-300 K on average. We used the GILDAS software packages to reduce and map the data (Guilloteau & Lucas 2000). The synthesized beams are 4.7 at 41∘at 3 mm and 2.6 at 45∘at 1 mm.
2.2 Mosaic
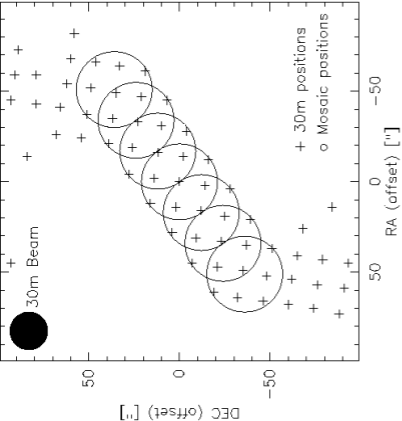
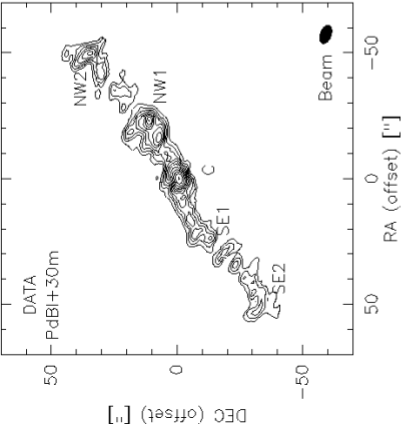
During winter 2001/2002, a mosaic of NGC 3718 was obtained with the PdBI. Seven mosaic fields of the CO(1–0) emission were repeatedly observed with six antennae or a subset in C and D configurations. These sample the molecular gas emission along the dust lane with kpc extent that was previously mapped with the IRAM 30 m by Pott et al. 2004 (Fig. 2; see also Hartwich et al. 2002 and Krips et al. 2003). The central field of the mosaic was set to the same position specified in section 2.1, and the separation between the pointings was , corresponding to half the primary beam size. The bandpass was calibrated on 3C84, 3C273, or 0923+392 with an accuracy of about 5%. The latter source and 1150+497 were used as phase and amplitude calibrator, observed every 20 minutes. To derive the absolute fluxes of the calibrators and the target source, values for each observing epoch were bootstrapped via a standard IRAM flux monitoring program, yielding an accuracy of the flux calibrations of at 3 mm and at 1 mm.
The spectral resolution was set to 1.25 MHz at 114.89 GHz, giving a contiguous bandwidth of 580 MHz. The integration time per field amounted to hr. The resulting point-source sensitivity is 17 mJy for a bandwidth of 1.25 MHz and 5 antennae at 3 mm. The precipitable water vapor ranged between 4 and 10 mm (i.e., opacities of 0.2-0.3) resulting in system temperatures of approximately 200-300 K on average. Even if the CO(2–1) line had been simultaneously observed in mosaic mode, the mosaic fields would only have been usable as single fields and not as complete mosaic since the separations of the mosaic fields are too large at 1 mm where the primary beam size is . Also, the sensitivity is too poor in most of the fields, resulting in no detection of the CO(2–1) line except in the central field.
3 The data
3.1 Central emission
3.1.1 Continuum
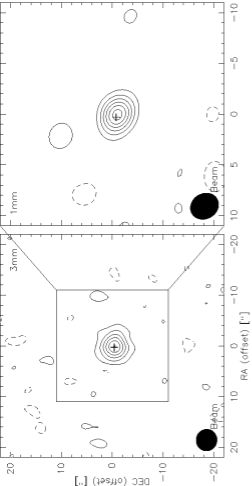
Before combining the central pointing observation (single-field) with the new central field from the mosaic observations, the continuum for both data sets at 1 mm and 3 mm has been independently determined from the line free channels. In both data sets at 3 mm, i.e. single field and central mosaic field, we detect faint continuum emission in the central region of NGC 3718. At 1 mm, only the single-field data set reveals continuum emission (see Fig. 3); we do not find any emission in the central mosaic field probably due to sensitivity limitations for the 1 mm mosaic data. At 3 mm as well as at 1 mm, the continuum emission is point-like relative to the respective beams (compare Table 1). The continuum declines by between the two observing epochs at 3 mm (see Table 1). Assuming an upper limit of at 1 mm for the continuum of the central field from the mosaic, we obtain a decline of relative to the single field data (flux ) consistent with the 3 mm data. As the atmospheric conditions were quite similar (similar amounts of water vapor) between both data sets, we can mostly exclude the possibility of atmospheric absorption which could cause an artificial drop of the flux between the data. The phase and amplitude calibrators were never separated from NGC3718 by more than a few degrees in elevation. The uncertainty in 3 mm flux calibration cannot explain all of the observed variability, although this is not the case at 1 mm. We do not find any support for a variable continuum source at other wavelengths in recent EVN and MERLIN measurements at 18 cm and 6 cm (Krips et al. in prep., epochs 2001 to 2004) or other cm observations (at 2 cm and 3.6 cm; e.g., Nagar et al. 2002). In conclusion, the detected mm-variability might be an intrinsic property of NGC 3718 but has to be further investigated.
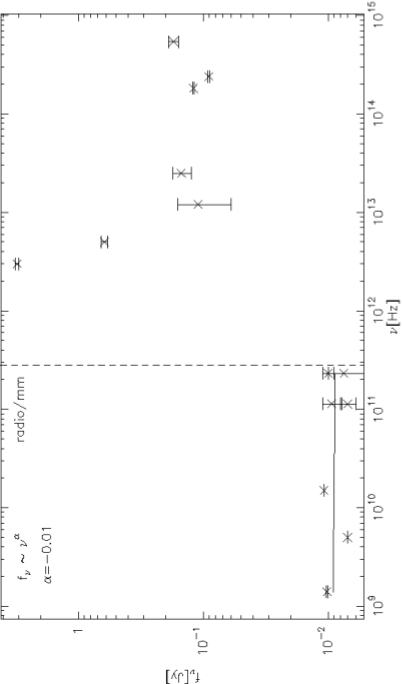
The derived positions are consistent between the two observing epochs as well as between 1 mm and 3 mm. They also agree with the positions of the nucleus obtained at cm and optical wavelengths within the errors. Accounting for a weak variability, a comparison between our mm fluxes and cm fluxes observed with the VLA in 1997 (Becker et al. 1995), 1998 (Nagar et al. 2001), and 1999 (Nagar et al. 2002) indicates a spectral index of -0.010.1 depending on which of our two observing epochs is used. This corresponds to a flat to inverted spectrum for the central source in NGC 3718, like those found for many other low-luminosity active nuclei in Seyfert galaxies and LINERs (Wrobel & Heeschen 1991; Slee et al. 1994; Nagar et al. 2000). The flat radio spectra exclude emission from optically thin synchrotron emission, as is often seen from extended radio jets, since this produces steep radio spectra. Thus, synchrotron self-absorption or advection dominated accretion flows (ADAFs: Narayan, Mahadevan & Quataert 1998; Quataert 2001) have to be considered. A compact jet in combination with an ADAF (Falcke 1996; Falcke & Marloff 2000; Falcke 2001) also cannot be excluded. If a longitudinal pressure gradient were to cause the jet to accelerate rapidly, the integrated radio emission of the compact core jet would also have a slightly inverted radio spectrum.
3.1.2 Line
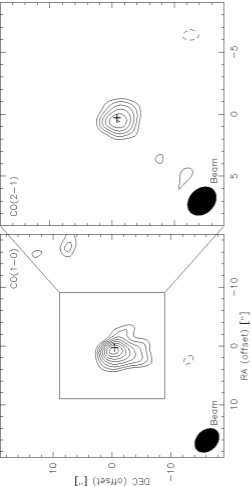
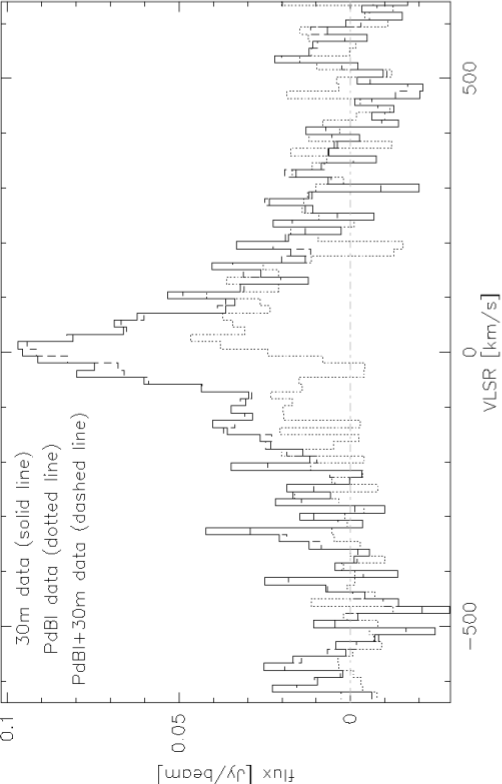
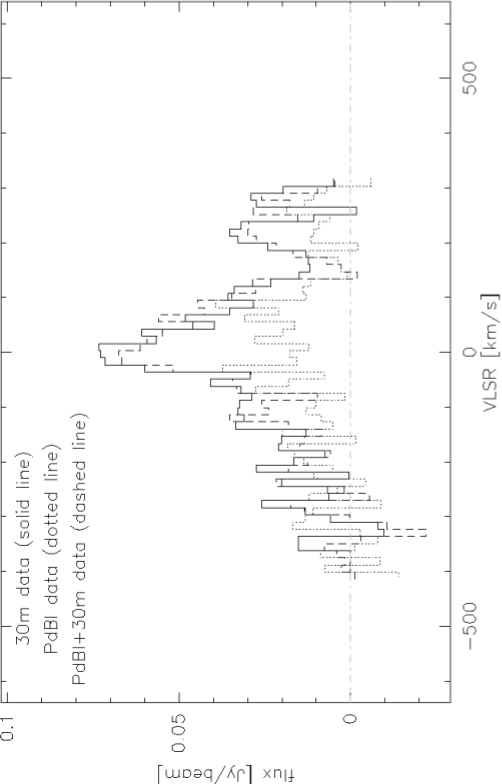
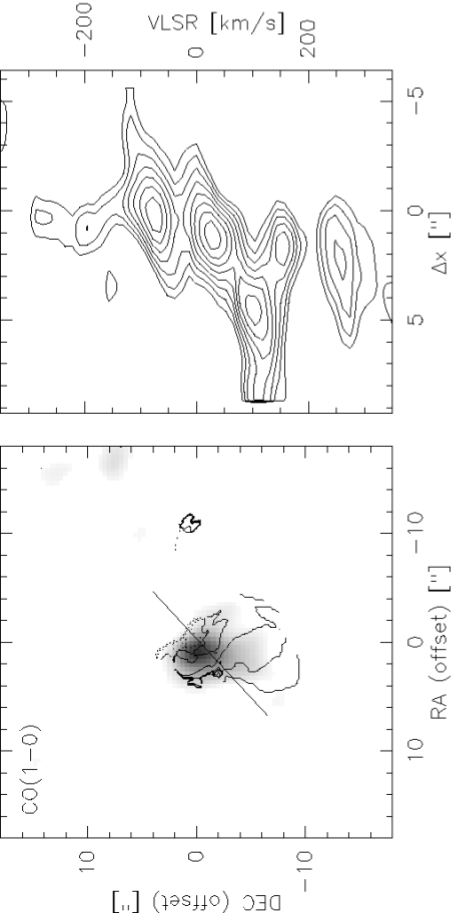
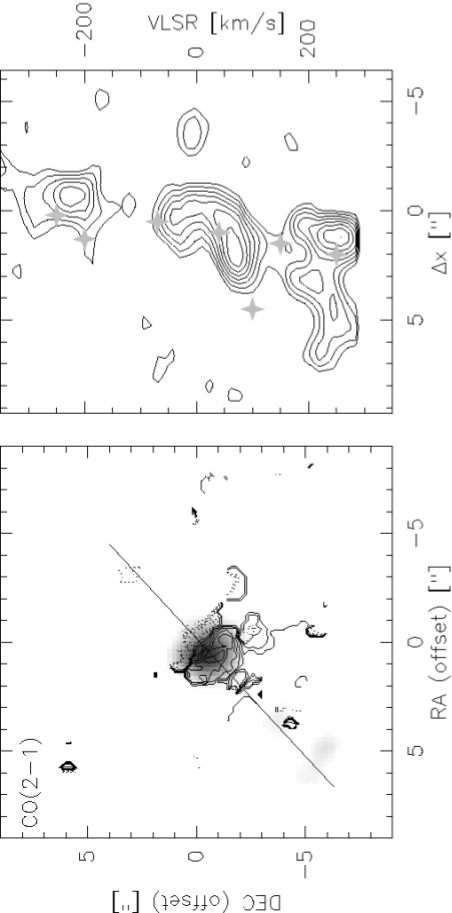
After subtracting the continuum emission in the plane from the (continuum+line) channels, CO(1–0) and CO(2–1) line emission is detected in the central 10′′ ( 1 kpc) of NGC 3718. The combined central maps are shown in Fig. 4. In both lines the emission is slightly extended. The positions of the integrated CO(1–0) and CO(2–1) emission are similar to the nuclear position derived from the radio. Also, the iso-velocity diagram in Fig. 7 shows that the dynamical center of the CO emission lies on the radio nucleus. A comparison of the flux observed with the PdBI and the IRAM 30 m single dish reveals that the interferometer recovers less than one half of the peak line flux seen with the 30 m telescope (see Fig. 6). This indicates that the emission in NGC 3718 must be much more extended and diffuse than is apparent in the integrated map of Fig. 4. Assuming a standard (=(H2+He)=1.36 (H2)) to ratio of (Kkm s-1pc2)-1 (Solomon & Barrett 1991), the central molecular gas mass amounts to in the PdBI map, in contrast to in the 30 m map (Pott et al. 2004). Downes et al. (1993) emphasize, however, that the standard galactic conversion factor between gas mass and CO luminosity might fail for the centers of galaxies where the molecular gas is bound by the total gravitational potential of the galaxy rather than by self-gravity. In such a case, the conversion factor would be up to 5 times lower than the standard galactic one, resulting in gas masses of for the PdBI map and for the 30 m map.
By comparing the distributions of the central CO(1–0) and CO(2–1) line emission, we find that the CO(1–0) emission shows an elongation towards the south, almost perpendicular to the beam. We estimate the integrated line ratio CO(2–1)/CO(1–0) to indicating subthermal excitation conditions and cold gas. To obtain this value, we have first truncated the inner region of the CO(1–0) data and the outer region of the CO(2–1) data to get comparable coverages and resolutions for the two transitions, integrated both lines over the same velocity range of -300km s-1to +300km s-1and then transformed the flux (Jansky) into temperature (Kelvin). However, due to the limited signal-to-noise and the difference of the weighting factors between both transitions, the reliability of this estimate is still questionable and thus the value of derived in the center by Pott et al. (2004) might be a better indicator for the physical conditions in NGC 3718.
Fig. 7 shows the zero order moment maps of both transitions overlaid with contours from the first order moment maps and the position velocity cuts taken along the kinematic major axis. The CO(2–1) maps are quite noisy but are plotted for consistency and comparison purposes. The position velocity diagram of the CO(1–0) line emission reveals a quite extended () velocity gradient between km s-1. Two further features appear at very high velocities (km s-1) with a somewhat steeper gradient (). Consistent with Pott et al. (2004), the global velocity range of the inner amounts to almost 220km s-1. However, this “central” feature in the position velocity diagram extends in Pott et al. (2004) out to a radius of 15-20′′, while in our interferometric data it stops at a radius of . This rapidly rotating nuclear component will be discussed in section 4.3. The line emission shows a strong asymmetry in the position velocity diagram with only little emission towards the blueshifted velocities. Section 3.4 will show that this asymmetry cannot be totally traced back to missing short spacings.
| Component | R.A. (offset) | Dec. (offset) | Flux |
|---|---|---|---|
| [′′] | [′′] | Jykm s-1 | |
| SE2 | +523 | -343 | 1.2 |
| SE1 | +203 | -83 | 1.3 |
| C | 01 | 01 | 3.4 |
| NW1 | -191 | +91 | 2.9 |
| NW2 | -491 | +361 | 2.7 |
3.2 Overall emission
3.3 PdBI-only data
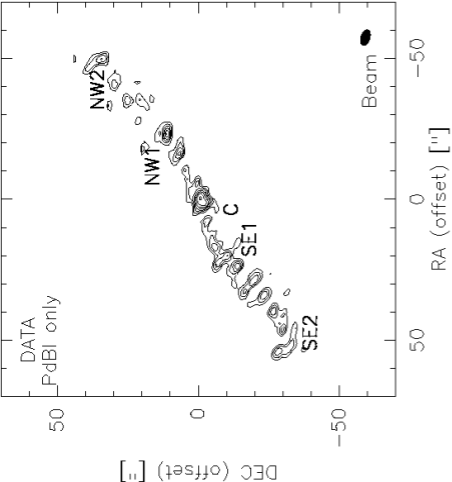
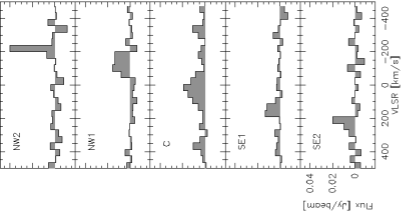
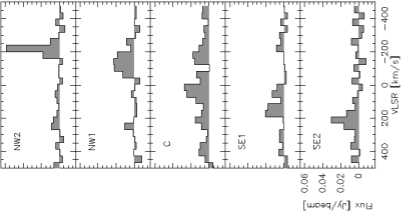
Outside the central mosaic field, there is no evidence of continuum emission in our data. The 30 m map of Pott et al. (2004) has already revealed the existence of two additional maxima in the CO(1–0) emission which are offset by from the nucleus. We find further maxima in the new PdBI mosaic map which are located farther out at (compare Figs. 10 and 14). In Fig. 10 we have labeled the eastern components SE1 and SE2, the western components NW1 and NW2, and the central feature C. There are also indications for further maxima between NW1 and NW2 and also between SE1 and SE2 but they still lack enough sensitivity () in the PdBI-only map to be further substantiated at this point. The brightest line in the spectra turns out to be NW2 and C, whereas the other three features appear to be rather weak with a signal-to-noise ratio at line peak of (Fig. 10). However, NW2 appears to be quite weak in the integrated map which might be traced back to its weak line width of only 50km s-1. The integrated map was produced by averaging the channel maps over a total velocity width of 600km s-1. A comparison between the global fluxes derived from the 30 m and the PdBI data again shows that a large part of the - diffuse, extended - flux (at least of the total flux) must be resolved by the interferometer due to missing short spacings. Adding up all the PdBI spectra leads to a total molecular gas mass of . This is a tenth111Besides the decreased flux measured with the PdBI also the line width is lower by % with respect to the 30m data. of the total molecular gas mass derived from the 30 m spectra of (Pott et al. 2004).
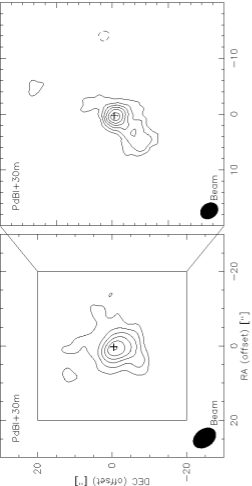
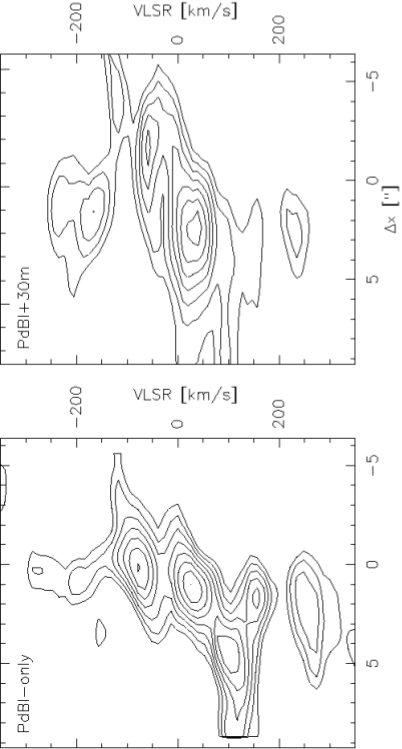
3.4 PdBI+30m data: short spacing correction
To restore missing extended and diffuse emission, we combined the CO(1–0) data from the IRAM 30 m telescope with our interferometric maps. We varied the weights attached to the 30m and PdBI data to find the best compromise between good angular resolution and almost complete restoration of the missing extended flux. In the end, a factor of 4 was applied to the weights of the 30m data, leading to the recovery of % of the missing flux (see below) at a still reasonable angular resolution of 7.84.5′′@20∘. A higher weighting factor would have increased the image restoration to over 90% but at the same time also decreased the resolution to , while a lower weighting factor would have had a higher angular resolution but a worse image restoration due to a lower signal-to-noise ratio. The combined maps of 30m and PdBI data have finally been cleaned using standard program packages provided by the GILDAS software for mosaic data. The results are presented in Fig. 8 & 11 for the single field and mosaic maps. In Fig. 9, we compare the position-velocity diagrams along the axis used in Fig. 7 for the PdBI-only data and the PdBI+30m data. The asymmetry discussed in Section 3.1.2 is still present even if slightly weakened and hence cannot be totally traced back to missing short spacings. This indicates that the asymmetry seems to be an intrinsic property of NGC 3718. A first comparison between the PdBI-only and the PdBI+30 m maps shows in the mosaic maps that the short spacing correction strengthens the inner components (NW1, C and SE1) that appear to contain most of the extended and diffuse emission. If we now derive the total molecular gas mass, we obtain 2.1 , which is 90% of the value found for the 30 m-only data. Besides the five main emission peaks seen in Fig. 10, further emission between NW1 and NW2 and SE1 and SE2, as already indicated in the PdBI-only map (Fig. 10), is substantiated in the PdBI+30m map. Their gas masses are estimated to , respectively. Globally, the western part of the CO(1–0) emission appears to contain more gas ( without C) than the eastern one ( without C). The CO(1–0) emission cannot be associated with a single straight line but rather delineates an “S-like” shape.
The next sections will deal with the modeling of the complex gas distribution in NGC 3718 for a better understanding and a more quantitative interpretation. We will also examine in detail the effects of missing short spacings on our data by applying our procedure to a model and comparing the results thus obtained with the observations.
4 Modeling the CO distribution
The special characteristics of the H I data for NGC 3718 led to the conclusion (Schwarz 1985) that the atomic gas is warped at radii kpc in a configuration similar to that of the dust lane. IRAM 30 m observations of the molecular gas by Pott et al. (2004) showed this warp extending down to smaller radii of kpc. Previous modelling based on the Pott et al. CO and the H I data can hence be fine-tuned with the new information gained from our significantly increased spatial resolution– for our PdBI-only map vs. 21′′ for the Pott et al. (2004) 30 m map.
4.1 The model
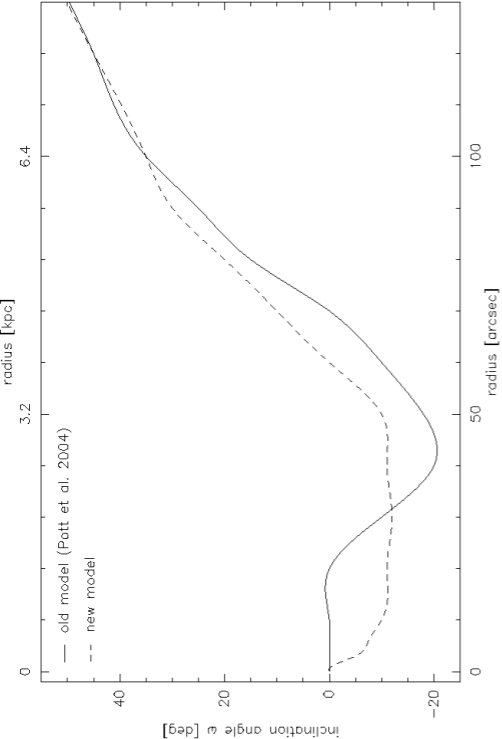
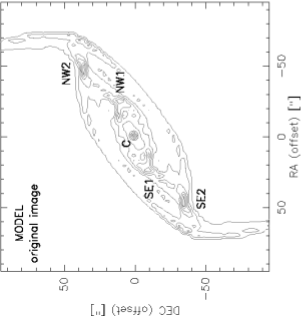
Our simulations of the mosaic maps are based on a tilted ring model similar to that of Pott et al. (2004); that paper presents more modelling details. Since the Pott et al. (2004) model of NGC 3718 reproduces the 30 m observations with only 3 main maxima, we had to modify the parameters to adapt their model to our PdBI results. The revised best-fit parameters were obtained by starting with the model of Pott et al. (2004), propagating it through the PdBI+30m response function (described in section 4.2), comparing the result with the observed data (PdBI+30m), and finally tuning the parameters until the match is optimal. In the new best-fit model, we mainly use different tilt angles (of a given ring relative to the assumed plane of the innermost reference disk) for the inner radii (). Our inner rings are less warped, i.e., the tilt angles are smaller for radii from 40′′ to than in the previous model, but they remain constant down to radii of (i.e., in our model, the warp continues down to a radius of ; see Fig. 12). Furthermore, we use a different intensity profile from Pott et al. (2004). The earlier work assumed an integrated line flux distribution for the rings that is very bright at the center but then decreases rapidly, while the intensities in our model show a slower decrease with radius. We also adopt a different inclination (70∘instead of 60∘) and position angle (-60∘instead of -85∘) for the galactic disc in space. The rotation curve, however, remains the same for the new model. The integrated map of our model is shown in Fig. 13 (the model has not yet been filtered through the interferometer or single dish response function). While the central (C) and the two outer (SE2, NW2) components are quite compact and bright, the two inner features (SE1, NW1) are rather weak and relatively extended on scales.
.
4.2 Simulating the short-spacing correction
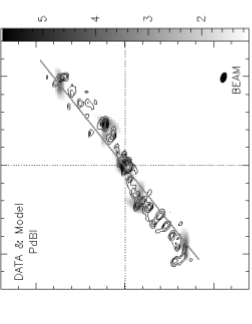
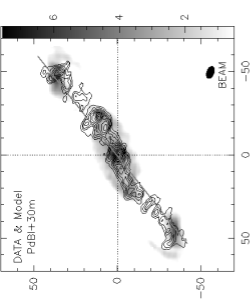
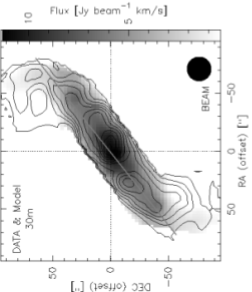
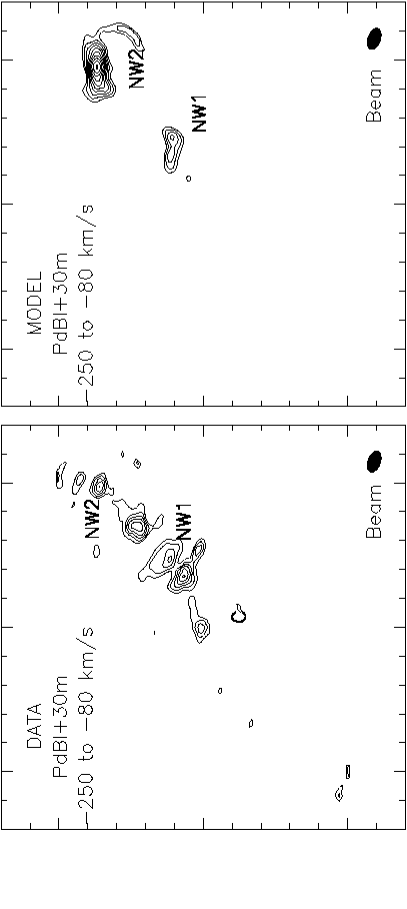
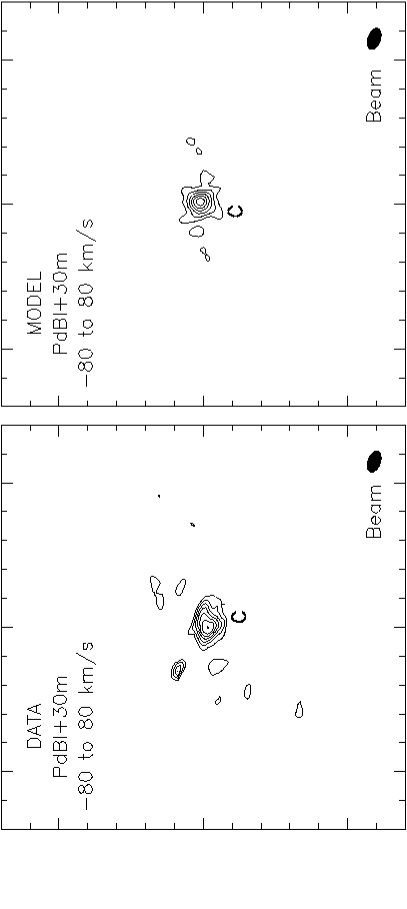
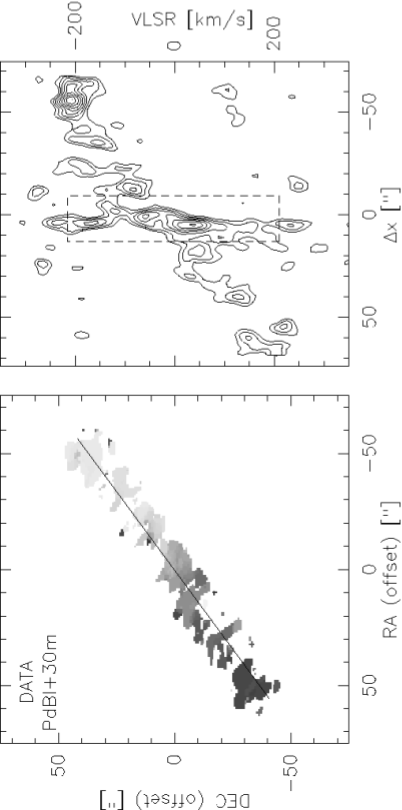
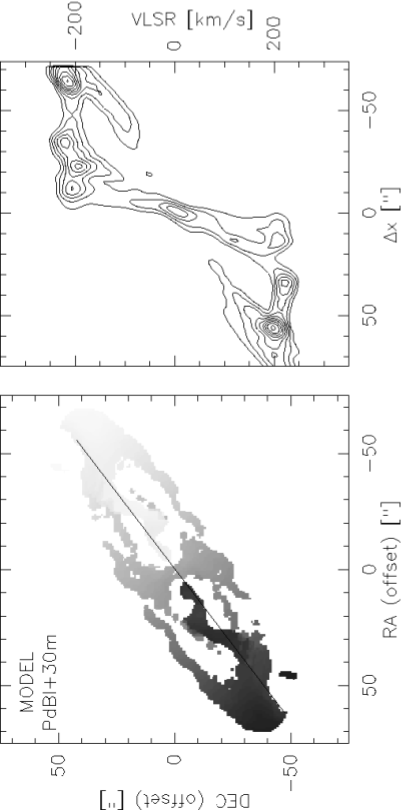
To allow for a direct comparison between the derived model and the CO data (PdBI-only, PdBI+30m, 30m-only), we simulated the effect of the different observations on the model. To determine how our model galaxy would look when observed with the interferometer (before and after short-spacing correction), we first produced the simulated PdBI map with a program that computes an interferometric image (upper panel of Fig. 14) from a given coverage (taken here from the observations) and the given three-dimensional intensity distribution (taken here from our best-fit model shown in Fig. 13). Only the most compact features are visible in the PdBI-only map while the extended emission is resolved, resulting in a loss of around 60% of the original flux. These compact features correspond to the compact orbital crowding points SE1, SE2, NW1 and NW2 ( Fig. 13). The remaining emission from the tilted rings appears to be extended and mainly concentrated around SE1 and NW1. It cannot be seen with the PdBI alone due to spatial filtering, meaning that only the five compact crowding points remain in the PdBI-only map. The extended emission around SE1 and NW1 is thus heavily resolved (compare Fig. 13). The best-fit model was also smoothed to the beam () of the 30 m telescope and the spectra were taken at the same positions as for the observations. Accounting for normalisation, these data were transformed into the 30 m file that would have been produced if such a distribution had been observed with the IRAM 30 m telescope. This file is thus suitable for comparison with the measured 30 m data (see lower panel in Fig. 14). We indeed find only three main maxima, a merging of the inner two (SE1,NW1) with the outer two maxima (SE2,NW2) and an S-line morphology.
As a final test, we combined the simulated 30 m and PdBI maps. All three simulated maps are plotted in Fig. 14 (grey scale). The loss of flux due to the reduced sensitivity to diffuse extended emission in the interferometer-only data is indeed reproduced by the model. A comparison of the simulated peak fluxes from the PdBI, the PdBI+30 m, and the 30 m data with each other suggests that the PdBI has lost a factor of the peak line flux, consistent with what is observed. The short-spacing correction not only reproduces the correct fluxes but also the correct distribution without any artefact or inconsistency in excess of 1% for the model.
4.3 Model vs. Data
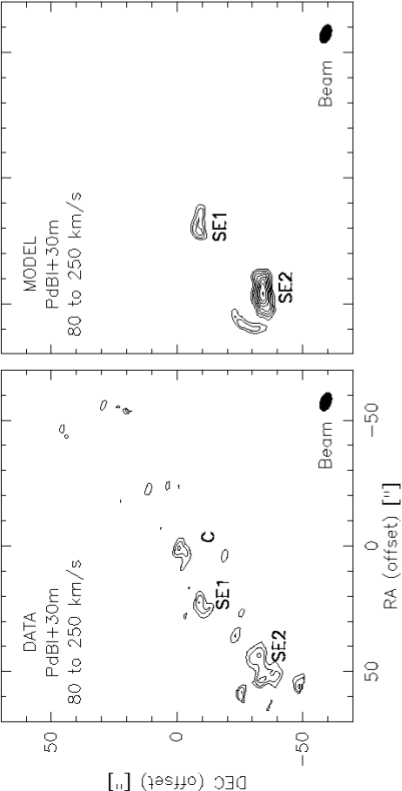
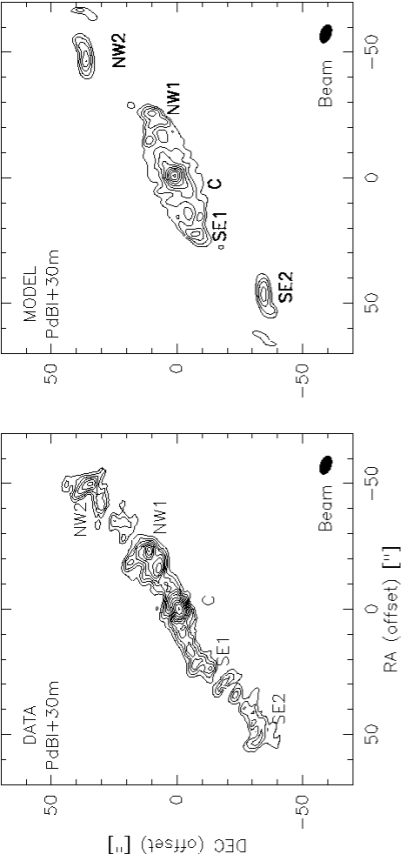
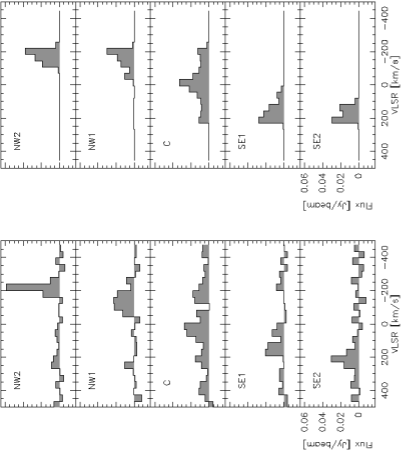
We have carried out the same steps to combine the observed PdBI and 30 m data (section 3.4). The results are plotted in Fig. 14 as contours over the simulated maps. We find a very similar behavior in the observed and model maps. Besides the inner two maxima which are more easily visible, the flux level also increases. Thus, a better distinction between signal and noise is possible. As the two eastern components are less dominant (by a factor 2) than the western components in the integrated map over the whole velocity range, we show separate plots for each component integrated over the appropriate velocity range (see Fig. 15). Such an asymmetry of the gas distribution has already been found in many other galaxies as well (e.g., Richter & Sancisi 1994) and cannot be explained by our symmetric tilted ring model. It might be an indication for a tidal interaction with the companion galaxy which would result in an asymmetric gas distribution. Thus, our warp model could presumably be improved by adding asymmetries to account for the putative interaction.
The maps of the data (left side) and the model (right side) are separately shown in Fig. 16, along with the good agreement between the model and the data in terms of spectra taken at each of the five components. A somewhat weaker eastern component is also visible in the model. This is due to the asymmetric sampling of the 30 m-spectra with respect to the CO centroid. Simulated and observed line widths are consistent within the noise. In Fig. 17, we have derived first order moment maps with a clipping over a velocity range of km s-1to km s-1and taken position-velocity cuts along the major axis of the galaxy for the observed and simulated data. Compared to the pv-diagram of a standard gas disk, a more complex structure is seen in the pv-diagrams of the observations as well as of the simulation due to orbital crowding effects. As might be expected for a rapidly rotating nuclear disk with a size of , a steep linear rise is indicated in the position-velocity diagram. This feature agrees well in orientation and size with the central field velocity component visible in the CO(1–0) map of Fig. 7. We again find that this central feature in the position-velocity map extends only over a range of in Fig. 17, which is smaller than the interval derived by Pott et al. (2004). The difference from the position velocity diagram in Pott et al. (2004) has a logical and simple explanation. In their maps, {SE1, SE2} and {NW1, NW2} merge (in the 30 m beam) into almost single SE and NW features, respectively, and thus all lie on the major axis. In our interferometric map, SE1 and NW1 are no longer aligned with this major axis and thus appear only weakly in the position-velocity diagram of Fig. 17. The high velocity gas returns if the major axis is rotated by about 10∘. We thus have three different velocity regimes. The first ranges from with km s-1and can be identified with the gas occupying the inner rings. The second region extends to with km s-1and is caused by intermediate rings. The third extends to with km s-1and originates from the outer rings.
5 Discussion & Conclusions
The paper presents an analysis based on arcsec angular resolution PdBI observations of the gas distribution in NGC 3718, complementing previous studies conducted by Pott et al. (2004: CO on scales) and Schwarz (1985: H I on scales). After making a short-spacing correction using the IRAM 30 m data (Pott et al. 2004), we have modelled and interpreted the mosaic observations of the total emission as well as single field observations of the central kpc. Three compact and three extended components were found in the mosaic map of the CO(1–0) emission. At the higher angular resolution of the PdBI, the gas structure turns out to be more complex than previously appreciated. To explain the detected molecular gas distribution, we were forced to modify the Pott et al. tilted ring model slightly. The revised model now not only reproduces well the PdBI+30 m observations, but due to the higher resolution of the observations, also places much tighter constraints on the warp. The disk is most likely already warped on arcsec scales ( pc) and is evident within a radius of 20′′ (the S-like shape between SE1, C, and NW1) even if the warp is less dominant within 50′′ relative to the original Pott et al. model. The five symmetric CO(1–0) peaks (SE2, SE1, C, NW1, and NW2) detected by the PdBI can be explained by orbit crowding effects. The two outer maxima merge into one feature on each side of the center in the beam of the IRAM 30 m telescope and thus at this resolution appear as single components. Besides the gas distribution, the gas kinematics can be almost completely explained by the model. The position-velocity diagrams of both data sets - mosaic and central pointing - unveil rapidly rotating nuclear gas within a radius of pc, as seen in the simulated data. The high velocities in the center are produced by the inner warped rings. Thus, the dynamics of the molecular gas can be traced back to a continuous warped disk with concentric orbits.
As in Pott et al. (2004), our model does not require a bar to explain the observed gas properties down to pc. However a warp alone is not sufficient to account for all data, it must be combined with asymmetry in gas density between the eastern and western side. This asymmetry is logically coming from the same mechanism producing the warp: i.e. an interaction with the companion galaxy. The asymmetric gas distribution within the central 250 pc provides the possibility for an accretion of gas onto the central engine. However, the transport of gas to the black hole still raises many questions and problems. Even in the Milky Way, where a warped circumnuclear molecular torus (Guesten et al. 1987) provides a reservoir for accretion at a distance of only from the nucleus, the situation is not yet understood. In this context, the mechanisms of gas fueling to the inner few pc/subpc in active nuclei appear even more complex. Besides the comprehension of our own Galactic center, only detailed studies of further nuclei with the highest angular resolution can provide answers to the wealth of open questions.
Acknowledgements.
The research presented in this paper has been financially supported in part by the SFB 494. Stephane Leon is partially supported by DGI Grant AYA 2002-03338 and Junta de Andalucía. We thank the IRAM staff from the Plateau de Bure and Grenoble for conducting the observations and helping with the data reduction. We are grateful to the referee Dr. Michel Guelin for his useful comments.References
- (1) Barth, A. J., Ho, L. C., Filippenko, A. V., Sargent, W. L. W. 1998, ApJ 496, 133
- (2) Becker, R.H., White, R.L., Helfand, D.J., 1995, ApJ, 450, 559
- (3) Burke, B. F., Miley, G. K. 1973, A&A 28, 379
- (4) Combes, F. 1988, in Galactic and Extragalactic Star Formation, ed. Pdritz & Fich (Dordrecht: Kluwer), 475
- (5) Combes, F., García-Burillo, S., Boone, F. et al. 2004, A&A 414, 857
- (6) Downes, D., Solomon, P.M. & Radford, S.J.E. 1993, ApJ 414, L13-L16
- (7) Duschl, W.J., Strittmatter, P.A. & Biermann, P.L. 2000, A&A 357, 1123
- (8) Falcke, H., ApJ 464, L67
- (9) Falcke, H. & Markoff, S. 2000, A&A 362, 113
- (10) Falcke, H., Lehar, J., Barvainis, R., Nagar, N.M. & Wilson, A.S. 2001, in ASP Conf. Ser. 224, Probing the Physics of Active Galactic Nuclei by Multiwavelength Monitoring, ed. B.M. Peterson, R.S., Polidan & R.W. Pogge (San Francisco: ASP), 265
- (11) Filippenko, A.V., Sargent, W.L.W. 1985, ApJS 57, 503
- (12) García-Burillo, S., Sempere, M.J., Combes, F., Hunt, L.K., Neri, R. 2000 A&A 363, 869
- (13) García-Burillo, S., Combes, F., Eckart, A., et al. 2003a, in Active Galactic Nuclei: From Central Engine to Host Galaxy, ed. S. Collin, F.Combes & I.Shlohsman, ASP Conf.Ser. 290, 423
- (14) García-Burillo, S., Combes, F., Hunt, L.K., Boone, F. et al. 2003b, A&A 407, 485
- (15) Guesten, R., Genzel, R., Wright, M. C. H., Jaffe, D. T., Stutzki, J., Harris, A. I. 1987, ApJ 318, 124
- (16) Guilloteau, S., Delannoy, J., Downes, D., et al. 1992, A&A 262, 624
- (17) Guilloteay, S. & Lucas, R. 2000, in Imaging at Radio Through Submillimeter Wavelengths, ed. J. G. Mangum & S. J. E. Radford (San Francisco: ASP), 299
- (18) Hartwich, M., Eckart, A., Leon, S. 2002, AGM 18, P136
- (19) Heckmann, T.M., Smith, E.P., Baum, S.A., van Breugel, W.J.M., Miley, G.K. et al. 1986, ApJ 311, 526
- (20) Keene, J., Stern, D., Lawrence, C., Eisenhardt, P., Gorjian, V., Stapelfeldt, K., Werner, M., Charmandaris, V. 2004,AAS, 204, 4122 (see also: http://www.spitzer.caltech.edu/Media/releases/ssc2004-09/release.shtml)
- (21) Kormendy, , J. & Bender, R. 1999, ApJ 522, 772
- (22) Krips, M., Pott, J.-U., Eckart, A., Leon, S., Neri, R., Straubmeier, C. 2003, Ap&SS 284, 511 P.L. 2001, A&A 379, L13
- (23) Martini, P. & Pogge, R.W. 1999, AJ 118, 2646
- (24) Nagar, N.M., Falcke, H., Wilson, A.S. & Ho, L.C. 2000, ApJ 542, 186
- (25) Nagar, N.M., Wilson, A.S. & Falcke, H. 2001, ApJ 559, L87
- (26) Nagar, N. M., Falcke, H., Wilson, A. S., Ulvestad, J. S. 2002, A&A, 392, 53
- (27) Narayan, R., Mahadevan, R. & Quataert, E. 1998, in Theory of Blach Hole Accretion Disks, ed. M.A. Abramowicz, G. Björnsson & J.E. Pringle (Cambridge: Cambridge Univ. press.), 148
- (28) Pott, J.-U., Hartwich, M., Eckart A., Leon. S., Krips, M., Straubmeier, Ch. 2004, A&A 415, 27
- (29) Quataert, E. 2001, in ASP Conf. Ser. 224, Probing the Physics of Active Galactic Nuclei by Multiwavelength Monitoring, ed. B.M. Peterson, R.S., Polidan & R.W. Pogge (San Francisco: ASP), 71
- (30) Richter, O.-G., Sancisi, R. 1994, A&A 290, L9
- (31) Schinnerer, E., Eckart, A. & Tacconi, L.J. 2000a, ApJ 533, 826
- (32) Schinnerer, E., Eckart, A., Tacconi, L.J., Genzel, R. & Downes, D. 2000b, ApJ 533, 850
- (33) Schwarz, U.J. 1985, A&A 142, 273 M.C. 1989 Natur 338 45
- (34) Slee, O.B., Sadler, E.M., Reynolds, J.E. & Ekers, R.D. 1994, MNRAS, 269, 928
- (35) Wild, W., Eckart, A. 2000, A&A 359, 483
- (36) Wrobel, J.M. & Heeschen, D. 1991, AJ, 101, 148