GALEX Observations of an Energetic Ultraviolet Flare on the dM4e Star GJ 3685A
Abstract
The Galaxy Evolution Explorer () satellite has obtained high time resolution ultraviolet photometry during a large flare on the M4 dwarf star GJ 3685A. Simultaneous NUV (1750 - 2800 Å) and FUV (1350 - 1750 Å) time-tagged photometry with time resolution better than 0.1 s shows that the overall brightness in the FUV band increased by a factor of 1000 in 200 s. Under the assumption that the NUV emission is mostly due to a stellar continuum, and that the FUV flux is shared equally between emission lines and continuum, then there is evidence for two distinct flare components for this event. The first flare type is characterized by an exponential increase in flux with little or no increase in temperature. The other involves rapid increases in both temperature and flux. While the decay time for the first flare component may be several hours, the second flare event decayed over less than 1 minute, suggesting that there was little or no confinement of the heated plasma.
Subject headings:
stars: flare — stars: late-type — stars: individual (GJ 3685A) — stars: variables: other (UV Ceti) — ultraviolet: stars1. Introduction
UV Ceti stars exhibit many of the activity phenomena observed on the Sun, such as flares, dark spots and variable emission from the chromosphere and corona (Thomas & Weiss, 2004). Such surface activity is linked to their magnetic field strength and surface coverage, which can be several times larger than that found on the Sun. When quiescent, UV Ceti flare stars are low luminosity (), low temperature (T = 2500 - 4000 K) M-type dwarfs. During outbursts, these stars brighten dramatically over timescales of a few seconds to hours at all wavelengths from X-ray to radio (Haisch, Strong, & Rodono, 1991).
The vast majority of stellar flare observations involve photometric monitoring using the Johnson UBV filters (Lacy et al., 1976). Normally this involves high speed sampling using a single transmission filter. Occasionally, however, observations are obtained in multiple filters by sequencing using time steps of a few seconds to about 1 minute. This technique has the advantage of obtaining flare colors, allowing estimates of temperatures and sizes, and is reasonably valid during the long duration decay phase of the events. However, during the impulsive phase the fluxes can change on time scales of seconds, so the color data becomes highly uncertain. A second limitation is that the flare energy distribution peaks at wavelengths shorter than 4000Å (van den Oord et al., 1996), so that the Johnson photometry only samples the wing of this distribution, which is contaminated by the stellar photosphere.
The GALEX satellite (Martin et al., 2005) provides the opportunity for obtaining vastly improved photometric measurements of stellar flares. Using a dichroic beam splitter and two photon counting detectors, this telescope is able to simultaneously monitor a 1.25o field of view in the FUV (1350 - 1750 Å) and NUV (1750 - 2800Å) regions with 5 arcsec and 6.5 arcsec angular resolution respectively. This allows the accurate determination of UV fluxes and colors at a time resolution which is limited only by the count rate and the required S/N values. In this paper we describe a serendipitous observation of a large flare seen by the GALEX telescope on the dM4e star GJ 3685A. Some of the physical properties of this event are discussed and we develop a schematic model which is compared with models developed from other flare observations.
2. Observations and Data Reduction
The flare event on GJ 3685A was detected on 2004 April 20 during a simultaneous FUV and NUV observation of the Medium Imaging Survey (MIS) field MISDR1_13062_0283. The exposure began at 19:42:06 UT and lasted for 1244s. At present, the standard Data Analysis Pipeline is only designed to produce a calibrated image of the field and thus does not retain timing information. To construct a photometric time sequence, we began with the original time-tagged photon lists and integrated all photons within a 1.8 arcmin aperture centered on the source. The background count rate was measured within an annulus extending from 1.8 to 2.4 arcmin around the star, during the first 500 s of the observation, in order to avoid contamination by scattered light when the flare was at its brightest. The FUV and NUV background rates are cts s-1 and 38.5 cts s-1, respectively.
The GALEX microchannel plate detectors exhibit a local non-linearity of 10% affecting point sources with input count rates of 90 cts s-1 in FUV and 470 cts s-1 in NUV (Morrissey et al., 2005). In this paper, we use Morrissey’s published local non-linearity corrections, which have been calibrated with white dwarf standard stars up to 3300 cts s-1 in FUV and 8400 cts s-1 in NUV. The GJ 3685A flare exceeded this calibrated range in the FUV for a few seconds during the brightest parts of the flare: we have omitted these data from the analysis because the uncertainty in the true count rate is unknown in this high count-rate regime.
The results of the analysis are given in Figure 1, which shows both the flux variations and the ratio of the FUV to NUV fluxes. In these plots the photon count rates have been converted to fluxes (in erg cm-2 s-1 Å-1) using the conversion factors of and for the FUV and NUV, respectively (Morrissey et al., 2005). Initially, the star showed a ‘quiescent’ flux of erg cm-2 s-1 Å-1 and a flux ratio (or color) of 1. The start of the stellar flare is lost in the noise of the background. A reasonable estimate seems to put the start somewhere between 450 and 500 s and it is definitely underway in both the NUV and FUV bands by 500 s. Between 500 s and 630 s the flux in both bands increases exponentially, with an e-folding time of 60 s. During this time the average color remains constant, at a value of near 0.8.
At 650 s the rate of flux increase jumps dramatically, with e-folding times of 23 s in the NUV and 12 s in the FUV, and the FUV/NUV ratio increases from to more than 6. Both temperature and FUV/NUV ratio reach a peak at 700 s. During this peak period, we have omitted the data because the FUV non-linearity correction is uncertain.
After the peak, which only lasts for about 20 s, the flux and FUV/NUV ratio rapidly decrease. Note that the time variations of both the color and the flux for the 100 s centered at the flare peak are symmetrical about the peak, i.e. the rise times and decay times are about the same. By 750 s the color ratio is again near 1 and the flux settles into a slow decline which is interrupted at 865 s by a second flux enhancement. This second enhancement is somewhat more complicated than the first, but follows the same basic trend of rapid flux increase accompanied by a rapid increase in FUV/NUV, this time to values in excess of 10. The decay phase for the second enhancement is slower and more complex than was the case for the first enhancement. By the end of the observation the flux and color had returned to the levels seen prior to the second enhancement, though the flux is still well above the ‘quiescent’ level.
3. Analysis
3.1. Pre-flare Activity
On 2004 March 2 GALEX obtained a 110 sec ‘quiescent’ observation of GJ 3685A which showed a flux of erg cm-2 s-1 Å-1 in the FUV and erg cm-2 s-1 Å-1 in the NUV, giving a color ratio of . On 20 April, before the onset of the flare event the average ‘quiescent’ flux was erg cm-2 s-1 Å-1 in the NUV and erg cm-2 s-1 Å-1 in the FUV band, resulting in a flux ratio of 1. Since the FUV/NUV flux ratio is directly related to the effective emission temperature (see section 3.2) we see that preceding the flare the stellar emission had not only increased in flux by a factor of 5 in the NUV, but also increased in temperature.
One possible explanation is that the pre-flare enhancement results from an increased level of microflaring activity. To test this notion, we performed an analysis on the first 400 s of the data set using the binning technique described by Robinson et al. (1995, 1999). Individual microflares can be detected by binning the time sequence and searching for times when the counts per bin are significantly higher than those expected from random chance. The maximum visibility occurs when the binning factor is near the lifetime of the event.
A distribution of small events which are not individually time resolvable can be determined by comparing the distribution of count rates with a reference distribution from a non-variable source, as described in Robinson (1999). This method reveals that when the binning factor is much smaller than the flare lifetime, then event noise will dominate and both distributions will be Poisson. However, as the binning factor approaches the flare lifetime, the microflares show up as an enhancement of the high count rate tail of the distribution.
Examining the time sequences for binning factors ranging from 1 s to 20 s for the GJ 3685A flare data shows no strong evidence for either individual or unresolved flare events, while a regression analysis showed that the level of activity remained statistically constant prior to flare onset. A problem, however, is that the background levels are large compared to the stellar signal. For example, in the NUV the estimated background is 38.5 counts s-1, while the stellar signal was only 7.5 counts s-1. Thus, noise from the background would swamp all but the largest microflare events.
3.2. Empirical Modeling
Since we have no spectroscopic information about this flare it is not possible to perform any type of detailed modeling or radiative transfer calculations on these UV data. However, some good qualitative and semi-quantitative insights can be obtained by assuming black-body emission. The reader should be aware that this assumed model is only one of several possible flare model scenarios. However, this simple theoretical approach has been widely used in the interpretation of optical photometry of flare events and yielded some important insights into flare phenomena (Kahler et al., 1982; van den Oord et al., 1996; Hawley et al., 2003). We have a definite advantage in these UV observations since the photospheric emission from the star is so small that it can be neglected.
The first step in our simplified analysis is to determine the relation between the black body temperature and the measured FUV/NUV flux ratio. We have calculated the black body spectrum for a number of different temperatures, multiplied by the effective area curves for the GALEX FUV and NUV filters and then divided by the total effective area for each filter. This gives the expected flux for a black body, which can be directly related to the average flux deduced from the measured count rates. The relation between temperature and flux ratio is shown in Figure 2. Note that the flux ratio increases dramatically between 4000 and 19000 K (when the peak of the black body distribution falls within the FUV bandpass) and then increases much more slowly toward high temperatures. The ratio eventually reaches a value of just over 3 at temperatures of 50,000 K. This immediately shows that our black-body assumption is not totally valid, since we measured ratios during the flare peaks in excess of 6. This is not a surprise, since the FUV wavelength region has numerous strong emission lines (e.g. C II, C IV, Si II, Si IV, etc) which can dominate the continuum, especially during ‘quiescent’ periods outside of major flare events (van den Oord et al., 1996).
Assessing the relative contributions from continuum and/or emission lines at near UV wavelengths is still an open problem for flare research (Hawley & Fisher, 1992). We note that the GALEX NUV channel is not significantly contaminated by the (expected) strong MgII emission lines at 2800Å due to the low transmission of the GALEX NUV instrument at this wavelength. However, previous flares have shown an (albeit far less) increase in the NUV emission from the FeII line multiplet at 2600Å (Haisch et al., 1987), whereas Butler et al. (1981) have observed a significant rise in the near UV continuum during a flare on the star Gl 867A. For the present case of the flare on GJ 3685A, it is difficult to imagine how line emission could be the sole major contributor to the more than 5 UV magnitude increase in NUV flux observed during the flare. Thus, in determining the effective temperature from the FUV/NUV flux ratio, we arbitrarily assume that approximately half of the FUV flux was from emission lines and the other half from black-body emission. This is consistent with the time-resolved spectroscopy of Hawley et al. (2003), where the FUV line-to-continuum flux ratio is 0.8, during the brightest flare on AD Leo reported in that paper. Furthermore, Hawley & Fisher (1992) also provide support for the notion that the GALEX NUV band is dominated by the star’s continuum.
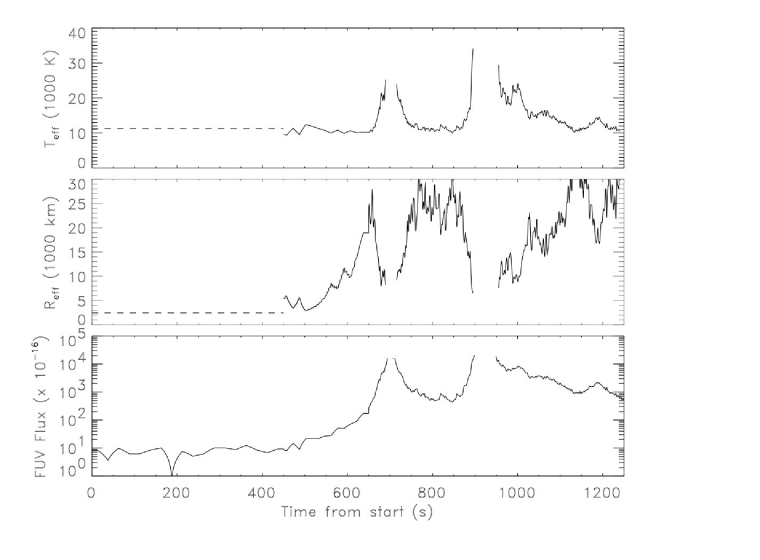
A black body of given temperature has a well defined emission. Thus, having determined a temperature we can define the effective stellar surface coverage required to produce the observed NUV flux at the earth, assuming a distance to the star of 14.6 pc (Astronomisches Rechen-Institut, 1998). The results of the calculations are presented in Figure 3, where we have converted the flare surface area to an effective source radius. The calculated temperature in the pre-flare phase was about 12,000 K with a deduced scale of about 3500 km. The exact values are uncertain because this phase is dominated by the emission lines in the FUV and the actual structure is most likely composed of small elements spread over a large area. When the flare starts the effective temperature drops to about 10,000 K and the radius increases linearly from 3,500 km at 500 s to about 25,000 km at 650 s, suggesting an initial expansion velocity of at least 140 km s-1. The deduced temperature increases dramatically at 660 s, becomes undefined near the flare peak and then rapidly decreases back to a value of about 10,000 K. During this time the deduced radius decreases to 7,000 km and then increases back to 25,000-28,000 km, about the same value as that seen before the large temperature increase. The temperature and area then remain relatively constant until the start of the second temperature enhancement at 880 s, where the area again dramatically decreases and then slowly recovers to a value of about 32,000 km.
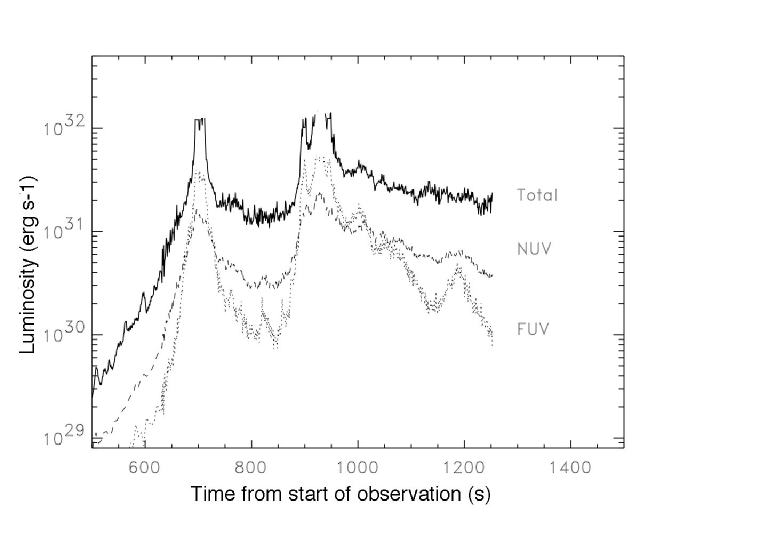
Having estimated a temperature and area for the flare it is possible to determine the total optical and UV energy by integrating under the appropriate black body curve. The result of this calculation is shown in the Figure 4. The overall appearance of this event is two short duration bursts at 670-730 s and 880-970 s superimposed on a more slowly varying event which started at 450 s and which was slowly decaying at the end of the observation. The flare is obviously very energetic, with luminosities reaching more than erg s-1 and a total integrated energy in excess of erg. This is comparable to the largest recorded M-dwarf flare outbursts, such as the 1985 flare on the star AD Leonis (Hawley & Petterson, 1991). Another way to put this into perspective is to note that the total (optical plus UV) luminosity emitted from the photosphere of a M4 star is on the order of erg s-1. Thus, at the peak the flare would outshine the star by more than a factor of 10.
4. Discussion
Assuming that our black body emission model discussed in Section 3.2 provides a reasonable description of the flare event on GJ 3685A (and given the caveat that there may be other models that can provide an alternate interpretation of the data that we have chosen not to explore due to the lack of spectroscopic information on this flare), we can now postulate a schematic model for the event which satisfies all of the observations and is consistent with observations of flares seen on other stars. The flare itself appears to be composed of two distinct types of events, which we will refer to as type A and type B. The flare begins with a type A event, which is characterized by a FUV/NUV flux ratio that is nearly the same as that seen in the pre-flare activity (plage) and remains constant as the flux increases. We conclude that the spectrum has a very plage-like appearance and that the source structure, and possibly the heating processes, are also very plage-like. We postulate that this phase was initiated by a magnetic reconnection somewhere within a highly stressed active region. This initial energy release triggers reconnection events in adjacent magnetic structures, leading to an avalanche (Lu & Hamilton, 1991; Carbonneau et al., 2001) which propagates throughout the region at a velocity of at least 140 km s-1, which probably represents the local Alfven velocity. The increase in flux is then simply the result of expanding area coverage.
At about 670 s (roughly 3 minutes after the start of the flare) the disturbance which is responsible for flare A intersects a highly unstable magnetic structure and triggers an explosive release of energy, resulting in the first type B flare (B1), which occurs between 670 s and about 730 s. The rapid increase in temperature and flux is compatible with a chromospheric evaporation model (Haisch, Strong, & Rodono, 1991), in which a large amount of energy (probably in the form of energetic particles) is suddenly released near the top of a magnetic loop complex and propagates down towards the photosphere. When it strikes the denser atmospheric layers it impulsively heats the material, which then expands back into the loop. Normally, this type of event will have a long lasting decay as the heated material cools through conduction and radiation. In this case, however, the short duration of the decay suggests that the energy release was sufficient to cause a disruption of the confining loops (Reale, Bocchino, & Peres, 2002). The source size for flare B1 is also significantly smaller than that of flare A, since the deduced flare area decreases rapidly when the emission from B1 dominates that from flare A.
The structure responsible for flare B1 is probably near the edge of the active region associated with flare A, since the expansion of flare A ends during flare B1. Apparently, all of the available structures which can support flare A emission have been activated by that time. It is possible that the disturbance responsible for flare A could continue into regions outside of the initial active region. More likely, the energy release initiating flare B1 also generated an Alfvenic shock, similar to the Morton waves seen on the Sun (Athay & Morton, 1961). This disturbance propagates to an unstable magnetic structure in a nearby active region and triggers a second B type flare (flare B2) which starts at around 880 s. This flare is both stronger and more complex than B1, indicating more complex field configuration. It also shows a better developed thermal decay, implying that at least some of the hot plasma is confined in the loops. Note also that this is an isolated event, without an accompanying type A event, since there was no increase in source size prior to the onset of the temperature enhancement.
By the end of the observation it appears that flare B2 has completely faded and flare A is again visible. Unfortunately, we do not have much information about the decay phase of flare A. However, from the fact that the integrated flux at the end of the observation at 1250 s is very similar to that at 800 s, after the decay of flare B1, suggests that it may take an hour or more for flare A to decay to pre-flare levels.
5. Conclusions
We report on a large flare from the dM4e star GJ 3685A which was simultaneously observed in the NUV and FUV by the GALEX satellite. Under the assumption of a blackbody emission model in which half of the FUV flux arises from line emission and half from continuum, and that the NUV flux arises solely from an increase in the continuum, there is strong evidence for two distinct classes of flares during this event. The first (type A) is characterized by an exponential increase in flux with little of no change in emission temperature, as measured from the FUV/NUV flux ratio. This behavior is compatible with an avalanche model. The fact that the flux ratio during this phase was very similar to that seen in the pre-flare plage emission also supports the idea that plages are heated by microflares, as first proposed by (Parker, 1988).
The second class (type B) is characterized by an impulsive increase in both flux and temperature. This class is consistent with a classical explosive event and may be related to the solar two ribbon flare. Two flares of this type were seen during the event. The first (flare B1) probably originated in the same active region as the type A flare. The lack of a well developed decay phase suggests that the confining magnetic structure was disrupted. The second flare (B2) may have originated outside of that region, being triggered by a disturbance formed during the flare B1 energy release.
The 2004 April 20 flare began when GJ 3685A was already in a state of enhanced activity in which both the flux and temperature are substantially higher than in a previous GALEX observation on 2004 March 2. It is unclear whether this enhancement is the result of coronal variations, or arises from the rotation of an intense active region onto the visible surface of the star, or if it comes from some pre-flare energy release. In order to obtain better models of future dMe star flare events we recommend using the low-resolution spectroscopic grism mode of GALEX, instead of the imaging photometric mode. Such future observations would provide better insights into the relative contributions from the UV continuum and/or line emission during these large releases of stellar energy.
References
- Astronomisches Rechen-Institut (1998) Astronomisches Rechen-Institut 1998, ARI Database for Nearby Stars. http://www.ari.uni-heidelberg.de/aricns
- Athay & Morton (1961) Athay, R.G., & Morton, G.E. 1961, 133, 935
- Butler et al. (1981) Butler, C.J., et al. 1981, MNRAS, 197, 815
- Carbonneau et al. (2001) Carbonneau, P., McIntosh, S.W., Liu, H-L, & Bogdan, T.J. 2001, Solar Physics, 203, 321
- Gliese & Jahreiss (1991) Gliese, W., & Jahreiss, H. 1991, Preliminary Version of the Third Catalogue of Nearby Stars. Greenbelt, MD: Goddard Space Flight Center
- Haisch et al. (1987) Haisch, B., et al. 1987, A&A, 181, 96
- Haisch, Strong, & Rodono (1991) Haisch, B., Strong, K., & Rodono, M. 1991, ARA&A, 29, 275
- Hawley & Fisher (1992) Hawley, S.L., & Fisher, G.H. 1992, ApJS, 78, 565
- Hawley & Petterson (1991) Hawley, S.L., & Petterson, B.R. 1991, ApJ, 378, 725
- Hawley et al. (2003) Hawley, S.L., et al. 2003, ApJ, 597, 535
- Kahler et al. (1982) Kahler, S., et al., ApJ, 252, 239
- Lacy et al. (1976) Lacy, C.H., Moffett, T.J., & Evans, D.S. 1976, ApJS, 30, 85
- Lu & Hamilton (1991) Lu, E.T., & Hamilton, R. 1991, ApJ, 380, L89
- Martin et al. (2005) Martin, D.C., et al. 2005, ApJ, 619, L1
- Morrissey et al. (2005) Morrissey, P., et al. 2005, ApJ, 619, L7
- Nakajima et al. (1986) Nakajima, H., Dennis, B.R., Hoyng, P., Nelson, G., Kosugi, T., & Kai, K. 1986, ApJ, 288, 806
- Parker (1988) Parker, E.N. 1988, ApJ, 330, 474
- Reale, Bocchino, & Peres (2002) Reale, E., Bocchino, F., & Peres, G. 2002, A&A,383, 952
- Robinson et al. (1995) Robinson, R.D., Carpenter, K.G., Percival, J.W., & Bookbinder, J.A. 1995, ApJ, 451, 795
- Robinson et al. (1999) Robinson, R.D., Carpenter, K.G., & Percival, J.W., 1999, ApJ, 516, 916
- Thomas & Weiss (2004) Thomas, J.H., & Weiss, N.O. 2004, ARA&A, 42, 517
- van den Oord et al. (1996) van den Oord, G.H.J., et al. 1996, A&A, 310, 908