The Importance of Interactions for Mass Loss from Satellite Galaxies in Cold Dark Matter Haloes
Abstract
We investigate the importance of interactions between dark matter substructures for the mass loss they suffer whilst orbiting within a sample of high resolution galaxy cluster mass Cold Dark Matter haloes formed in cosmological N-body simulations. We have defined a quantitative measure that gauges the degree to which interactions are responsible for mass loss from substructures. This measure indicates that interactions are more prominent in younger systems when compared to older more relaxed systems. We show that this is due to the increased number of encounters a satellite experiences and a higher mass fraction in satellites. This is in spite of the uniformity in the distributions of relative distances and velocities of encounters between substructures within the different host systems in our sample.
Using a simple model to relate the net force felt by a single satellite to the mass loss it suffers, we show that interactions with other satellites account for of the total mass loss experienced over its lifetime. The relation between the age of the host and the importance of interactions increases the scatter about this mean value from for the oldest to for the youngest system we have studied. We conclude that satellite interactions play a vital role in the evolution of substructure in dark matter halos and that a significant fraction of the tidally stripped material can be attributed to these interactions.
keywords:
galaxies: clusters – galaxies: formation – galaxies: evolution – n-body simulations1 Introduction
It has been understood for some time that the structure of a galaxy can be affected by tidal interactions with its close neighbour(s) (e.g. Toomre & Toomre, 1972); tell-tale signs such as tidal tails and disturbed morphologies provide a visible record of these encounters. Around our own Galaxy, there is substantial evidence for its tidal interaction with the Small and Large Magellanic Clouds (SMC and LMC), the consequences of which have been studied in detail (e.g. Lin et al., 1995; Oh et al., 1995; Gardiner & Noguchi, 1996; Yoshizawa & Noguchi, 2003; Bekki & Chiba, 2005; Mastropietro et al., 2005; Connors et al., 2005), Furthermore, an increasing number of studies have uncovered evidence for tidal stripping – in the form of stellar streams – in the Galactic halo (e.g. Helmi, 2004; Ibata et al., 2003); these streams represent material that has been stripped from infalling satellites as they are disrupted by our Galaxy. The detection of such streams will become more commonplace in the coming years as the sensitivity of surveys improve (e.g. Odenkirchen et al., 2003; Navarro et al., 2004), but there are already examples of stellar streams further afield, such as around M31 (Ibata et al., 2004). Moreover, Mihos et al. (2005) recently reported the discovery of intracluster light in the Virgo cluster, revealing several long (100 kpc) tidal streamers.
These results represent compelling evidence that satellite galaxies tidally
interact with their more massive hosts, and consequently lose some fraction of
their mass. The effect of a satellite’s interaction with its host and the
mass loss it suffers has been studied in some detail (e.g. Hayashi et al., 2003),
and it can be argued that it is relatively well understood. In comparison,
the importance of a satellite galaxy’s interactions with other satellite
galaxies, the nature of these interactions and the contribution they make
to its mass loss is less well understood. There is evidence to suggest
that tidal interactions between satellite galaxies occur; Zhao (1998)
and Ibata & Lewis (1998) investigated whether the Sagittarius Dwarf galaxy could
have experienced an encounter with the SMC and LMC some 2–3 Gyrs ago, while
the disturbed HI distribution noted by Yun et al. (1994) in the M81 group is
highly suggestive of tidal interactions between the group galaxies.
Goto (2005) argues that tidal interaction between galaxies is the dominant
mechanism driving cluster galaxy evolution and underpins the Butcher-Oemler
effect and the morphology-density relation.
It has been understood for some time that dark matter haloes must play an important dynamical role in encounters between galaxies because they significantly reduce the merging timescale (Barnes, 1988). Examples of tidal interaction and merging are observed in relatively low-density environments (i.e. the field), but how reasonable is it to expect that interactions should be more common in higher density environments such as galaxy groups and clusters? Tidal interactions have been proposed as a mechanism for galaxy transformation in galaxy clusters, such as the “harassment” scenario envisaged by Moore et al. (1998), but what does the favoured paradigm for cosmological structure formation, the Cold Dark Matter model, predict?
The aim of this paper is to quantify the importance of satellite-satellite encounters and to assess their impact upon the transformation and mass loss of the substructure population within the context of the Cold Dark Matter (CDM) model. We have drawn on a sample of high resolution cosmological N-Body simulations of cluster mass dark matter haloes and analysed the interactions of the substructure haloes (hereafter subhaloes) both with the host halo and with other subhaloes. We associate these subhaloes with the hosts of satellite galaxies (but see Gao et al., 2004) and in what follows we use the terms subhalo and satellite (galaxy) interchangeably. The fine time sampling of our simulations allow us to follow the time evolution of subhalo properties in detail, and so we can determine the relative contributions of the host and the other subhaloes to changes in a subhalo’s structure.
In a previous study (Knebe et al., 2004) we quantified the frequency of encounters between subhaloes orbiting within a common CDM cluster mass halo, considering the period between the halo’s formation redshift222We defined this to be the redshift at which the mass of the most massive progenitor was half the system’s present day mass; this was typically for the haloes we examined. and the present day. We found that, on average, of the “satellite galaxy” population experienced at least one encounter per orbit with another satellite galaxy. This result was sensitive to the age of the host halo, with a clear trend for more encounters in younger systems. We also reported a correlation between the number of encounters and halocentric radius – satellite galaxies closer to the centre of the host were measured to experience more interactions, although we note that this simply reflects the increasing spatial density of satellites with decreasing radius within a host halo.
The principal shortcoming of the approach adopted in Knebe et al. (2004) is that we neglected the relative velocities of the satellite galaxies; our satellites may have experienced encounters, but we had no information about their specific nature, i.e. were they fast or slow? Such information is important when considering the impact on the satellite’s structure. In this present study, we elaborate on that work by including information about the relative velocities of the satellites. In other words, we can now estimate the importance of encounters in addition to the frequency with which they occur, allowing us to differentiate between slow encounters, which we expect to be extremely disruptive to the satellite structure, and fast encounters, whose impact are likely to be minimal. We define a quantitative measure for interactions, which we call the integral interaction measure, based upon the force acting on a satellite over a given period of time, i.e. the (induced) momentum change. Whereas before we could examine the number of encounters a satellite galaxy experienced per orbit, we may now study how the instantaneous force due to encounters acting on a satellite galaxy varies along its orbit and how this correlates with mass loss, thus providing a natural measure of the importance of mutual interactions between satellite galaxies.
In what follows, we motivate our choice of the integral interaction measure (hereafter IIM) as a gauge for the importance of interactions between satellite galaxies, and present the results of our analysis of a suite of high resolution cluster mass haloes that formed assuming the CDM cosmology. We demonstrate the suitability of the IIM for our purposes by performing a series of experiments with “cleaned” simulations, in which we track the detailed mass loss history of a single satellite galaxy in a host halo in which the substructure has been removed. Finally, we compare and contrast our results with those of previous studies, and comment on their observable consequences.
2 The Simulations
Our analysis is based on a suite of eight high-resolution -body simulations (Gill et al., 2004a, b) carried out using the publicly available adaptive mesh refinement code MLAPM (Knebe, Green & Binney, 2001) in a standard CDM cosmology (). Each run focuses on the formation and evolution of a dark matter galaxy cluster containing of order one million particles, with mass resolution and force resolution 2 which is of the order 0.05% of the host’s virial radius. These simulations have the required resolution to follow the satellites within the very central regions of the host potential (5–10% of the virial radius) and the time resolution to resolve the satellite dynamics with good accuracy (170 Myrs). Such temporal resolution provides of order 10-20 timesteps per orbit per satellite galaxy, thus allowing these simulations to be used in a previous paper (Gill et al., 2004b) to accurately measure the orbital parameters of each individual satellite galaxy.
Substructure within these haloes is identified using the halo finder MHF (MLAPM’s-halo-finder). MHF is based upon the -body code MLAPM and acts with exactly the same accuracy as the -body code itself; it is therefore free of any bias and spurious mismatch between simulation data and halo finding precision arising from numerical effects. We applied MHF to each of our eight host halos at their formation time which is the redshift where the halo contains half of its present day mass. We track the orbits of each of the satellites identified within and around the host halo from until and follow the evolution of their properties in great detail. For further details relating to the properties of the satellite galaxies, we refer the reader to the Gill et al. (2004a, b); Gill, Knebe & Gibson (2005) series of papers.
3 The Analysis
In what follows, we have considered only those satellites that have completed at least one full orbit within their host halo, corresponding to more than 70% of the subhaloes. The number distribution of orbits peaks at about 1–2 orbits with the tail extending to as many as four orbits for the older host halos. A detailed discussion of the orbital properties (amongst others) of the substructure population can be found in Gill et al. (2004a).
We restricted our sample of satellites to those that contain at least 100 particles, which translates to a minimum mass of . To ensure that our results are not affected by resolution effects, we checked that all results presented below are recovered when the lower mass limit is gradually increased; that is, we considered additional lower mass cuts corresponding to 200 and 400 particles and we can confirm that our results are unaffected.

3.1 Integral Interaction Measure
We begin by calculating the forces acting on each satellite galaxy for each available snapshot of the simulation, treating it as a point particle with mass . The force exerted by the host halo and the force exerted by all other satellites are given as follow
| (1) |
where is the mass of satellite and the mass of the host interior to the satellite distance . We need to stress that both these formulae assume spherical symmetry and hence are only approximations to the “true” forces.
We define a so-called (dimensionless) “integral-interaction-measure” – IIM – for each individual satellite galaxy as follows:
| (2) |
where we integrate over a time interval , which is the time satellite has spent within its host’s virial radius. Here we also note that due to our definition the IIM values scale linearly with the “average satellite mass”. The discrete nature of the time sampling of our data requires that the integral should be expressed as the following summation:
| (3) |
where is the age of the Universe at redshift , the age of the Universe when the satellite enters the host halo, and the time difference between two consecutive outputs. We average the forces exerted by both the other satellites and the host halo over the consecutive outputs, i.e. [, or “mid-point integration” of equation (2):
| (4) |
The integral-interaction-measure equation (3) can now be used as a quantitative measure for the relative strength of satellite-satellite encounters.
3.1.1 Application of the Integral Interaction Measure
In Fig. 1 we present the integral-interaction-measure , as defined by equation (3), for each satellite in our suite of eight host halos plotted as a function of satellite mass. This figure suggests that there is no clear trend for interactions to correlate with mass, as we might have expected; it would be rather surprising to find that, for instance, high-mass satellites tend to interact more prominently than low-mass ones (or vice versa).
The most striking feature of Fig. 1 is the apparent rise of the values as a function of decreasing age for the host halos: the halos are ordered in age with halo #1 being 8.3 Gyrs old and halo #8 a mere 3.4 Gyrs.

This can be better viewed in Fig. 2 where we plot the distributions of the integral interaction measure IIM. For all our eight host halos these distributions have been fitted with a log-normal function
| (5) |
corresponding best fit parameters along with the halo age are listed in Table 1 where IIMpeak = IIM for a log-normal distribution.
| halo | age [Gyr] | IIMpeak | IIM0 | |
|---|---|---|---|---|
| # 1 | 8.30 | 0.067 | 0.118 | 0.756 |
| # 2 | 7.55 | 0.137 | 0.199 | 0.614 |
| # 3 | 7.16 | 0.126 | 0.227 | 0.767 |
| # 4 | 7.07 | 0.162 | 0.270 | 0.716 |
| # 5 | 6.01 | 0.287 | 0.464 | 0.692 |
| # 6 | 6.01 | 0.221 | 0.307 | 0.575 |
| # 7 | 4.52 | 0.535 | 0.789 | 0.623 |
| # 8 | 3.42 | 0.672 | 1.021 | 0.646 |
The increase of the IIM with decreasing age of the host is consistent with the behaviour observed in Knebe et al. (2004), in which it was noted that the tail of the distribution of the number of encounters per orbit extended to larger values for younger host systems. However, the result implied by the IIM is distinct from that presented in Knebe et al. (2004) in the sense that we are considering the net force acting on a subhalo over some time interval, whereas we previously considered encounters as events in which a pair of subhaloes were spatially coincident. This raises the question of whether or not the IIM is a reasonable measure of interactions, and in particular, if it could simply be the case that it is dominated by single encounters.
We investigate this in Fig. 3, where we examine the correlation between the IIM and the number of “tidal encounters” as quantified by calculating the tidal radius of a given satellite induced by one of the other satellites (Knebe et al., 2004). Whenever the tidal radius becomes smaller than the radius333We define the radius of a satellite either to be the virial radius, i.e. the radius where the mean averaged density (measured in terms of the cosmological background density ) drops below , or the truncation radius, i.e. the point where the satellite’s density profile rises again due to the embedding in the host halo. of the satellite we increment a counter for that particular satellite that keeps track of the number of (perturbing) interactions with companion satellite galaxies.

Fig. 3 clearly indicates that there is little (if any) correlation between the number of satellite-satellite encounters and the integral interaction measure for a single satellite. Moreover, also the scatter about the mean IIM value in each bin is not affected by the actual number of encounters experienced by the satellite. This strongly suggests that the IIM value is not dominated by single events but rather is a cumulative quantity that is accrued over the lifetime of a satellite. However, we stress that there is a correlation between the width of the distribution of encounters per orbit (c.f. Fig.3 in Knebe et al., 2004) and the peak IIM value; although the IIM is not driven by single violent encounters, the greater the number of such events, the higher the IIM of the satellite. However, these arguments are based upon the assumption that the “strength” of individual encounters is more or less equal. It still appears possible for one single strong encounter to dominate the value of IIM.
Another factor possibly affecting the observed correlation between host halo age and interaction measure IIM is the mass fraction of satellites. A simple check indicates that the younger the host the higher the fraction of mass locked-up in satellite galaxies. This suggests that the IIM values may in fact be influenced by the most massive subhaloes. We will come back to this point later in Section 3.4 but can already confirm that the distributions presented in Fig. 2 practically remain unaltered if we discard all satellites less massive than 1% of the host’s virial mass444One needs to bear in mind that the mass spectrum of subhaloes extends down to as low as – (e.g. DeLucia et al., 2004), denoting the importance of massive subsystems.
In addition, we have investigated whether or not there exists a relation between then IIM and either the eccentricity of a satellite’s orbit or its pericentric distance, but we do not find strong evidence for such a correlation. Although we observed a significant drop in the number of encounters per orbit with increasing distance from the host’s centre, we find no comparable result for IIM. This indicates that satellites “encounter” each other with greater frequency closer to the centre of the host, but that such encounters occur with high relative velocities and so cause little structural damage. Encounters in the central regions are therefore no more damaging than those in the outer regions. We elaborate upon this in greater detail in the following section.


3.2 Distributions of Relative Encounters
We have calculated the distribution of satellite-satellite distances as well as the relative speed of satellite pairs for all available outputs in-between formation redshift of the host and , and show the resulting distributions of in Fig. 4 and Fig. 5 respectively.
In Fig. 4 we have plotted the relative separation normalised by the sum of the two virial radii of the respective satellites, i.e. and ; a value of corresponds to a distance of the satellitei-satellitej pair for which the “virial spheres” of the satellites and are overlapping. We note that the distributions can be fitted by a log-normal distribution
| (6) |
where . Fig. 4 is accompanied by Table 2 where we summarize the best-fit parameters. Despite the age-IIM relation found in the previous Section 3.1 we do not observe any trend for relative distances to increase (or decrease) with halo age. Tormen et al. (1998) performed a similar analysis, but their respective distance distribution peaks for values corresponding to distances smaller than the sum of the two individual radii indicating they had “at least one penetrating encounter” (cf. Fig.7 in their paper noting that they are plotting the inverse of our distance measure). However, we note that the definitition for a satellite’s virial radius used by Tormen et al. (1998) differs to ours; they define the virial radius to be the satellite’s radius at the moment it ”merges” with the host halo, whereas we calculate the satellite’s radius for each snapshot we have along its orbit within the host halo. This naturally leads to smaller radii as most of the satellites loses mass as it orbits within the denser environment of the host (c.f. definition for satellite radius in Section 3.1.1, footnote 2), and as a result the distribution of relative distances peaks at larger separations.
| Halo | ||
|---|---|---|
| # 1 | 0.097 | 0.536 |
| # 2 | 0.111 | 0.510 |
| # 3 | 0.158 | 0.567 |
| # 4 | 0.130 | 0.550 |
| # 5 | 0.104 | 0.568 |
| # 6 | 0.137 | 0.564 |
| # 7 | 0.147 | 0.543 |
| # 8 | 0.119 | 0.540 |
| Halo | ||
|---|---|---|
| # 1 | 1.390 | 0.563 |
| # 2 | 1.319 | 0.544 |
| # 3 | 1.385 | 0.572 |
| # 4 | 1.323 | 0.548 |
| # 5 | 1.386 | 0.564 |
| # 6 | 1.358 | 0.548 |
| # 7 | 1.396 | 0.562 |
| # 8 | 1.292 | 0.534 |
Relative velocities between satellites can also enhance the impact of interactions on mass loss – the slower the encounter between a pair of satellites, the longer the timescale over which damage can be done. In Fig. 5 we show the distribution of relative velocities for pairs of satellites, normalised by the velocity dispersion of the host halo. As before, we stack data for all available outputs for each system, but we now fit the distributions with a Gaussian;
| (7) |
Here is the relative velocity of two satellites in terms of the velocity dispersion of the host halo. This figure suggests that there is no correlation of peak value with age, in good agreement with the best-fit parameters presented in Table 3.
In summary, our analysis indicates that slow and/or close penetrating encounters between pairs of satellite galaxies are relatively rare events. We have checked to ensure that our decision to stack all available outputs does not bias our result by masking a potentially interesting signal; however, we can confirm that the results are unaffected whether we construct the distribution from data obtained at a single redshift (e.g. final redshift or formation redshift ).

3.3 Mass Loss induced by Satellite-Satellite Interactions
We have defined a physically motivated quantitative measure of
interactions between satellite galaxies in the form of the IIM
(equation 3). Our detailed investigation of IIM values in
the previous sections provided great insight into the relevance of
interactions in general; we were able to demonstrate that satellites
encounter other satellites with the same relative velocities and separations
at all times during the formation of a cluster, but the interaction measure
IIM is higher in younger systems. However, it is difficult to conceive
of a means to reconstruct IIM values for satellite galaxies from observational
data. Whereas IIM values can readily be evaluated in -body simulations
providing a gauge for the presence and importance of interactions,
respectively, we prefer to construct a new measure for quantifying the
impact of interactions more applicable to observational data sets. The mass
loss suffered by a satellite as a result of the interactions would seem a
promising approach; it can be probed observationally, such as in
the field of “galactic archaeology” where tidally stripped (stellar)
streams have proven to be a powerful tool (e.g. Helmi et al., 1999). However,
understanding the evolution of satellite galaxies is complicated because
changes are driven not only by the tidal field of the host
(as shown by Knebe et al., 2005) but also by more subtle processes such as
the time evolution of the underlying host potential. Explicitly accounting
for such time dependency gives better agreement with self-consistent
modeling of satellites in the integrals-of-motion space, but there still
remains a certain amount of disagreement between the observed and
measured mass losses; for example, Knebe et al. (2005) speculated that
this can be attributed to either the shape of the host and/or
interactions with companion satellites. Using the ideas and
prescriptions developed in Section 3.1, we now extend our analysis
to place constraints on the mass loss that can be induced by
satellite-satellite interactions.
A satellite suffers a mass loss of
| (8) |
between two consecutive outputs and . We wish to relate a fraction of this mass loss to interactions between satellites and so we write as the sum of the mass loss induced by interactions with other satellites, , and with the host halo, ;
| (9) |
In order to break the degeneracy between and , we assume that the satellites are point masses with velocity , and hence write their momentum change as follows:
| (10) |
which can be re-arranged to give
| (11) |
where we (numerically) confirmed that on average and can therefore simplify the equation for mass loss to read
| (12) |
where is the midpoint between two outputs calculated using equation (4) and is a “tuning factor” accounting for the approximate nature of our approach. From Fig. 4 we conclude that is the most appropriate value (represented by the solid line) and this is the value we adopt in the following analysis.
We now use equation (9) and the scaling relation equation (12) to compute the mass loss suffered as a result of satellite interactions and the influence of the host, respectively:
| (13) |
where we have further assumed that equation (12) holds for both the force due to satellite-satellite interactions and the force induced by the host halo.
Over the years, a number of sophisticated prescriptions for modeling tidally driven mass loss have been developed, largely within the context of the evolution of globular clusters in external tidal fields (e.g. Spitzer, 1958; Gnedin et al., 1999, and references therein) but also for understanding the disruption of satellite galaxies in cosmological dark matter halos (e.g. Penarrubia & Benson, 2005; Hayashi et al., 2003; Taylor & Babul, 2001). Although equation (13) represents a first order approximation for the mass loss, we will demonstrate that our formulae lead to qualitatively correct results and predictions with the right order of magnitude; a more thorough study and the development of a full theoretical model for mass loss in cosmological dark matter halos will be dealt with in a companion paper. In the present study we concentrate on quantifying the importance of interactions for mass loss and their importance for analytical modeling in galactic archaeology.
In the following analysis we use the average fractional mass loss per Gyr for a given satellite
| (14) |
where is the number of outputs available for that particular satellite between the time it enters the host and the present; the time interval is calculated for two consecutive outputs. We are using equation (13) to split mass loss due to encounters and the influence of the host. The resulting distributions for average mass loss per Gyr are shown in Fig. 7. This figure demonstrated that the mass loss induced by encounters between satellite galaxies can be as important as the tidal stripping of mass by the host potential in dynamically young systems. However, as the system becomes more relaxed, the relevance of such interactions becomes progressively less important and a significant fraction of the mass loss can be directly ascribed to the tides induced by the host. Table 4 accompanies Fig. 7; here we have calculated the mean of the average mass loss per Gyr for all satellites in a given host halo:
| (15) |

| halo | ||||
|---|---|---|---|---|
| # 1 | 0.132 | 0.030 | 0.102 | 0.23 |
| # 2 | 0.123 | 0.033 | 0.090 | 0.27 |
| # 3 | 0.143 | 0.039 | 0.104 | 0.27 |
| # 4 | 0.126 | 0.038 | 0.088 | 0.30 |
| # 5 | 0.147 | 0.050 | 0.097 | 0.34 |
| # 6 | 0.137 | 0.041 | 0.096 | 0.30 |
| # 7 | 0.141 | 0.054 | 0.087 | 0.38 |
| # 8 | 0.123 | 0.055 | 0.068 | 0.45 |
From Table 4 we infer that the mass loss induced by satellite-satellite encounters can amount to as much as 45% of the total mass loss experienced by a single satellite. Even though the integral interaction measure IIM (as defined by equation (3)) and its distribution in Fig. 2 indicated a rather low importance of such interactions the conversion to mass loss reveals a more pronounced influence due to the observed power law scaling with . However, the results are robust to changes in the power-law index, e.g. changing the exponent from to unity gives us the range from 15% mass loss due to interactions for the oldest host (halo #1) up to 40% for the youngest system (halo #8).
3.4 A Test Scenario: Host Halo #8
Two questions remain unanswered:
-
1.
Why do we observe a higher mass loss due to interactions in younger systems?
-
2.
Can our results be verified?
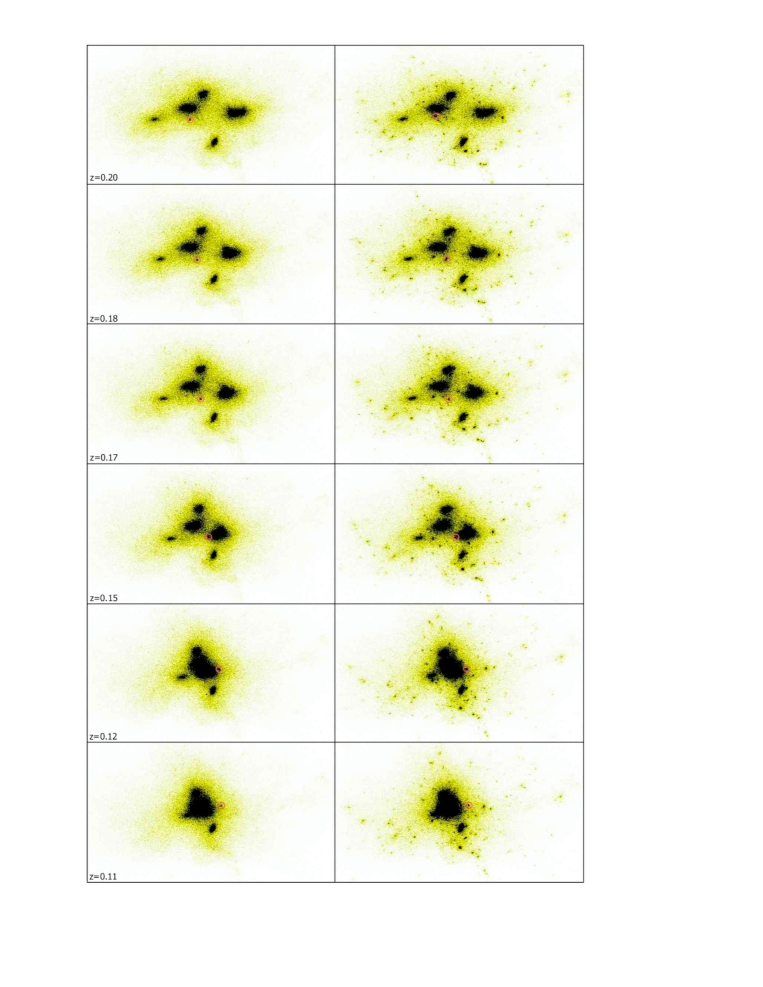
The most natural approach to addressing these questions involves explicitly tracking the mass loss of an individual satellite as a function of time and factoring out the influence of the other satellites. To do this, we have performed two additional simulation runs of halo #8, both starting at its formation redshift . In the first, we have removed all halos bar the progenitor of the host halo and one particular satellite that happened to have a rather high interaction value of ; our analysis indicates that about 40% of its average mass loss per Gyr was induced by interactions with other satellites. In the second run, we removed only those subhaloes that have not merged with the host’s progenitor at redshift except our “test satellite”. We refer to these runs as “fully cleaned” (the former, including only the host and our test satellite) and “cleaned” (the latter, also including the massive subhaloes merging with the host) respectively.
A visual impression of the initial setup of the cleaned run is given in (the upper left panel of) Fig. 10 which nicely demonstrate the “smoothness” of the cleaned simulation. The satellite in question is marked by a blue circle.
For each of the three runs we closely follow the mass loss history of this satellite and the resulting curve (normalized to the initial mass) is presented in Fig. 8. Note that we identify the set of particles that are bound to the satellite at the initial time and we explicitly track these particles through subsequent snapshots, checking what fraction are bound to the satellite at later times. This avoids any difficulties that may arise from attempting to identify the bound mass of the satellite as it is identified in subhalo catalogues constructed for consecutive snapshots. For each available output we find the new satellite centre by using the centre-of-mass of the innermost bound particles as a first guess for the central density peak. We then iteratively remove all of the satellite’s particles that are not gravitationally bound. Fig. 8 shows that the mass loss suffered by the satellite is significantly reduced in both of the cleaned runs. However, we stress that removing all substructure not only affected the satellite under investigation but also the overall dynamics of the host, especially for the fully cleaned run: host halo #8 can be classified as a violent (triple) merger in the original cosmological simulation and removing all of its progenitors must clearly leave an imprint on its (internal) dynamics. Nevertheless, we note that although the “cleaned” run retained most of its high mass substructures, we observed a trend for the mass loss to decrease.

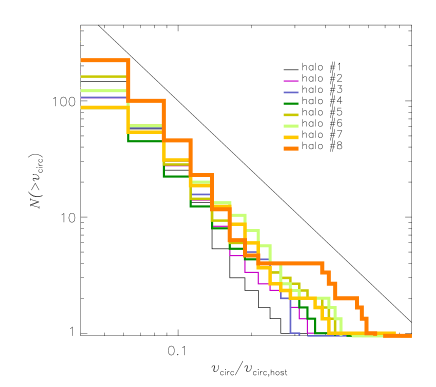
This simple test has demonstrated that the principal driver for interaction induced mass loss is the mass spectrum of the substructure halos. We may strengthen this statement further by considering the cumulative circular velocity distribution presented in Fig. 9. Noting that the maximum circular velocity is a reasonable measure of halo mass, we conclude from this figure that a sizeable fraction of the mass in satellites in each of the eight host haloes is bound to high mass systems roughly half way through their evolution (i.e. ).
These massive subhaloes are likely to be responsible for the increased mass loss due to interactions, as already indicated by Fig. 8. We can investigate this assertion by determining the fraction of the IIM measure that is due to massive satellites. As already mentioned in Section 3.1, we can reproduce the distributions of IIM values presented in Fig. 2 by including only those satellite galaxies that are more massive than 1% of the host’s virial mass555Using an empirically derived scaling relation between satellite mass and maximum circular velocity, i.e. , the mass limit of 1% corresponds to a cut in circular velocity at around 20% (cf. Fig. 9).. This indicates quite clearly that the IIM values are dominated by more massive systems and the contribution of low-mass satellites is negligible.
4 Conclusions
The hierarchical manner in which structure in our Universe forms – from the bottom up, through mergers and accretions – implies that interactions between galaxies (and consequently, between their dark matter haloes) are commonplace. These interactions have been invoked to explain, for example, galaxy transformation (e.g. Moore et al., 1998), the exchange of angular momentum (e.g. Barnes & Efstathiou, 1987), the triggering of star bursts (e.g. Mihos & Hernquist, 1994) and morphological change (Steinmetz & Navarro, 2002). The impact of interactions between satellite galaxies and their massive host on the structure of the satellites has been studied in some detail (e.g. Hayashi et al., 2003), but less well understood is the role played by interactions between satellite galaxies; in other words, the impact of satellite-satellite interactions. This important topic has formed the basis of this paper.
We have defined an integral interaction measure (IIM) that allows us to quantitatively measure the importance of interactions between satellite galaxies for their mass loss. Our definition allows us to gauge the relative contributions of the host potential and other satellites for the mass loss suffered by an individual satellite. We have shown that the distribution of IIMs for a population of satellites within a cluster mass dark matter halo can be characterised as lognormal, and that the peak value (or mode) correlates with the age of the host system – typically the younger the host, the larger the peak IIM. Moreover, we note that the relative width of the distribution is broader in younger systems. We were able to confirm that the most significant contribution to the interaction measure comes from massive companion satellites which naturally explain the correlation with host age: subhaloes in young clusters have larger masses relative to the host since they have not been tidally disrupted yet which is validated by the observation that our younger hosts have a higher mass fraction in satellites. However, the IIM values are generally much less than unity, implying that the bulk of the mass loss suffered by a satellite is driven by its interaction with the host potential. We have also shown that, in those cases where the IIM is large, it cannot be due to single encounters; rather, it is built up through a series of many encounters.
Our investigations have also extended the result of Knebe et al. (2004) by demonstrating that not only are penetrating encounters between satellite galaxies relatively rare events over the “lifetime” of a cluster666i.e. since its formation redshift., but that the timescale of such encounters is short, i.e. the relative velocities are typically of order the 1D velocity dispersion of the host. This result may be of interest to those engaged in developing semi-analytic models of galaxy formation because we might expect the severity of encounters between satellites to be important for the efficiency of starbursts arising from tidal interactions.
Finally we have proposed a simple empirical model for separating the respective contributions of the host potential and interactions with other satellites for the mass loss suffered by a satellite. Our model suggests that mass loss driven by satellite interactions can be significant – in the particular test case we considered, we have shown that a given satellite can lose as much as of its initial mass. This may appear surprising at first, but we have shown that the IIM is a cumulative measure and so while damaging encounters are relatively rare occurrences, a large number of “weak” interactions can affect the structure of a satellite and drive the mass loss it suffers. However, we stress that this empirical model should be taken as simple guide providing an “order-of-magnitude” estimate of the mass loss, and a more sophisticated model is required; this will be the focus of future work.
5 Acknowledgments
The simulations presented in this paper were carried out on the Beowulf cluster at the Centre for Astrophysics & Supercomputing, Swinburne University. AK acknowledges funding through the Emmy Noether Programme by the DFG (KN 722/1). CP thanks Virginia Kilborn and Sarah Brough for helpful discussion. The financial support of the Australian Research Council is gratefully acknowledged.
References
- Barnes (1988) Barnes J.E., 1988, ApJ, 331, 699
- Barnes & Efstathiou (1987) Barnes J.E. & Efstathiou G., 1987, ApJ, 319, 575
- Bekki & Chiba (2005) Bekki K. & Chiba M. 2005, MNRAS, 356, 680
- Connors et al. (2005) Connors T. W., Kawata D., & Gibson B. K. 2005, preprint (astro-ph/0508390)
- DeLucia et al. (2004) De Lucia G., Kauffmann G., Springel V., White S.D.M., Lanzoni B., Stoehr F., Tormen G., & Yoshida N., 2004, MNRAS, 348, 333
- Dubinksi et al. (1999) Dubinski J., Mihos J.C., & Hernquist L., 1999, ApJ, 526, 607
- Gao et al. (2004) Gao L., De Lucia G., White S. D. M, & Jenkins A. 2004, MNRAS, 352, L1
- Gardiner & Noguchi (1996) Gardiner L. T. & Noguchi M., 1996, MNRAS, 278, 191
- Gill et al. (2004a) Gill S.P.D., Knebe A., & Gibson B.K., 2004a, MNRAS, 351, 399
- Gill et al. (2004b) Gill S.P.D., Knebe A., Gibson B.K.,& Dopita M. A., 2004b, MNRAS, 351, 410
- Gill, Knebe & Gibson (2005) Gill S.P.D., Knebe A., & Gibson B.K., 2005, MNRAS, 356, 1327
- Gnedin et al. (1999) Gnedin O.Y., Lee H.M., & Ostriker J.P., 1999, ApJ, 522, 935
- Goto (2005) Goto T., 2005, MNRAS, 357, 937
- Hayashi et al. (2003) Hayashi E., Navarro J.F., Taylor J.E., Stadel J., & Quinn T., 2003, MNRAS, 584, 541
- Helmi et al. (1999) Helmi A., White S.D.M., de Zeeuw P.T., & Zhao, H., 1999, Nature, 402, 53
- Helmi (2004) Helmi A., 2004, MNRAS, 351, 643
- Ibata & Lewis (1998) Ibata R.A. & Lewis G.F., 1998, ApJ, 500, 575
- Ibata et al. (2003) Ibata R., Irwin M.J., Lewis G.F., Ferguson A.M.N., & Tanvir N., 2003, MNRAS, 340, L21
- Ibata et al. (2004) Ibata R., Chapman S., Ferguson A.M.N., Lewis G., & McConnachie A., 2004, MNRAS, 351, 117
- Knebe, Green & Binney (2001) Knebe A., Green A., & Binney J., 2001, MNRAS, 325, 845
- Knebe et al. (2004) Knebe A., Gill S.P.D., & Gibson B.K., 2004, PASA, 21, 216
- Knebe et al. (2005) Knebe A., Kawata D., Gill S.P.D., & Gibson B.K., 2005, MNRAS, 357, L35
- Larson & Tinsley (1978) Larson R.B. & Tinsley B.M., 1978, ApJ, 219, 46
- Lin et al. (1995) Lin D. N. C., Jones B. F., & Klemola A. R., 1995, ApJ, 439, 652
- Mastropietro et al. (2005) Mastropietro C., Moore B., Mayer L., Wadsley J., & Stadel J. 2005, MNRAS, 363, 521
- Mihos & Hernquist (1994) Mihos J. C. & Hernquist L., 1994, ApJ, 425, L13
- Mihos et al. (2005) Mihos J. C., Harding P., Feldmeier J., & Morrison H., 2005, ApJ, 631, L41
- Moore et al. (1996) Moore B., Katz N., Lake G., Dressler A., & Oemler A., Jr., 1996, Nature, 379, 613
- Moore et al. (1998) Moore B., Lake G., & Katz N., 1998, ApJ, 495, 139
- Navarro et al. (2004) Navarro J.F., Helmi A., & Freeman K.C., 2004, ApJ, 601, L43
- Odenkirchen et al. (2003) Odenkirchen M., et al., 2003, AJ, 126, 2385
- Oemler (1992) Oemler J. A., 1992, in Clusters and Superclusters of Galaxies, ed. Fabian A., Dordrecht: Kluwer, p. 29
- Oh et al. (1995) Oh K. S., Lin D. N. C., & Aarseth S. J., 1995, ApJ, 442, 142
- Spitzer (1958) Spitzer L., 1958, ApJ, 127, 17
- Penarrubia & Benson (2005) Penarrubia J. & Benson A.J., 2005, 2005, MNRAS, 364, 977
- Springel & White (1999) Springel V. & White S.D.M., 1999, MNRAS, 307, 162
- Steinmetz & Navarro (2002) Steinmetz M. & Navarro J.F., 2002, NewA, 7, 155
- Taylor & Babul (2001) Taylor J.E. & Babul A., 2001, ApJ, 559, 716
- Toomre & Toomre (1972) Toomre A. & Toomre J., 1972, ApJ, 178, 623
- Tormen et al. (1998) Tormen G., Diaferio A., & Syer D., 1998, MNRAS, 299, 728
- Yoshizawa & Noguchi (2003) Yoshizawa A. M. & Noguchi M., 2003, MNRAS, 339, 1135
- Yun et al. (1994) Yun M. S, Ho P. T. P, & Lo K. Y. 1994, Nature, 372, 530
- Zhao (1998) Zhao H., 1998, ApJ, 500, L149