Effects of line-blocking
on the non-LTE Fe I spectral line formation
The effects of background line opacity (line-blocking) in statistical equilibrium calculations for in late-type stellar atmospheres have been investigated using an extensive and up-to-date model atom with radiative data primarily from the iron Project. The background metal line opacities have been computed using data from the marcs stellar model atmospheres. While accounting for this line opacity is important at solar metallicity, the differences between calculations including and excluding line-blocking at low metallicity are insignificant for the non-local thermodynamic equilibrium (non-LTE) abundance corrections for Fe i lines. The line-blocking has no impact on the non-LTE effects of Fe ii lines. The dominant uncertainty in non-LTE calculations for metal-poor stars is still the treatment of the inelastic H i collisions, which have here been included using scaling factors to the classical Drawin formalism, and whether or not thermalisation of the high Fe i levels to Fe ii ground state should be enforced. Without such thermalisation, the Fe i non-LTE abundance corrections are substantial in metal-poor stars: about dex with efficient (i.e. Drawin-like) H i collisions and dex without. Without both thermalisation and H i collisions, even Fe ii lines show significant non-LTE effects in such stars.
Key Words.:
line: formation – Sun: abundances – stars: abundances – stars: individual: Procyon – stars: individual: HD~140283 – stars: individual: G64-121 Introduction
Accurate knowledge of stellar Fe abundances is crucial for our understanding of stellar evolution as well as for the study of cosmic chemical evolution. Indeed the abundance of iron is normally taken as a proxy for the stellar metal content. Recent work has been devoted to quantify possible departures from local thermodynamic equilibrium (LTE) in the formation of Fe I spectral lines but without reaching any consensus to the expected magnitude of the non-LTE effects in late-type stars (e.g. Gratton et al. gratton (1999); Thévenin & Idiart thevenin (1999); Shchukina & Trujillo Bueno shchukina (2001); Gratton et al gratton2 (2001); Gehren et al. 2001a , 2001b ; Korn et al. korn (2003); Shchukina et al. shchukina2 (2005); see discussion and further references in Asplund asplund2 (2005)). The different results are particularly striking at low metallicity where some authors find very large non-LTE abundance corrections ( dex) while others find negligible effects ( dex). It is embarrassing that such large discrepancies still exist for the most commonly studied element. It certainly raises concern over the astronomical interpretations not only for Fe but for other elements as well.
Since the main non-LTE physical mechanism for Fe – over-ionisation – feeds on the UV radiation field it is paramount to include the effects of line-blocking in the computations. This study has been motivated by the fact that many of the above-mentioned non-LTE calculations have been performed without properly including this line-blocking. For example, background line opacities were not accounted for in detail in the influential non-LTE study of Thévenin & Idiart (1999). Instead artificial multiplication factors were applied to the continuous opacities in their calculations in order to simulate the line haze in the UV. Could the large non-LTE abundance corrections they found be significantly over-estimated because of this shortcoming?
Here we attempt to quantify the effect of line-blocking on the determination of non-LTE abundance corrections for Fe i lines. In order to achieve this, we have modified the widely used statistical equilibrium code multi (Carlsson 1986) and as such our work will also be of interest for future non-LTE line formation studies for other elements. In view of the remaining uncertainties attached to the treatment of inelastic H i collisions (e.g. Asplund asplund2 (2005)), our focus in this initial investigation is not on the exact values of the non-LTE abundance corrections but on the differential impact of line-blocking in late-type stars of different metallicity. We defer a comprehensive investigation of the non-LTE line formation for a large grid of stellar model atmospheres to a future study. We also intend to return to the problem of Fe line formation using 3D model atmospheres.
2 Methods
2.1 The model atom
2.1.1 Energy levels and radiative data
For the non-LTE Fe i spectral line formation calculations in this paper we adopted an updated version of the model atom by Thévenin & Idiart (thevenin (1999)). At the present time the Fe i and Fe ii systems in the National Institute of Standards and Technology (NIST) database111http://physics.nist.gov/PhysRefData/ASD/ consist of 493 and 578 identified levels respectively (Sugar & Corliss sugar (1985)). The laboratory analysis by Nave et al. (nave (1994)) has further extended the information on the Fe i system by bringing the number of identified energy levels to 846 and the number of identified lines to nearly 9 800. In recent years moreover the ongoing international collaboration known as the ferrum Project (Li et al. li (1993); Johansson et al. johansson (2002)) has aimed at expanding and improving the database of oscillator strengths and transition probabilities of Fe ii lines of astrophysical significance by means of both laboratory measurements and theoretical calculations. However, as the ferrum Project has only addressed a selection of Fe ii bound-bound transitions at this stage and is not yet complete we relied on the data provided by NIST to construct the Fe ii sub-system in our work. In practice data storage and computing time impose limitations to the complexity of the actual model atom chosen for the calculations. We therefore restricted our model to 334 levels of Fe i from the NIST database up to an excitation potential of eV (about 1 eV below the first ionisation edge), 189 levels of Fe ii up to eV above the Fe i ground state, and the ground level of Fe iii. In total 3 466 bound-bound radiative transitions between Fe i levels and 3 440 between Fe ii levels were considered, together with the photo-ionisation cross-sections for 523 bound-free transitions.
Spectral line profiles were sampled for typically 70 wavelength points and approximated with the standard Voigt function. The -values for Fe i lines were taken from Nave et al. (nave (1994)) and Kurucz & Bell (kurucz (1995)) databases, while for the oscillator strengths of Fe ii lines we referred to the same sources as Thévenin & Idiart (thevenin (1999)). The radiative data for the photo-ionisation cross-sections came from the iron Project (Bautista bautista (1997)). The detailed bound-free cross-sections were smoothed whenever possible to reduce the number of wavelength points in the calculations and therefore decrease the computing time. When strong resonances were present near the photo-ionisation edges we kept the regular frequency sampling. We tabulated the cross-sections for bound-free transitions from Fe i levels for typically about 100 wavelength points on average up to 300 wavelength points when high-resolution was necessary. Cross-sections for photo-ionisations from Fe ii levels were tabulated instead for about 30 wavelength points on average.
2.1.2 Collisional data
| Object | |||
|---|---|---|---|
| Sun | |||
| Procyon | |||
| HD~140283 | |||
| G64-12 |


All levels in our model atom were coupled with one another via collisional excitation and ionisation by electrons and by neutral hydrogen atoms, as these types of collisions are believed to be the most relevant in the atmospheres of cool stars. Collisional excitations by electrons were implemented using van Regemorter’s formula (regemorter (1962)) while cross-sections for ionisation by electron impact were computed following Cox (allen (2000)). All oscillator strengths were set to a minimum value of in the formulas for bound-bound collisions with electrons and hydrogen atoms. For the latter type of collisions we adopted the approximate description proposed by Drawin (drawin1 (1968), drawin2 (1969)), as done by Steenbock & Holweger (steenbock (1984)). However, both laboratory measurements and quantum-mechanical calculations for simple atoms indicate that the Drawin’s recipe fails to reproduce the right order of magnitude for the cross-sections of H i collisions: in the cases for which comparison with experimental data or theoretical calculations is possible, cross-sections computed with the aid of Drawin’s formula appear to be overestimated by factors of depending on the species and transition (Fleck et al. fleck (1969); Lambert lambert (1993); Belyaev et al. belyaev (1999); Belyaev & Barklem belyaev2 (1999); Barklem et al. barklem (2003)).
On the other hand, some recent stellar spectroscopic studies suggest that the cross-sections of H i collisions with atoms might actually be reasonably well described by Drawin’s recipe. Korn et al. (korn (2003)) found that ionisation equilibrium between Fe i and Fe ii in cool metal-poor stars is matched consistently with surface gravities derived from hipparcos parallaxes when the Drawinian collisional cross-sections are scaled by a factor using their particular model dependent scale (based on H lines). Gratton et al. (gratton (1999)) calibrated H i collisions with by using RR Lyrae variables at their minimum light and adopted an even larger scaling factor . The observational evidence is, however, not unambiguous as some studies have found the presence of large differences between Fe i and Fe ii based LTE abundances in halo stars (e.g. Nissen et al. nissen (1997); Fuhrmann fuhrmann (1998); Allende Prieto et al. allende (1999)) which might indicate that the H i collisions be inefficient compared with Drawin’s recipe. Other observational studies suggest vanishing or very small differences between the Fe i and Fe ii based abundances (e.g. Gratton et al. gratton2 (2001); Kraft & Ivans kraft (2003)). The efficiency of H i collisions is clearly an open issue which requires further work both observationally and, most importantly, through detailed atomic physics calculations.
As a reliable and comprehensive description of neutral hydrogen collisions with iron atoms is not available at this stage, we treated the efficiency of H i collisions à la Drawin as a free parameter throughout our study. In particular, considering the large uncertainty on the actual cross-sections of H i collisions, we decided to apply multiplication factors and to Drawin’s formula and compared the resulting effects on the non-LTE calculations in the two cases. This approach is justified since the main focus of the present paper is to investigate the effects of line-blocking rather than providing the final word on the size of the non-LTE abundance corrections for individual stars.
2.2 The model atmospheres
As the purpose of our study was to investigate the effects of line-blocking on the non-LTE formation of Fe i spectral lines, we have not performed non-LTE calculations for a large grid of models. Instead we have selected a sample of four cool stars (the Sun, Procyon, HD~140283 and G64-12), covering the most relevant parameter space and performed the necessary test calculations.
The analysis was carried out using marcs line-blanketed, plane-parallel model atmospheres (Asplund et al. asplund (1997)) of the four objects, computed for the set of stellar parameters indicated in Table 1 and a micro-turbulence km s-1. We kept these effective temperatures and surface gravities constant throughout the analysis, as the main purpose of our investigation is to study differentially the effect of the inclusion and exclusion of line-blocking on the derivation of non-LTE corrections to the iron abundance with respect to the LTE case and not to fine-tune stellar parameters. We note that our conclusions are immune to reasonable changes of the adopted stellar parameters. In particular the computed non-LTE abundance corrections are affected by about dex or less when a micro-turbulence km s-1 is used instead.
Finally, we adopted for the Sun the solar chemical composition by Grevesse & Sauval (grevesse (1998)), i.e. assuming an iron abundance of 222. The chemical composition of the other models was scaled with respect to solar according to their LTE iron abundance and assuming an -enhancement of dex for the two metal-poor stars in the sample.
Along with the marcs solar atmosphere, we considered two additional models for the Sun: the semi-empirical Holweger-Müller (hm) model (Holweger & Müller holweger (1974)) and the quiet-Sun val-3c model by Vernazza et al. (vernazza (1981)). In this way we intended to cover – at least for the Sun – typical model-to-model variations in the analysis. The temperature stratifications for the three solar models are shown in Fig. 1 together with models for the other three stars. The marcs and hm models have similar stratifications although the latter has slightly warmer temperatures in the line forming regions. The non-LTE val-3c model departs from the other two solar models mainly by presenting a chromospheric temperature rise in its upper layers and reaching significantly lower temperatures at optical depths . For a quantitative description of how structural differences arise between LTE and non-LTE models of the solar photosphere we refer to the work by Rutten & Kostik (rutten (1982)) and Rutten (rutten2 (1988)).
| non-LTE Abundance Corrections from Fe i Lines | ||||
|---|---|---|---|---|
| Model | No blocking | With blocking | No blocking | With blocking |
| Sun (marcs) | ||||
| Sun (hm) | ||||
| Sun (val-3c) | ||||
| Procyon | ||||
| HD~140283 | ||||
| G64-12 | ||||
2.3 Radiative transfer calculations
We computed the emerging spectrum for each of the model atmospheres by solving the statistical equilibrium and radiative transfer equations with the non-LTE code multi (Carlsson carlsson (1986)), version 2.2. We introduced however some modifications concerning the treatment of background opacities. multi’s standard background opacities are based on the Uppsala package (Gustafsson gustafsson (1973)) which comprises continuous opacities only. Several bound-free extinction edges though are located in the ultraviolet where a large number of atomic lines from metals contribute to the UV “line haze” typically encountered in the spectra of cool stars. Accurate evaluation of the photo-ionisation rates in correspondence with these bound-free transitions requires that we take into account the effects of line-blocking associated with the UV line haze.
Some previous attempts have been made to include the effects of line-blocking in non-LTE calculations in multi. In their study of non-LTE formation of the solar spectrum of alkali Bruls et al. (bruls (1992)) reproduced the contribution of atomic lines to the background opacities by multiplying the total and continuous metal opacities with wavelength dependent factors. Their factors were determined empirically although only for the Sun by fitting the observed solar continuum with the emerging continuum intensity computed with the val-3c model solar atmosphere and assuming they are independent of depth. Andretta et al. (andretta (1997)) introduced background atomic and molecular lines to the standard multi’s opacities in the form of an opacity table provided with the particular model atmosphere they used. The opacity dependence upon wavelength was given in their table at each depth point of the model atmosphere with a resolution of Å. The opacity data they used were fixed however and model-specific. More recently Bayazitov (bayazitov (2003)) investigated the effects of line-blocking on non-LTE Fe i line formation by adding the contribution of about spectral lines to multi’s continuous opacities. His work however was restricted to stars with metallicities close to solar and relied on a much simpler model Fe i atom with levels plus continuum.
In our study, in order to include the effects of line-blocking in multi we proceeded by sampling metal line opacities for about wavelength points in the spectral region between Å and Å and adding them to the standard background continuous opacities. In order not to count the contribution of line opacities twice however, metal line opacities were only added to the background when computing intensities for the photo-ionisation rates and not for Fe i and Fe ii line profiles. Molecular line opacities were not considered in our line formation calculations which however is a reasonable approach for our stars where the atomic contribution dominates overwhelmingly. We performed simple bench-mark test LTE radiative transfer calculations with background line opacities sampled between and wavelength points covering the same wavelength region. The tests indicate that photo-ionisation rates computed with our choice of opacity sampling for wavelengths are sufficiently accurate for our purposes. In addition, we performed non-LTE test calculations sampling the opacities at different wavelengths and found that the overall effect on the final non-LTE abundance corrections is less then dex.
For the calculations presented in this paper the background metal line opacities were computed in detail by our modified version of multi, consistently with the particular model atmosphere given as input, as a function of temperature, gas- and electron-pressure at each depth point. For this purpose we used the opacity package from the os-marcs code (Gustafsson et al. gustafsson2 (2005)) taking into account the specific chemical composition of the given model stellar atmospheres. Level populations and ionisation equilibria for the various metals – including – were computed assuming LTE. This inconsistency for is however of minor importance and may well be balanced by missing line-blocking for other species.
The non-LTE abundance corrections were estimated by computing both the LTE and non-LTE cases for several different abundances, from which the non-LTE abundance that reproduced the LTE equivalent widths were interpolated. For each set of calculations with a given model atmosphere we selected the Fe i spectral lines in our model atom falling in the visible and in the near UV, ( Å Å), and with equivalent widths between mÅ and mÅ.
3 Results
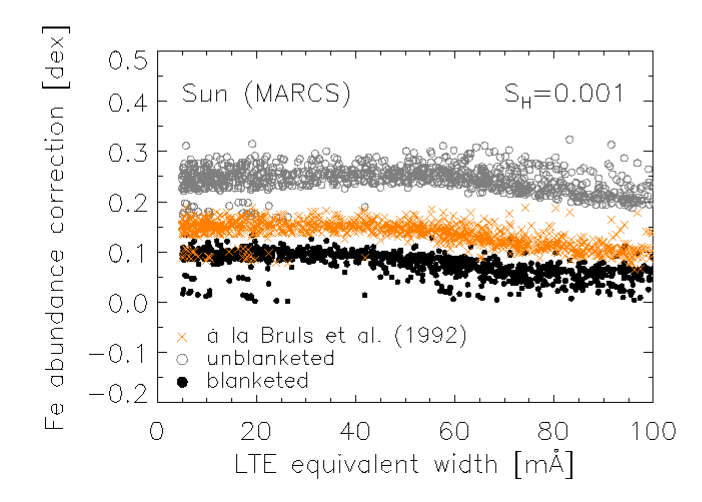
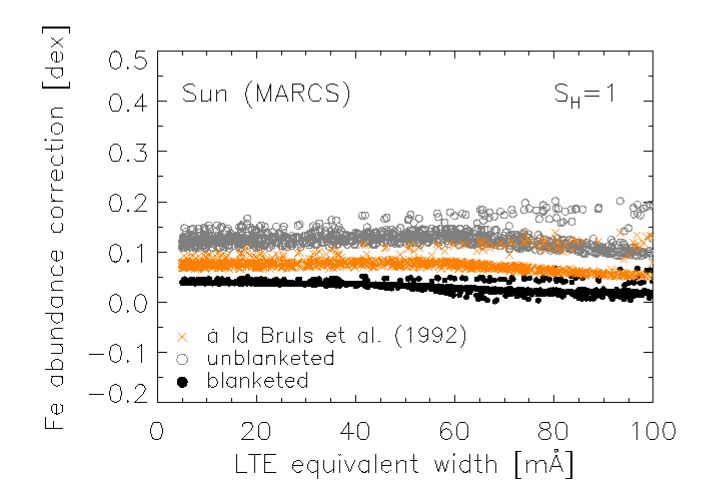
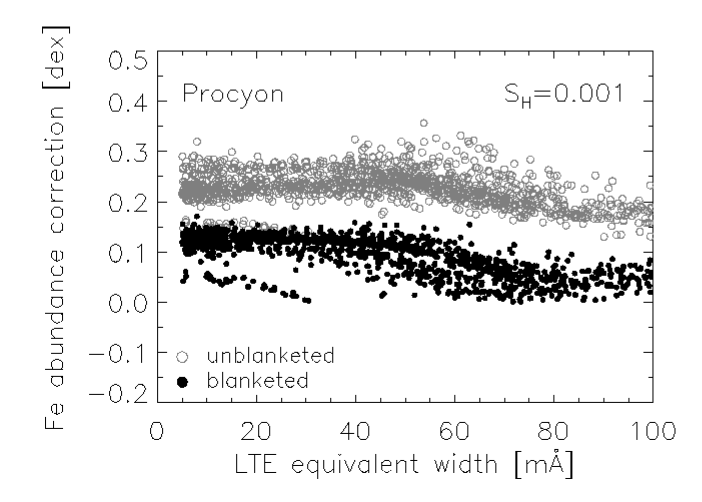
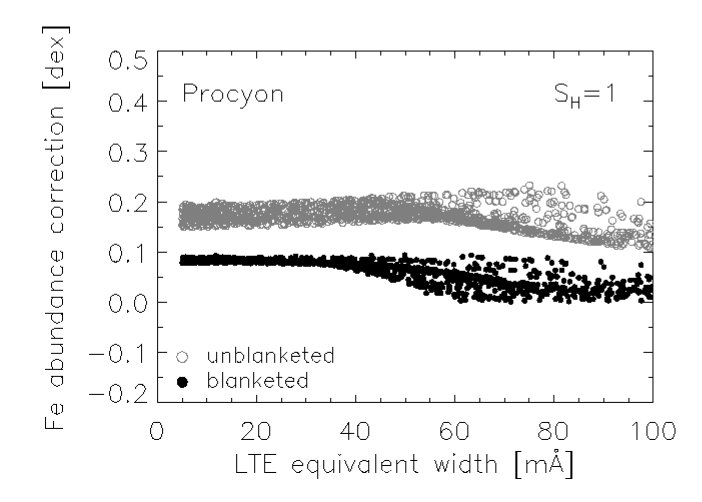
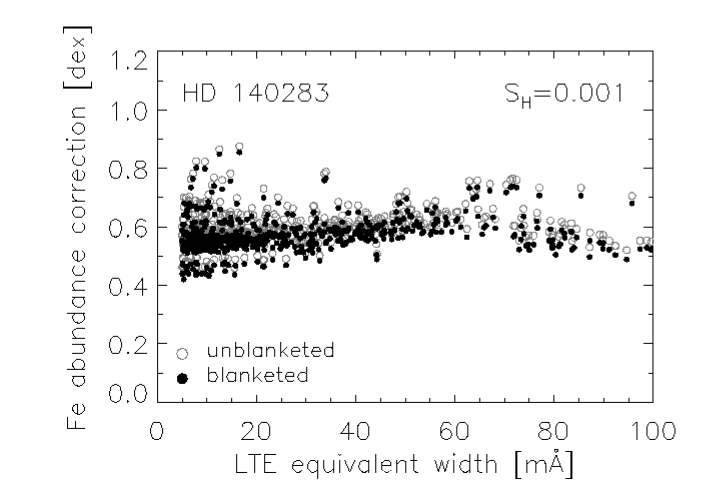
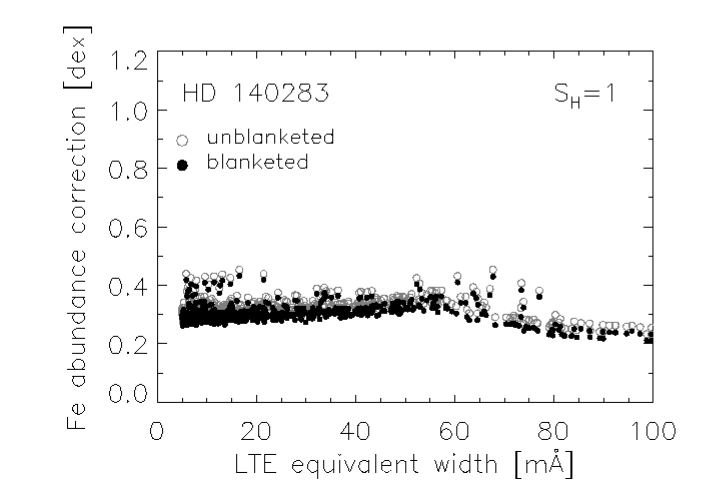
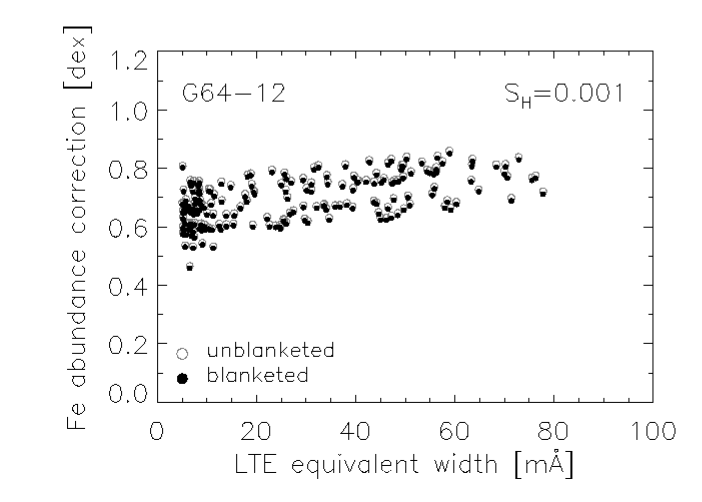
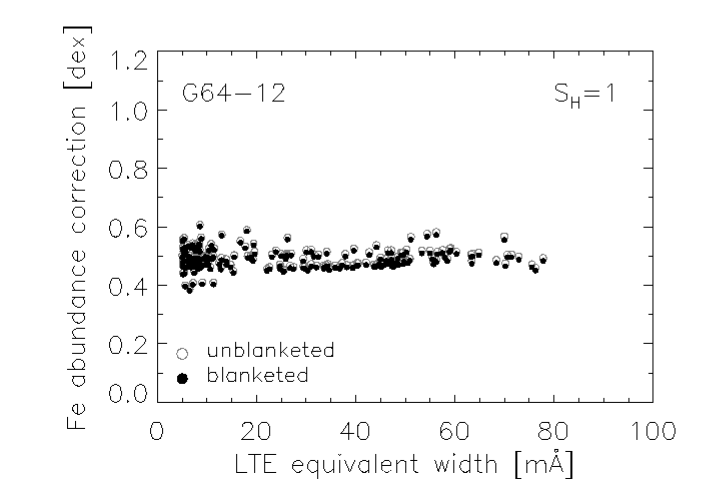
Figure 2 shows the non-LTE corrections to the iron abundance derived for the marcs model solar atmosphere for our selection of Fe i lines; the behaviour for the other two solar models is similar as summarised in Table 2. Results are presented for the two different efficiencies of Drawinian collisions adopted in this study, and , and for both the case including line-blocking and the one excluding it.
As a consequence of over-ionisation the overall line opacity of weak neutral iron lines decreases and the lines form deeper into the atmosphere in non-LTE than with the assumption of LTE, as already shown by Athay & Lites (athaylites (1972)). The equivalent widths of these lines thus decrease and therefore a positive correction has to be applied to the LTE iron abundance derived from Fe i lines. As expected, the non-LTE effects are more severe in models with a steeper temperature structure in the line forming layers as the val-3c model (see discussion in Asplund asplund2 (2005)).
Let us first examine the abundance corrections in the case of low-efficiency H i collisions. When background line opacities are not included in the calculations we estimate a correction to the iron abundance of about dex for the weak ( mÅ) solar Fe i lines in our sample with little dependency on the equivalent width . Weak lines form generally deep in the stellar atmosphere where the source function is given by the local Planck function and the non-LTE equivalent width reflects mainly Fe i depopulation in the region of line formation. Stronger lines ( mÅ) on the contrary form further out where the source function at line centre typically falls below the Planck function compensating in part for the effects of Fe i depletion on the line strength (Saxner saxner (1984)).
With the inclusion of sampled background line opacities in the calculations the mean intensity field at a given depth decreases and so do the radiative ionisation rates which are given by where indicates the photo-ionisation cross-section. A lower ratio between radiative ionisations and recombinations and therefore a weaker over-ionisation are expected. Consequently the non-LTE abundance corrections also decrease and fall to values of about dex (average over lines with between and mÅ).
We investigated as well the effects of line-blocking when multiplication factors were applied to the continuum opacities to simulate the UV line haze according to the recipe of Bruls et al. (bruls (1992)). The results indicate that over-ionisation is indeed reduced in this case but by a smaller amount: the predicted Fe i non-LTE abundance corrections remain about dex higher than in our calculations with line-blocking. The reason for the difference is that the technique by Bruls et al. (bruls (1992)) results in overall lower mean background opacities than in the case of the full opacity sampling method.
When the rates of collisions with neutral hydrogen are increased () a lower degree of over-ionisation is achieved as expected due to increased thermalisation. The equivalent widths of non-LTE weak neutral iron lines therefore increase and the overall non-LTE abundance correction is reduced as illustrated in Fig. 2 and in Table 2. Because of the overall lower non-LTE abundance corrections, the impact of background line opacities is less pronounced with a difference of about dex between the calculations including and excluding line-blocking at solar metallicity.
Concerning Procyon (Fig. 2), departures of abundance from LTE calculations are similar to the solar case with and without line-blocking (Table 2). Because of its higher and lower Procyon shows slightly larger non-LTE iron abundance corrections than the Sun for weak Fe i lines. Multiplication factors from Bruls et al. (bruls (1992)) were calibrated specifically for the solar atmosphere and therefore were not applied to simulate line-blocking in Procyon’s atmosphere.
| non-LTE Abundance Corrections from Fe ii Lines | ||||
|---|---|---|---|---|
| Model | No blocking | With blocking | No blocking | With blocking |
| Sun (marcs) | ||||
| Sun (hm) | ||||
| Sun (val-3c) | ||||
| Procyon | ||||
| HD~140283 | ||||
| G64-12 | ||||
In contrast to the solar metallicity case, the inclusion of the line haze at low metallicities produces minor changes in terms of mean intensity due to the overall low contribution of lines to the total opacities. The exclusion of background line opacities still produces systematically larger mean intensities at all depth and therefore generally increases photo-ionisation rates and non-LTE abundance corrections but only very slightly so. The difference between the results of calculations with and without line-blocking is typically only dex for both HD~140283 and G64-12.
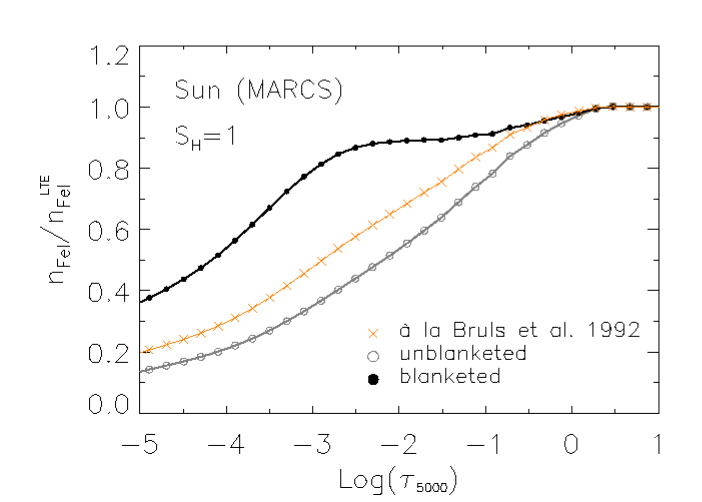
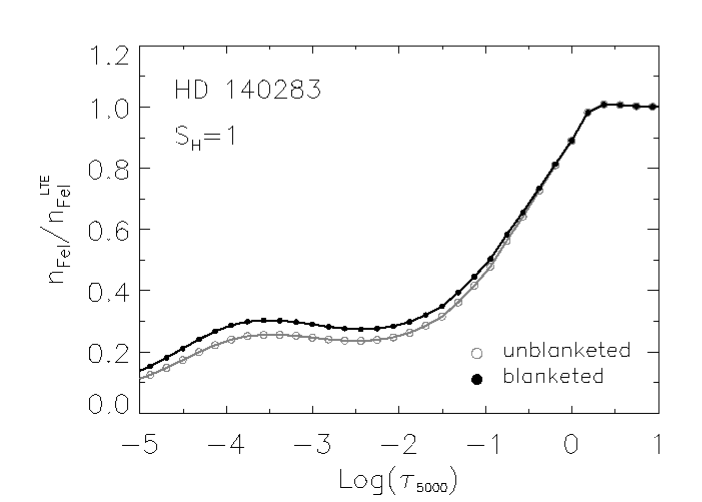
Figure 4 illustrates the effects of line-blocking on the departure from LTE of total Fe i number density as a function of depth for the marcs model atmospheres of the Sun and the metal-poor HD~140283; the departure coefficients for individual Fe i levels are all similar and considerable in the latter case. At solar metallicity the inclusion of line-blocking significantly reduces the departure of the Fe i population from LTE in the region where most weak lines form. On the contrary at low metallicity calculations with and without line-blocking produce very similar and significant non-LTE signatures for a large portion of the line forming region in the atmosphere. Due to the overall low contribution of the line haze to the opacities at low metallicities, the mean intensities are typically larger than at solar metallicity. Consequently photo-ionisation rates are higher and departures from LTE more pronounced in metal-poor stars. In fact the departure of Fe i population from LTE in metal-poor stars is controlled primarily by the efficiency of the H i collisions. Changing the scaling factor in Drawin’s formula from to decreases the non-LTE abundance corrections by dex for the metal-poor stars studied here.
It is clear that taking account of line-blocking is important for the Fe i non-LTE line formation at solar metallicity but significantly less so at low metallicity. Instead, the dominant source of error in metal-poor stars is the treatment of inelastic H i collisions, with the non-LTE abundance corrections differing by dex when using and (Table 2). While our results for the metal-poor case with are very similar to the findings of Korn et al. (korn (2003)) with no hydrogen collisions, we note that our Fe non-LTE abundance corrections with are still significantly larger than in their calculations. The main reason for this is that in addition to using even more efficient H i collisions (), they also more importantly enforce ad-hoc thermalisation of the uppermost levels of Fe i with the ground level of Fe ii. Since the latter is the dominant state and is well described by LTE, all Fe i levels are steered closer to the LTE solution by bound-bound collisions within the Fe i system. In fact test calculations performed with their model atom for HD~140283 and with but no enforced thermalisation of highly excited Fe i levels produce similarly large non-LTE effects, i.e. dex compared with our value of dex (Korn 2005, private communication). Our non-LTE abundance corrections are also much larger than the corresponding computations of Gratton et al. (gratton (1999)), which is not surprising given their very efficient H i collisions () and their use of considerably smaller photo-ionisation cross-sections than those of Bautista et al. (bautista (1997)).
Overall we find slightly larger non-LTE corrections than Thévenin & Idiart (thevenin (1999)) even when we consider fully efficient H i collisions () as it was actually used in their work. On the other hand the approach of Thévenin & Idiart (thevenin (1999)) is not identical to ours. Their Fe i and Fe ii systems were not merged and their analysis relied on a different suite of model atmospheres. As mentioned before our treatment of line-blocking differs from theirs as they used multiplication factors to account for the background line haze in a similar way as Bruls et al. (bruls (1992)) did for the solar case.
Finally concerning Fe ii lines, Table 3 shows the non-LTE abundance corrections estimated for weak singly ionised iron lines in the visible and near UV. Contrary to what is often assumed Fe ii lines are not exempt from non-LTE effects. Departures of Fe ii lines from LTE can be substantial especially at low metallicity. In particular, in the case of low H i collisions non-LTE abundance corrections of about dex are found for metal-poor stars. Similar corrections for HD~140283 are also reported by Shchukina et al. (shchukina2 (2005)). For fully efficient H i collisions corrections are however much lower although not completely vanishing at low metallicity. We note that the net non-LTE effect (i.e. ) is quite similar for and . It may therefore be difficult to empirically discriminate between different choices of on the basis of observations alone.
4 Conclusions
We have investigated the effects of line-blocking on non-LTE abundances derived from Fe i lines for a selection of four representative late-type stars. We found the effects of line-blocking to be significant at solar metallicities. In particular calculations including background line opacities result in non-LTE abundance corrections dex higher than in calculations excluding them, depending on the efficiency of H i collisions à la Drawin ( and respectively). On the other hand line-blocking has a much smaller impact at low metallicities. Absolute non-LTE abundance corrections are in this case significant and sensitive mainly to the strength of H i collisions and vary only by dex between calculations with and without line-blocking. At the present time the main uncertainty in non-LTE line formation calculations in metal-poor stars is still the treatment of the poorly known inelastic H i collisions and whether or not thermalisation of the highly excited Fe i levels should be applied.
Acknowledgements.
RC and MA have benefitted from travel support from STINT (The Swedish Foundation for International Cooperation in Research and Higher Education). MA acknowledges generous financial support from the Australian Research Council. The authors would also like to thank A. E. García Pérez for help during the early stages of the project, M. Carlsson for sharing his expertise on numerical radiative transfer and non-LTE line formation, P. Barklem and A. Korn for fruitful discussions on the role of H i collisions and B. Gustafsson for valuable suggestions to the manuscript.References
- (1) Allende Prieto, C., García López, R. J., Lambert, D. L. & Gustafsson, B. 1999, ApJ, 527, 879
- (2) Andretta, V., Doyle, J. G. & Byrne, P. B. 1997, A&A, 322, 266
- (3) Athay, R. G. & Lites, B. W. 1972, ApJ, 176, 809
- (4) Asplund, M., Gustafsson, B., Kiselman, D. & Eriksson, K. 1997, A&A, 318, 521
- (5) Asplund, M. 2005, ARA&A, 43, in press
- (6) Barklem, P. S., Belyaev A. K. & Asplund, M. 2003, A&A, 409, L1
- (7) Bayazitov, U. Sh. 2003, A&AT, 22, 855
- (8) Belyaev A. K., Grosser, J., Hahne, J. & Menzel, T. 1999, Phys. Rev. A, 60, 2151
- (9) Belyaev A. K. & Barklem, P. S. 2003, Phys. Rev. A, 68, 62703
- (10) Bautista, M. A. 1997, A&AS, 121, 211
- (11) Bruls, J. H. M. J., Rutten, R. J. & Shchukina, N. G. 1992, A&A, 265, 237
- (12) Carlsson, M., 1986 Uppsala Astron. Obs. Rep., 33
- (13) Cox, A. N. 2000, Allen’s astrophysical quantities, AIP press (Springer-Verlag, New York), A. N. Cox ed.
- (14) Drawin, H. W. 1968, Z. Phys., 211, 404
- (15) Drawin, H. W. 1969, Z. Phys., 225, 483
- (16) Fleck, I., Grosser, J., Schnecke, A., Steen W. & Voigt, H. 1991, J. Phys. B 24, 4017
- (17) Fuhrmann, K. 1998, A&A, 330, 626
- (18) Gehren, T., Butler, K., Mashonkina, L., Reetz, J. & Shi, J. 2001, A&A, 366, 981
- (19) Gehren, T., Korn, A. & Shi, J. 2001, A&A, 380, 645
- (20) Gratton, R. G., Carretta, E., Eriksson, K. & Gustafsson, B. 1999, A&A, 350, 955
- (21) Gratton, R. G., Bonifacio, P., Bragaglia, A., et al. 2000, A&A, 369, 87
- (22) Grevesse, N. & Sauval, A. J. 1998, Space Sci. Rev., 85, 161
- (23) Gustafsson, B. 1973 Uppsala Astron. Obs. Ann., 5, No. 6
- (24) Gustafsson, B., Edvardsson, B., Eriksson, et al. 2005, in preparation
- (25) Holweger, H. & Müller, E. A. 1974, Sol. Phys., 39, 19
- (26) Johansson, S., Derkatch, A., Donnelly, M. P., et al. 2002, Phys. Scr, T100, 71
- (27) Kraft, R. P. & Ivans, I. I. 2003, PASP, 115, 143
- (28) Korn, A., Shi, J. & Gehren, T. 2003, A&A, 407, 691
- (29) Kurucz, R. L. & Bell, B. 1995 Atomic Line Data, Kurucz CD-ROM No. 23., Smithsonian Astrophys. Obs., Cambridge, Mass.
- (30) Lambert, D. L. 1993, Phys. Scr, T47, 186
- (31) Li, Z. S., Lundberg, H., Sikström, C. M. and Johansson, S. 1999, Eur. Phys. J. D, 6, 9
- (32) Nave, G., Johansson, S., Learner, R. C. M., Thorne, A. P. & Brault, J. W. 1994, A&AS, 94, 221
- (33) Nissen, P. E., Høg, E. & Schuster, W. J. 1997, in: ESA Hipparcos Symposium, ESA SP-402, 225
- (34) van Regemorter, H. 1962, ApJ, 136, 906
- (35) Rutten, R. J. & Kostik, R. I. 1982, A&A, 115, 104
- (36) Rutten, R. J. 1988, In: Physics of formation of Fe ii lines outside LTE, Viotti, R., Vittone, A., & Friedjung, M., (eds.), IAU Coll., 94, 185
- (37) Saxner, M. 1984, Acta Univ. Ups. (Ph. D. thesis)
- (38) Shchukina, N. & Trujillo Bueno, J. 2001, ApJ, 550, 970
- (39) Shchukina, N., Trujillo Bueno, J. & Asplund, M. 2005, ApJ, 618, 939
- (40) Steenbock, W. & Holweger, H. 1984, A&A, 130, 319
- (41) Sugar, J. & Corliss, C. 1985, J. Phys. Chem. Ref. Data 14, Suppl. 2
- (42) Thévenin, F. & Idiart, T. P. 1999, ApJ, 521, 753
- (43) Vernazza, J. E., Avrett, E. H. & Loeser, R 1981 ApJS, 45, 635