The Draco dwarf galaxy in the near-infrared
With the William Herschel Telescope in La Palma we made observations of an area of about of the Local Group galaxy Draco. This allows us to describe Draco’s late-type stellar population across the whole galaxy at a photometric level mag deeper than the 2MASS survey. We detected the red giant branch (RGB) and measured the magnitude of the tip of the RGB in the three bands. From that in the band we obtain a distance modulus of , in excellent agreement with a measurement from RR Lyrae stars. The peak of the histogram at different suggests that Draco has a mean [Fe/H] while fiducial RGB tracks of Galactic globular clusters indicate a mean [Fe/H] where the error corresponds to the spread around the mean value. There are significant differences between the colour-magnitude diagrams of stars in the inner, medium and outer areas of the galaxy. A metal poor (Z) intermediate-age population (about Gyr old) is clearly present and emerges in particular between and from the centre of the galaxy. A few additional carbon star candidates have been identified from both their location in the colour-magnitude diagram and from an indication of variability. The large scale distribution of late-type stars is smooth but irregular in shape; this points at a variation of inclination with radius.
1 Introduction
The faint low surface brightness elliptical Local Group galaxy Draco (, ; Piatek et al. pia (2002)) is located at about kpc (Aparicio et al. apa (2001), Nemec nem (1985)) from the Sun. Bonanos et al. (bon (2004)) derived a distance modulus of (stat)(syst). Its size is approximately and about kpc along the line of sight (Aparicio et al. apa (2001)). The foreground reddening (; Stetson 1979b ) is lower than expected for a galaxy at a galactic latitude . The spread in magnitude among RR Lyrae stars within the galaxy shows no evidence for internal dust (Bonanos et al. bon (2004)).
The optical colour-magnitude diagrams show a well-defined horizontal branch (HB) and a red giant branch (RGB) without a signature of the RGB bump although deep enough observations have been performed (Bellazzini et al. bel (2002)). The diagrams are similar to those of globular clusters and indicate the dominance of an old and metal-poor population (Stetson 1979a , Baade & Swope bad (1961)). The location and width of the RGB is consistent with a mean metallicity [Fe/H] dex (Carney & Seitzer car (1986)). Differences in temperature and spectral properties on the upper giant branch stars indicate the presence of both RGB and AGB stars (Stetson ste80 (1980)). The main-sequence turnoff corresponds to an age of about Gyr and there is an almost negligible younger population (Stetson et al. ste85 (1985)). Observations with the Hubble Space Telescope (Grillmair et al. gri (1998)) showed that: (i) the stars formed primarily in a single epoch; (ii) the initial mass function is very similar to that in the solar neighbourhood; and (iii) there is a non-negligible fraction of blue stragglers (Carney & Seitzer, car (1986)). From simulations of the colour-magnitude diagram while accounting for the abundance pattern within the galaxy Ikuta & Arimoto (iku (2002)) concluded that over a long star forming period ( Gyr) the star formation rate was low (% of that of the solar neighbourhood); the stripping of interstellar gas by the Milky Way Galaxy perhaps ended the star formation in Draco. The intensity of diffuse Hα (Gallagher et al. gal (2003)) implies a mass of the ionised gas below % of the stellar mass. This limit is 10 times larger than the upper limit for the mass of neutral hydrogen (Young you (1999)).
A few hundred variable stars have been identified in various surveys. The most numerous are RR Lyrae stars but there are also Cepheids (Baade & Swope bad (1961), Deupreee & Hodson deu (1977), Nemec nem (1985), Bonanos et al. bon (2004)). The Sloan Digital Sky Survey covered the entire galaxy; cross-identifications with existing optical catalogues gave additional candidate variable stars (Rave et al. rav (2003)).
Star counts show that the Draco galaxy is elliptical with an eccentricity , a position angle of the major axis of and a cutoff radius in the long axis around (Hodge hod (1964), Irwin & Hatzidimitriou irw (1995), Odenkirchen et al. ode (2001)). The Odenkirchen et al. paper shows that the spatial distributions of giants, horizontal branch, and sub-giant stars down to i within an area of around the centre argues against tidal effects. This conclusion was also reached by Piatek et al.(pia (2002)). Deeper optical photometry by Wilkinson et al. (wil (2004)) confirmed a break in the light profile at and a decline in the velocity dispersion outside which imply the existence of a kinematically cold population in the outer part of the galaxy. On the other hand, there is no difference between the scale length of the distribution of old ( Gyr) and intermediate-age ( Gyr) stars and both populations were either formed under the same kinematic conditions, or any initial difference was afterwards erased (Aparicio et al. apa (2001)).
Spectra of giant stars in Draco have been obtained since the early 1970s in order to derive the abundance of the heavier elements and other stellar parameters (Hartwick & McClure hart (1974)). The results showed that within the galaxy there is a spread in [Fe/H] of at least 1.53 dex (Shetrone et al. 2001b , Shetrone et al. she98 (1998), Zinn zin78 (1978)) and that giants in Draco are metal poor ([Fe/H]) compared to giants in Milky Way globular clusters (Canterna can (1975), Stetson ste84 (1984), Winnick win (2003)). In fact the location of stars redward of the fiducial RGB sequence, indicate that these stars have a higher metallicity but still below [Fe/H] dex; they must be carbon stars (Shetrone et al. 2001b ). Inhomogeneities in the [Ca/H] and [Mg/H] abundance also support an abundance spread (Winnick win (2003), Lehnert et al. len (1992)). Supernova activity may account for this spread and for the removal of about % of the original gas content (Smith smi (1984)). A handful of carbon stars were identified by Aaronson et al. (aar (1982)) and by Azzopardi et al. (azz (1986)). One of those is a symbiotic binary (Munari mun (1991)) and another is lithium-rich and probably a low-mass AGB star of low metallicity in its thermally pulsing phase after a few third dredge-up episodes (Domínguez et al. dom (2004)). Olszewski et al. (ols95 (1995)) confirmed three carbon stars as velocity variables which implies that they are likely binary stars similar to CH stars in the Milky Way halo. The sample of confirmed carbon stars was increased to six by Shetrone et al. (2001b ).
The mean velocity of the Draco galaxy, determined from different samples of stars, is km/s with a dispersion of about km/s (Hargreaves et al. har (1996), Armandroff et al. arm (1995)). This dispersion is significantly larger than the velocity dispersion of other galaxies in the Local Group, except for the Ursa Minor and Carina galaxies. The measured dispersion is not dominated by binary stars (Olszewski et al. ols (1996)) and the mass to light ratio () is consistent with the presence of a large quantity of dark matter (Hargreaves et al. har (1996)).

Our present work concerns the intermediate and old stellar population in Draco and uses new mosaic observations in the , and bands. Observations and data reduction are described in Section 2 while in section 3 we discuss the distribution of sources in the colour-colour and colour-magnitude diagrams at different distances from the centre; we also discuss the contamination by foreground stars. Section 4 presents a determination of the distance to the galaxy, a discussion about variations in age and metallicity of the stellar population across the galaxy and a discussion of known carbon stars. Conclusions are given in Section 5.
2 Observations & Data Reduction
Observations in the , and bands were obtained with the 4.2 m William Herschel Telescope (WHT) on La Palma (Spain) during the same runs described in Cioni & Habing (cio05 (2005)). Due to the large extent in the sky a mosaic of images was required in all three bands. In particular we obtained images of in the and band and images of ′′ in the -band. In the -band we used exposures of s, s and s and and images were obtained by co-adding images out of of a single dithered position each with an exposure time of s. In total we covered an area of about centred at :: and ::.
The processing of raw images was done using the IRAF software and following the same procedure described in Cioni & Habing (cio05 (2005)) with a few minor differences: sky frames in the near-infrared (near-IR) wave bands were obtained averaging uncrowded target images; - the same fringe image was used to correct long and short -band exposures. Near-IR images were combined in columns per band ( images per column) while -band images were combined in one single image using the spatial overlap. Each near-IR column was matched to the -band image to find source counterparts. Note that there was no overlap among near-IR columns ( no overlap in right ascension), while the overlap in declination was quite large () to compensate for the effects of image distortions.
Sources were extracted using the SExtractor program (Bertin & Arnout sex (1996)). The flux corresponding to each source was calculated within an aperture of pixels, a detection threshold of , an analysis threshold of . In the SExtractor configuration files we used these parameters as well as the parameters that characterise the detector and default values for the remaining keywords. Sources were extracted first in each wave band separately. Afterwards and detections were matched using an association radius of pixels ( pix /pix ) to account for possible field distortions, although and images were aligned before extracting individual sources. The nearest source was kept as a counterpart and the resulting catalogue was filtered to retain only sources with (this artificial cut is shown at faint magnitudes and red colours in Fig. 5. The cross–identification of –band sources was made separately for each near-IR column. In practice an -band column-image was extracted from the full -band image to match a given near-IR column (i.e. by aligning common sources and trimming the area). Sources were matched using the same criteria but an association radius of pixels. Different association radius were initially used and the resulting matches where checked against known sources. Finally wrong associations were removed by accepting only pairs for which and . This criteria combines both position, magnitude and colour which guarantees a statistical match of similar sources and accounts for field distortions. The -band field of view is rather large () and distortions at the far edges are non-negligible. With a smaller matching radius we would have lost a few bright counterparts (those located at the edges of the field-of-view). However because of the image alignment and because we retained the closest match within a satisfactory colour and magnitude range good results were obtained. A few mis-matches, between the near-IR and -band magnitudes might be present among the faint stars in the catalogue. For these sources the match between and is more reliable compared to the match between and .
The photometric calibration was performed for each observing night and it is described in detail by Cioni & Habing (cio05 (2005)). Photometric zero-points in the and bands have been corrected for systematic shifts after cross-identification with 2MASS data. This process showed a systematic shift of between the astrometry of the two data sets were the error-bar indicates the dispersion of the mean. Only sources within of this value ( sources) have been used to compare the photometry obtained within similar filters. We obtain:
These shifts (partly due to different filters) are smaller than those obtained by Cioni & Habing for the NGC 6822 galaxy, probably because because Draco is not as crowded as NGC 6822, although both galaxies were observed during poor photometric conditions (i.e. thin cirrus). In the -band we applied the same shift as derived for NGC 6822 namely . This is justified because the -band observations of Draco and NGC 6822 were obtained during the same night under similar photometric conditions whereas our near-IR observations were spread over different nights.
2.1 Catalogue
Table 1 shows the first ten lines of the full table (table.dat) that is only available in the electronic edition of this article. The table contains stars detected in all three bands, and : columns and list Right Ascension and Declination in degrees at the epoch J2000, columns , and list magnitude, photometric error and SExtractor flag ( Bright neighbours or bad pixels affecting more than % of the integrated area, The object was originally blended with another), respectively; columns and contain the same information for the and bands, respectively. The table lacks sources in the gap between pairs of –band chips. We include only sources with SExtractor flag in all three wave bands. Figure 1 shows the behaviour of photometric errors for all extracted sources as a function of magnitude in each wave band and as a function of and colour.

Crowding is unimportant in Draco and there is no issue about confusion. The catalogue is almost complete down to magnitudes , and in , and but we may have missed a small percentage of sources because of missing adjacent tiles of the mosaic; this effect will be strongest in the -band. These limits correspond to a decrease in the number of sources towards faint magnitudes estimated from Fig. 2. Sources detected in one single band or only in the two infrared bands are a very small percentage of those presented in Table 1; the catalogue includes all stars in the upper RGB magnitudes (Sect. 3). These single band sources or those detected only in and will be made available upon request to the first author.
3 Results
3.1 Magnitudes and colours
3.1.1 , and histograms
Figure 2 shows the histogram of the number of sources detected in all three wave bands as a function of magnitude. The discontinuity produced by the TRGB is clearly visible in the -band but it is not obvious in the and magnitude distributions. Other discontinuities may be present; they will be considered in some detail in Sect. 3.3. The precise location of the TRGB, derived using the same technique as in Cioni et al. (2000b ), is at , and . The algorithm that determines the TRGB position starts with an estimated magnitude and a magnitude range. In the band we used as from the discontinuity in the magnitude distribution and a range of mag. This is consistent with the value derived by Bellazzini et al. (bel (2002)) and accounts for possible variations between the two photometric systems. The TRGB in the and bands has not been derived prior to this work, and so we had to derive the estimate ourselves. Using the isochrones by Girardi et al. (gir (2000)) for a Gyr old metal poor population (; this corresponds to about [Fe/H]) we derived the difference between the TRGB magnitude in the -band and those in the and bands; they are and mag, respectively. This results in initial values for the TRGB of and and the same range of mag. Madore & Freedman (mad (1995)) postulated that at least stars in the upper -magnitude bin of the RGB are needed for a robust determination of the TRGB magnitude (see also Fig.10 in Bellazzini et al. bel (2002)) and we do fulfil this criterium: we dispose of more than stars in the upper -magnitude bin in the and bands and more than in the band. Errors associated to each TRGB determination are only statistical errors. Systematic errors due to errors in the zero-point and in the calibration of the magnitude scale amount to , and . We have not removed potentially foreground stars; for Draco this is a difficult task and foreground stars are expected to have a continuous distribution in magnitude and thus have no effect on the location of the discontinuity that is the TRGB. Further considerations about foreground stars are given in Sect. 3.4.
3.1.2 (, ) colour-magnitude diagram

The colour magnitude diagram (, ) is shown in Fig. 3. It is a sparse distribution of sources and characteristic features of such diagrams cannot easily be traced. The location of the TRGB marks the distinction between fainter sources that belong either to Draco or to the foreground and brighter sources that most probably belong to the foreground except those with that may be AGB stars in Draco. Note that sources with approach the saturation limit of our observations. Only sources with have been plotted, this corresponds to sources with that represent also the most reliable matches among the three photometric bands discussed in this paper.
3.1.3 (, ) colour-colour diagram
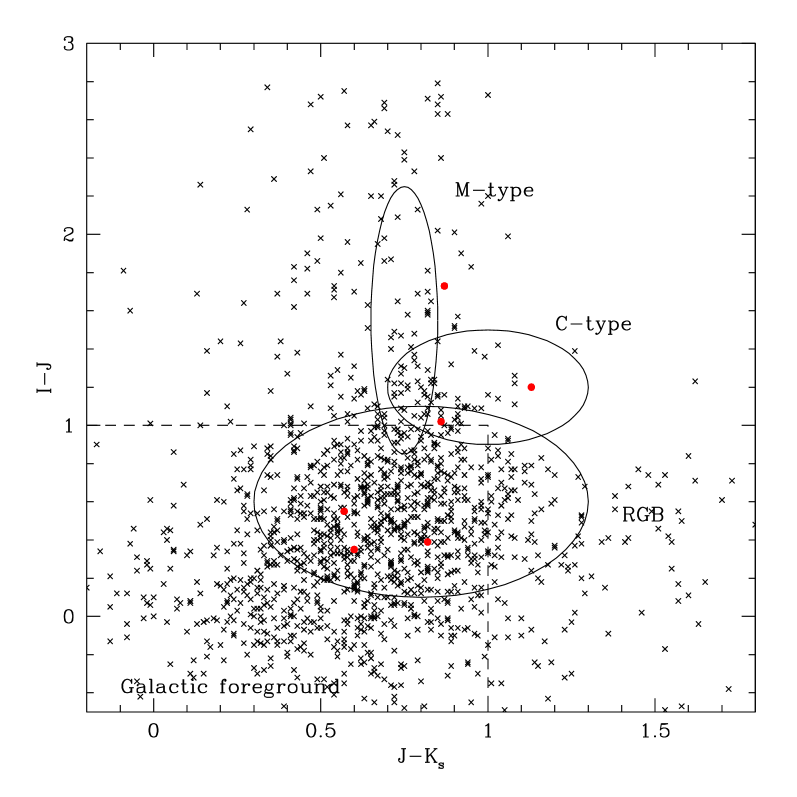
The distribution of sources in the colour-colour diagram (Fig. 4) shows no clear-cut separation between sources of a different type as was the case for the Magellanic Clouds (Cioni et al. ciomes (2004)) and for NGC 6822 (Cioni & Habing cio05 (2005)). As in Fig. 3 we have plotted only sources with . Most of the sources are concentrated at about and . There are usually very few foreground stars with and , although the expected region of RGB stars clearly overlaps with that of foreground stars. Only two known carbon stars seem to fall within the expected C-type region, some are much fainter while one is considerably brighter and approaches perhaps the region where M-type AGB stars could be located. It is important to remember that the colours of stars of a different type, and therefore the expected regions in the colour-colour diagram, depend on the age and on the metallicity of the stellar population.
3.1.4 Near-IR colour-magnitude diagram: confirmed members and non-members of Draco
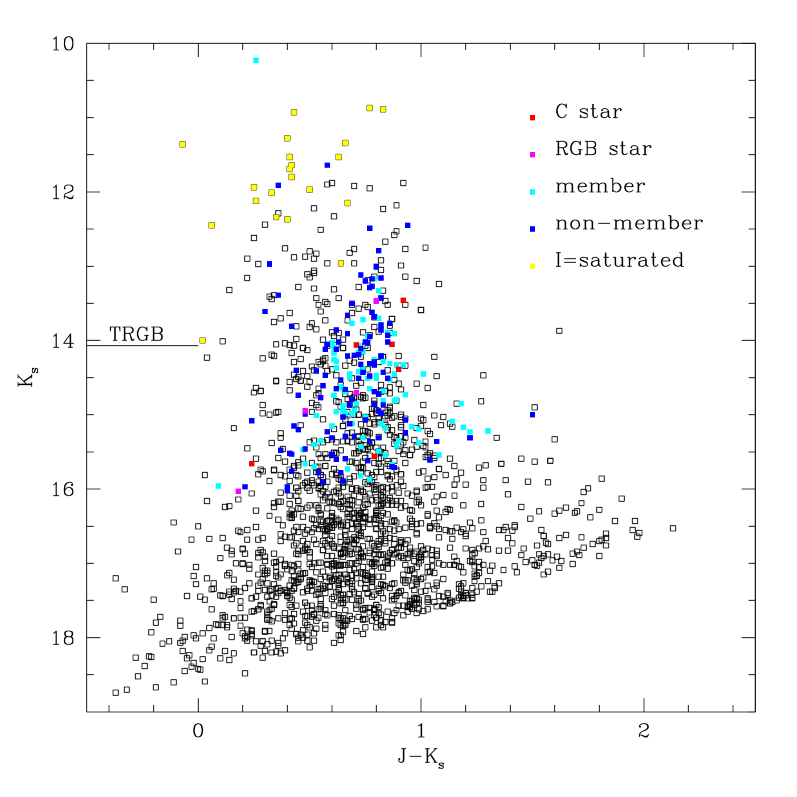
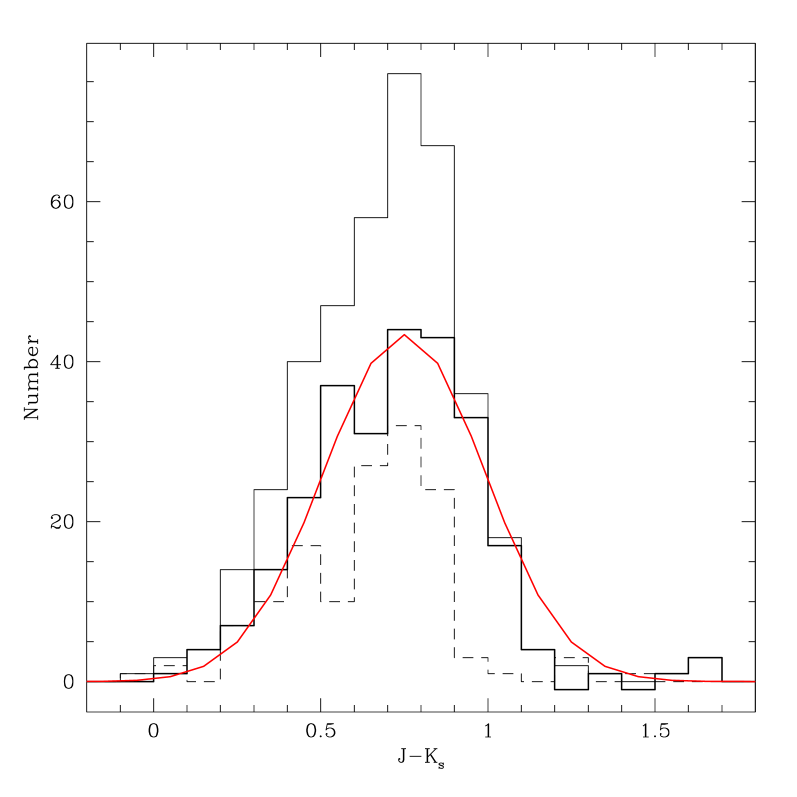
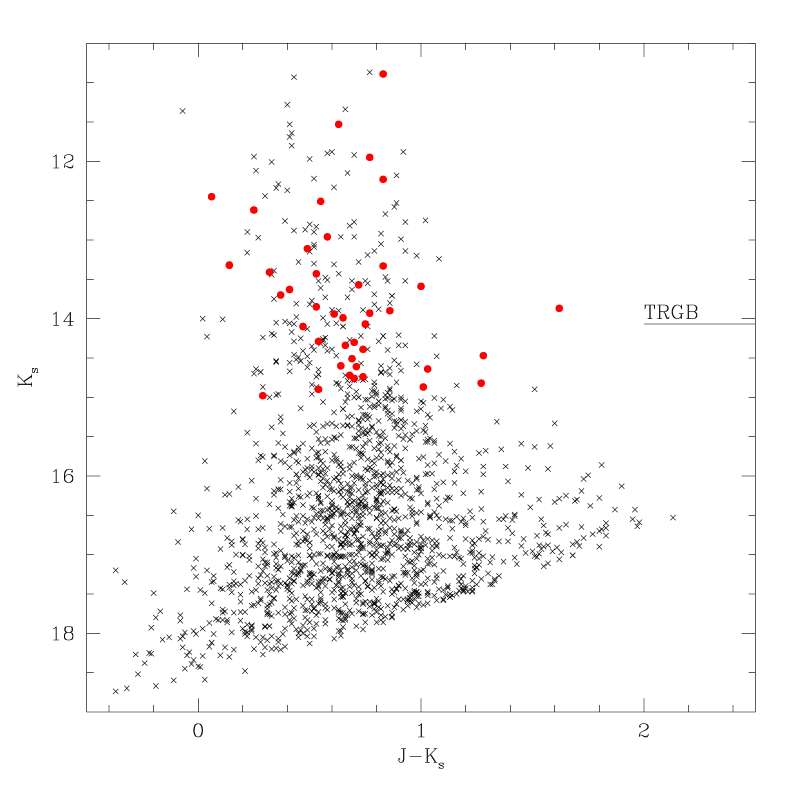
The colour-magnitude diagram (, ) of Draco stars (Fig. 5) shows a well defined and broad red giant branch. To identify the main stellar populations in this diagram we cross-correlated our catalogue (Table 1) with confirmed carbon and RGB star samples and with non-member sources as given by Shetrone et al. (2001a ). We also cross-correlated our catalogue with foreground dwarfs identified by Olszewski et al. (ols95 (1995)) and with the catalogue of confirmed members and non-members by Armandroff et al. (arm (1995)). These cross-identifications have been made using only coordinates, except for the known carbon stars that have also been checked in the corresponding images, and a few mismatches might have occurred, especially among the faintest counterparts. In Fig. 5 we used colours to mark stars identified by agreement in position and stars that are saturated in the -band (possibly foreground stars); the colours are better visible in the on-line version of the article than in its printed version. The sensitivity limit of previous observations limited our identifications to sources with . Among sources brighter than the TRGB the brightest magnitudes are likely foreground stars. Many of these have saturated the -band photometry and have predominantly . Redder sources could be intermediate-age AGB stars. One likely thermally pulsating carbon star has been identified in this region (Sect. 4.2). Along the main RGB sequence confirmed members and non-members are equally distributed and do not single out a specific region in the diagram. Figure 5 shows also the histogram of the number of sources as a function of colour for the full sample (Table 1), for the confirmed foreground stars and for the sample that remains after subtraction of the foreground. The foreground component dominates at colours and becomes negligible at redder colours. Once the foreground stars have been removed from the full sample the distribution of sources looks fairly symmetric and can be described by a Gaussian with , .
3.2 Foreground stars from 2MASS
Despite the availability of the precise location of some foreground stars discussed above (Armandroff et al. arm (1995), Olszewski et al. ols (1996), Shetrone et al. 2001a ), they cannot be used to estimate the overall foreground contamination because their parent sample was not complete. Infact Olszewski et al. (ols (1996)) observed the brightest and reddest objects selected from the literature including additional giants near the empirical RGB of Draco.

We extracted from the 2MASS catalogue sources within an area of deg2 to the North of the centre of Draco. This region is sufficiently close to Draco to provide a comparable sample of foreground stars but far enough to contain very few, if any, genuine Draco sources. Absolute magnitudes have been assigned supposing that they have the same distance modulus as the stars in Draco and that the absorption is equal to that discussed in Sect. 4.1. Figure 6 shows the distribution of the stars in the off-set areas in magnitude, colour and in the colour-magnitude diagram; the off-set areas were of two sizes that coincide with the IN region and the MED region discussed in the next Sect. 2MASS observations are not sensitive enough to a foreground contribution directly comparable with our observations but they indicate how the foreground stars are distributed on the sky. Foreground stars cover almost homogeneously a region with independently of their mag. Their number increases in proportion to the surface area. Sources with are close to the detection limit of 2MASS and have therefore larger errors. A comparison between Fig. 2 and Fig. 6 shows no gap at (); this confirms our earlier assumption that one may find the TRGB without first removing the foreground. The gap visible in the colour histogram () may have been caused by differences among the nature of foreground stars (Cioni et al. 2000a , Nikolaev & Weinberg nik (2000)), see also Fig. 5.
3.3 Distribution in three concentric areas
We take for the centre of the galaxy the location derived by Piatek et al. (pia (2002)). We have converted Right Ascension and Declination into circular coordinates and have divided the area surveyed into three regions: (inner=IN), (medium=MED) and (outer= OUT); see Fig. 7. Sources are distributed fairly homogeneously across the galaxy and do not cluster in the centre. However, there is a non-negligible difference between the near-IR colour-magnitude diagram of stars in three aspects: (i) a variation in the expected location of the TRGB, (ii) a variation in the number of stars brighter than the TRGB and (iii) a variation in the colour of the RGB.

The discontinuity attributed to the TRGB from the distribution of all sources corresponds to (using the distance modulus derived in Sect. 4.1). Although the number of objects around this magnitude is smaller within each region it is possible to distinguish other discontinuities. These are indicated with horizontal lines in Fig. 7. Considering for example the discontinuities at (IN), (MED) and (OUT) one may conclude that there is a variation of about mag between the inner and the outer region in the sense: the TRGB in the inner region is fainter than the TRGB in the outer region by about mag. The photometric error of each single source is dominated by the systematic error in the distance modulus, but as we are interested in variations in magnitude the only important error is that in the apparent magnitude; this is about mag (cfg. Fig. 1). If, in the worst-case scenario, we assume that all sources in the OUT region of Fig. 7 belong to the foreground, then we find that about % and % of the sources in the IN and MED region should also belong to the foreground; most of them would have .
The histogram of the shows that the peak increases by about mag by going from IN to MED to OUT. This is about equal to the error in the colour of each single source, but the error on the peak of each histogram decreases as and is of the order of mag. Unless the foreground distribution strongly alters the shape of these histograms (cfg. Fig. 6) we may consider the increase of mag as real.
In the colour-magnitude diagram of the IN region the RGB clearly shows a jump in the number of sources around , although the diagram clearly contains brighter magnitudes at approximately the same colour until . There are a few, even brighter sources but they have bluer colours and were found to be the foreground stars discussed below. In the MED region a major discontinuity occurs around as well as a cut off in the number of sources around . Sources with trace a clear branch about mag wide and have bluer colours compared to the main RGB traced by fainter sources. Their colour is also bluer than stars with similar magnitudes in the IN region. These sources could be metal poor intermediate-age AGB stars. Some or all of the very bright sources could be foreground sources. In the OUT region there is a major discontinuity around and perhaps a fainter discontinuity around . At much brighter magnitudes () sources are distributed rather homogeneously within a colour range of about mag. They most probably belong to the foreground, although a few AGB stars may hide among them.
3.4 Spatial distribution
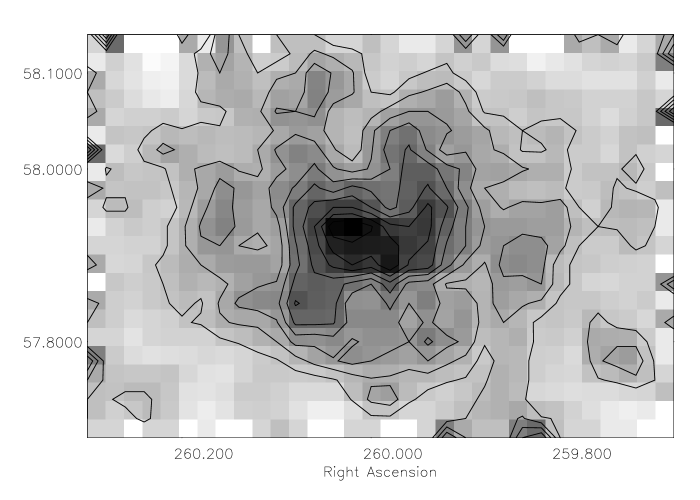
Figure 8 shows the number density of sources in in bins where a single element corresponds to about square, which is equal to about pc. The map covers an area of about and this is smaller than the cut-off radius of the density profile at optical wavelengths ()(Hodge hod (1964), Irwin & Hatzidimitriou irw (1995), Odenkirchen et al. ode (2001), Wilkinson et al. wil (2004)). The source density in Fig. 8 has been smoothed using a box car function of width prior to the construction of the grey scale image where higher concentrations of sources are indicated by darker regions. The distribution, strongly dominated by RGB stars, appears regular and elliptical with an ellipticity (where ; is the semi-major-axis and is the semi-minor-axis); and . Intermediate contours (at , and ) show an enhancement of the number of sources towards the NW and the SE corners, suggesting a variation in the inclination of the elliptical structure with radius.
4 Discussion
4.1 Determination of the distance to the Galaxy
The –band magnitude of the TRGB depends only weakly on age and metallicity (Salaris & Cassisi sal (1997)) and can thus be used as a standard candle; see Lee et al. (lee (1993)). We adopt the interstellar extinction as measured by Stetson (1979b ) of , and the absorption in the , and band derived using Cardelli’s (cardi (1989)) law. These are: , and . Combining the apparent –band TRGB magnitude derived in the previous section with the most recent absolute calibration of the TRGB magnitude in the –band by Bellazzini et al. (bel (2002)), , we obtain ; this corresponds to a distance of kpc. The systematic error quoted includes the error on the absolute magnitude and on the zero-point in the -band (; Cioni & Habing cio05 (2005)) as well as the error from the calibration of the photometry scale ().
Our determination of the distance modulus is in very good agreement with the most recent determination of the distance to the galaxy by Bonanos et al. (bon (2004)) from observations of RR Lyrae stars. It is about magnitudes smaller than the value obtained by Bellazzini et al. (bel (2002)) who already noticed the discrepancy between their result and other measurements in the literature (e.g. Mateo mat (1998)) and they attributed it to their adopted zero-age horizontal branch distance scale (Ferraro et al. fer99 (1999)). Bellazzini et al. determined for the TRGB the value (their Fig.12), and this is mag larger than ours, an acceptable difference when all uncertainties are considered. It may be that a shift in the photometric scale is responsible for this discrepancy but on the other hand Bellazzini et al. (bel (2002)) did not have enough sources to safely determine the TRGB position although they carefully introduced artificial stars. Our results of the distance to the galaxy agree with the determination by Aparicio et al. (apa (2001)) and by Nemec (nem (1985)) based on and band photometry and observations of RR Lyrae stars, respectively.
4.2 Carbon stars and other AGB stars
Shetrone et al. (2001a ) spectroscopically observed a sample of stars located on the red side of the fiducial RGB in the (, ) colour-magnitude diagram. They increased the number and membership of known carbon stars to and identified non-members by measuring radial velocities. The photometry from our study and from the 2MASS counterparts are indicated in Table 2. In this case the cross-identification between our catalogue and the 2MASS catalogue has been checked on the observed images. Source names are those commonly used except for and that have been introduced by us for completeness. Four out of these six carbon stars are located around the TRGB. The detection of Li in the brightest of them (Dominíguez et al. dom (2004)) suggests it is a thermally pulsating AGB star. Figure 5 shows that around the location of this star there is a handful of stars too red to be foreground stars (), that could eventually also be AGB stars. Spectra are needed to confirm their nature. If the population of Draco has a large spread in metallicity the TRGB will either be smeared out or be found at different magnitudes in different locations; it is not necessarily true that the fainter carbon stars will be below the TRGB (Sect. 3.3). It is difficult to distinguish oxygen-rich AGB stars, if any is present, only from photometric observations of a galaxy with a low AGB component. Oxygen-rich AGB stars will be located above the TRGB and at where foreground stars are also present or at , where carbon stars might be present. There are too few sources in this region in Fig. 5; below we give an alternative to find AGB candidates.

AGB stars often experience variations in brightness with a long period and a large amplitude. With only two infrared epochs we cannot determine the periodicity of a magnitude variation but we can obtain an indication of the minimum amplitude that such a variation would have. Figure 9 shows the difference between and magnitudes from the observations described in this paper and from the measurements extracted from the 2MASS catalogue. The photometry given in Table 1 has been already adjusted to the 2MASS photometry scale. For a significant number of sources mag and ), these are candidate variable stars and their position in the near-IR colour-magnitude diagram is indicated in the right panel of the figure. About half of the sources differing in -magnitude between the two catalogues are brighter than the TRGB, up to mag, while the other half extends to mag below the TRGB. These sources with magnitudes around the TRGB also have red colours. They are likely AGB stars and suitable targets for a spectroscopic study.
4.3 Variations in age and metallicity
4.3.1 The population in the whole area
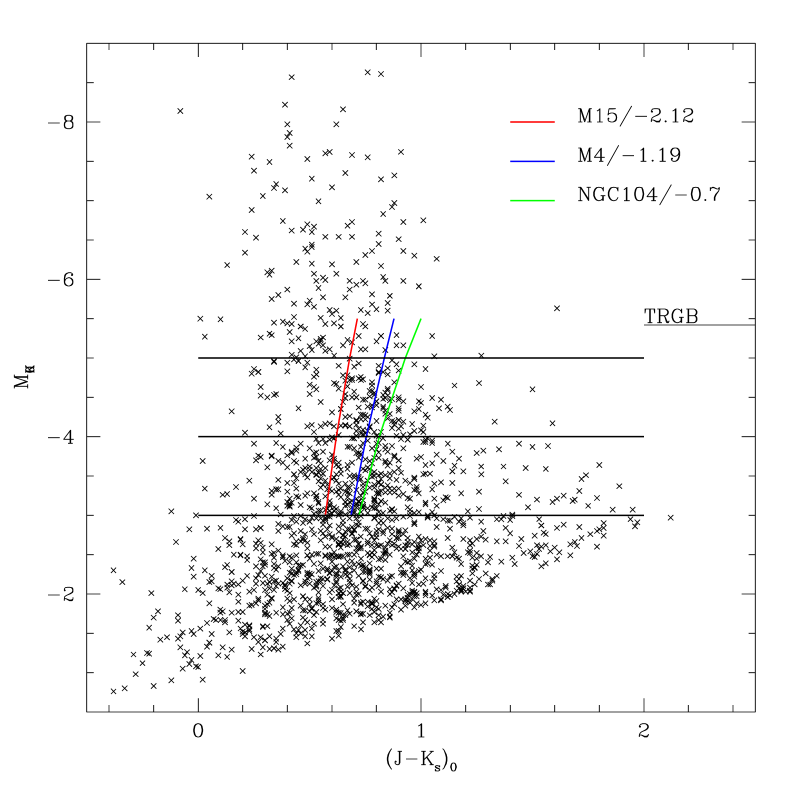

Dereddening the near-IR magnitudes and applying the distance modulus obtained in Sect. 4.1 it is possible to show that the mean metallicity of Draco is [Fe/H] (where the error is the variance of the mean). Figure 10 shows the distribution of Draco sources in the (, ) colour-magnitude diagram. These are the same sources shown in Fig. 5 and foreground stars are still included, which as can be easily judged from their location, do not affect the following discussion (at least at magnitudes where they have been confirmed). Horizontal lines indicate the location of photometric indices that may be used to determine [Fe/H] (Valenti et al. val (2004)). In Fig. 10 we show the histogram of all sources fainter than the TRGB (RGB stars only) and three histograms of stars within mag from the reference magnitudes , and . The first histogram shows a fairly symmetric distribution centred at with FWHM. The other three histograms peak at , and , respectively, and are not symmetric. According to Valenti et al. (val (2004)) the peak colours correspond to [Fe/H], and , for the three histograms, respectively. These results do not allow us to safely determine the slope of the RGB, especially considering that our observations, though about mag deeper than 2MASS observations, do not reach the base of the RGB (about mag below the TRGB). They confirm, however, that a metallicity spread within the galaxy does exist that amounts to about dex (variance of the mean) around a mean value of dex. Both the mean and the spread agree with other measurements in the literature (e.g. Hartwick & McClure har (1996), Carney & Seitzer car (1986), Shetrone et al. 2001b , Zinn zin78 (1978), Winnick win (2003)).
However three facts need to be considered: (i) there is a systematic error in the colour due to the adjustment of the photometry to the 2MASS catalogue, (ii) metal poor AGB stars are present at and (Sect. 4.3.2) and (iii) the foreground contribution at faint magnitudes () has not been determined. Though the statistical error in the colour is about mag, because of the larger error in the band compared to the band, it decreases with the number of sources in each bin as and it becomes on average . The systematic error on the colour amounts to about mag which corresponds to an average spread in the calculation of [Fe/H] using the Valenti et al. (val (2004)) indexes of about dex. If indeed sources with and are metal poor intermediate-age AGB stars they should be excluded from the analysis of the slope of the RGB. This is equivalent to reduce the peak in the histogram of sources with . We have seen in Sect. 3 that Galactic foreground with stars have () colours; their number is expected to increase at fainter magnitudes and their colour to cover a larger region if photometric errors become also large (which is usually the case approaching the sensitivity limit of the observations). Therefore we conclude that the colour of the RGB both at and are uncertain.
Another way to estimate the metallicity from the (, ) colour-magnitude diagram is to compare it with fiducial lines of Galactic globular clusters with known metallicities distance and reddening (e.g. Ferraro et al. fer00 (2000)). This comparison with clusters M15, M4 and NGC 104 is also shown in Fig. 10. These clusters have [Fe/H], and , respectively. The thickness of the rather dispersed diagram of Draco sources is fitted well by the RGB of these clusters indicating an average [Fe/H] dex. A fit of the TRGB is also clear indicating that the majority of Draco stars are as old as Galactic clusters.
4.3.2 The population in three concentric areas
Theory predicts that in two samples of equal age the TRGB is brighter in the sample with higher [Fe/H]. If the metallicity is the same, the TRGB is fainter in the older sample. Using the isochrones by Girardi et al. (gir (2000)) we have calculated the difference in the TRGB position between populations of and Gyr old and between populations with Z ([Fe/H]) and Z= ([Fe/H]); these values were selected because we expect Draco to be dominated by an old and metal-poor population. The difference in TRGB magnitude equals mag when the two samples differ in age and not in metallicity and to mag when they differ in metallicity but not in age. On average a difference of about is expected by a variation of either metallicity or age. Between a pair of regions (e.g. IN-MED) we measure a difference of about mag in the location of the TRGB (Fig. 7) and this can only be explained by both a variation in age and metallicity. The colour of the RGB is also affected by variations in age and metallicity: at a constant metallicity younger stars have bluer RGBs while at a constant age the RGB of metal rich stars is redder than the RGB of metal poor stars. The average colour variation in either age or metallicity expected from the same populations discussed above amounts to mag. This is of the same order as the variation in colour between a pair of regions and can thus be explained by a variation in age or metallicity only or by a combination of both. However, the difference in colour between the IN and the OUT regions is twice larger and must be due to both age and metallicity. Another non-negligible contribution to variations of the TRGB location is of course a variation in distance within the galaxy. Aparicio et al. (apa (2001)) suggested that Draco extends about kpc along the line of sight. This corresponds to a variation of about mag in the TRGB position!
We now discuss the apparent discontinuities in the star counts shown in the lower part of Fig. 7. The brighter discontinuity in the IN region is equally well described by Z and age Gyr as by Z and age of Gyr while the fainter discontinuity, if due to RGB stars at the TRGB, is better represented by a slightly more metal-rich population of comparable age. It is important, however, to be very careful in deciding which isochrone best fits the distribution of sources because photometric errors in are dominated by the systematic error in the distance modulus ( mag) while errors in the are dominated by the error in the magnitude and affected by a systematic error of about mag (Sect. 2). These errors do not allow us to make firm statements about an absolute age or metallicity in a given region but they permit the analysis of differences among the regions. In the MED region stars that produce the bright discontinuity are bluer than stars with similar magnitudes in the IN region. This means that in the MED region they are either AGB stars with Z and age Gry or RGB stars with Z and age Gyr. There is no evidence of such a young population of giant stars from optical studies although a burst of star formation may have happened Gyr ago (Aparicio et al. apa (2001)). The fainter discontinuity can be explained by a population with Z and age Gyr while a population with Z is bluer than the observed RGB unless a systematic photometric shift is needed, i.e. the difference is due to measurement errors. The two discontinuities in the OUT region, because of the progressive reddening of the RGB, could be due to a population of increased metallicity (that could be as young as a few Gyr). The thickness of the RGB around suggests the presence of also a metal poor population, but at these faint magnitudes and blue colours foreground stars have not been studied and their distribution and number may bias this conclusion.
Summarising: if most of the Draco population is as old as the Universe ( Gyr; Bennett et al. ben (2003)) then its metallicity increases with radius, which is against the usual trend. Otherwise if the spread in metallicity is not very large then the variation in age must be large and must increase with radius in agreement with the usual trend. However, deeper and more accurate photometric data as well as a treatment of the orientation of the galaxy will better constrain these suggestions.
5 Summary and Conclusions
In this paper we report observations in the , and band covering about of the Draco galaxy. The photometry has been calibrated to the DENIS catalogue in the band and to the 2MASS catalogue in the and bands. The cross-identification with catalogues of confirmed members, non-members, carbon and RGB stars has helped us to to evaluate the effect of the foreground contribution which has also been discussed using 2MASS stars in a comparable field North of the centre. Many RGB stars have been detected as well as candidate AGB stars. The TRGB location in the -band has been used to derive a distance modulus for the galaxy of in agreement with values in the literature and the most recent determination from RR Lyrae stars (Bonanos et al. bon (2004)). The surface distribution of all detected sources traces a smooth and elliptical structure with and PA also in very good agreement with previous measurements (Hodge hod (1964), Odenkirchen et al. ode (2001)), and suggests a variation of the inclination with radius.
The study of the distribution of stars in the colour-magnitude diagram revealed a population with an average [Fe/H] of dex (or dex) with a spread of dex (or at least dex) using the Valenti et al. (val (2004)) photometric indexes (or by comparison with the fiducial RGB tracks of a few Galactic clusters). The Girardi et al. (gir (2000)) isochrones of two populations with [Fe/H] and [Fe/H] better represent the colour-magnitude diagrams of sources located in three concentric regions. They show a non-negligible intermediate-age population even though most of the stars are as old as the age of the Universe in agreement with Aparicio et al. (apa (2001)) who derived that some % of the stellar population of Draco is older than Gyr.
Acknowledgements.
We would like to thank the anonymous referee for comments and suggestions that clearly improved the manuscript. This paper makes use of data products from the Two Micron All Sky Survey, which is a joint project of the University of Massachusetts and the Infrared Processing and Analysis centre/California Institute of Technology, funded by the National Aeronautics and Space Administration and the National Science Foundation.References
- (1) Aaronson, M., Liebert, J., Stocke, J. 1982, AJ, 254, 507
- (2) Aparicio, A., Carrera, R., Martínez-Delgado, D. 2001, AJ, 122, 2524
- (3) Armandroff, T.E., Olszewski, E.W., & Pryor, C. 1995, AJ, 110, 2131
- (4) Azzopardi, M., Lequeux, J., & Westerlund, B.E. 1986, A&A, 161, 232
- (5) Baade, W. & Swope, H.H. 1961, AJ, 66, 300
- (6) Bellazzini, M., Ferraro, F.R., Origlia, L., et al. 2002, AJ, 124, 3222
- (7) Bennett, C.L., Halpern, M., Hinshaw, G., et al. 2003, ApJS, 148, 1
- (8) Bertin, E. & Arnout, S. 1996, A&AS, 117, 393
- (9) Bonanos, A.Z., Stanek, K.Z., Szentgyorigvi, A.H., et al. 2004, AJ, 127, 861
- (10) Canterna, R. 1975, ApJ, 200, L63
- (11) Cardelli, J.A., Clayton, G.C., & Mathis, J.S. 1989, ApJ, 345, 245
- (12) Carney, B.W., & Seitzer, P. 1986, AJ, 92, 23
- (13) Cioni, M.-R.L., & Habing, H.J. 2005, A&A 429, 837
- (14) Cioni, M.-R.L., Habing H.J., Loup, C., et al. 2004, The Messenger, 115, 22
- (15) Cioni, M.-R.L., van der Marel, R.P., Loup, C., & Habing, H.J. 2000, A&A, 359, 601
- (16) Cioni, M.-R.L, Loup, C., Habing, H.J., et al. 2000, A&A, 144, 235
- (17) Ferraro, F.R., Montegriffo, P., Origlia, L., & Fusi Pecci, F. 2000, ApJ, 119, 1282
- (18) Ferraro, F.R., Messineo, M., Fusi Pecci, F. et al. 1999, AJ, 118, 1738
- (19) Deupree, R.G., & Hodson, S.W. 1977, ApJ, 218, 654
- (20) Domínguez, I., Abia, C., Straniero, O., et al. 2004, A&A, 422, 1045
- (21) Gallagher, J.S., Madsen, G.J., Reynolds, R.J., & Grebel, E.K. 2003, ApJ, 588, 326
- (22) Girardi, L., Bressan, A., Bertelli, G., & Chiosi, C. 2000, A&AS, 141, 371
- (23) Grillmair, C.J., Mould, J.R., Holtzman, J.A., et al. 1998, AJ, 115, 144
- (24) Hargreaves, J.C., Gilmore, G., Irwin, M.J., Carter, D. 1996, MNRAS, 282, 305
- (25) Hartwick, F.D.A., & McClure R. 1974, ApJ, 193, 321
- (26) Hodge, P.W. 1964, AJ, 69, 853
- (27) Hunt, L.K., Mannucci, F., Testi, F. et al. 1998, AJ, 115, 2594
- (28) Ikuta, C., & Arimoto, N. 2002, A&A, 391, 55
- (29) Irwin, M., & Hatzidimitriou, D. 1995, MNRAS, 277, 1354
- (30) Landolt, A.U. 1992, AJ, 104, 340
- (31) Lee, M.G., Freedman, W.L., & Madore, B.F. 1993, ApJ, 417, 553
- (32) Lehnert, M.D., Bell, R.A., Hesser, J.E., & Oke, J.B. 1992, ApJ, 395, 466
- (33) Madore, B.F., & Freedman, W.L. 1995, AJ, 109, 1645
- (34) Mateo, M. 1998, ARA&A, 36, 435
- (35) Munari, U. 1991, A&A, 251, 103
- (36) Nemec, J.M. 1985, AJ, 90, 204
- (37) Nikolaev, S., & Weinberg, M.D. 2000, ApJ, 542, 804
- (38) Odenkirchen, M., Grebel, E.K., Harbeck, D., et al. 2001, AJ, 122, 2538
- (39) Olszewski, E.W., Prvor, C., & Armandroff, T.E. 1996, AJ, 111, 750
- (40) Olszewski, E.W., Aaronson, M., & Hill, J.M. 1995, AJ, 110, 2120
- (41) Piatek, S., Pryor, C., Armandroff, T.E., et al. 2002, AJ, 123, 2511
- (42) Rave, H.A., Zaho, C., Newberg, H.J., et al. 2003, ApJS, 145, 245
- (43) Salaris, M., & Cassisi, S. 1997, MNRAS, 289, 406
- (44) Shetrone, M.D., Bolte, M., & Stetson, P.B. 1998, AJ, 115, 1888
- (45) Shetrone, M.D., Côté P., & Stetson, P.B. 2001, PASP, 113, 1122
- (46) Shetrone, M.D., Côté, P., & Sargent, W.L.W. 2001, AJ, 548, 592
- (47) Smith, G.H. 1984, AJ, 89, 801
- (48) Stetson, P.B. 1979, AJ, 84, 1149
- (49) Stetson, P.B. 1979, AJ, 84, 1167
- (50) Stetson, P.B. 1980, AJ, 85, 398
- (51) Stetson, P.B. 1984, PASP, 96, 128
- (52) Stetson, P.B., McClure, R.D., & van den Berg, D.A. 1985, PASP, 97, 908
- (53) Valenti, E., Ferraro, F.R., & Origlia, L. 2004, MNRAS, 351, 1204
- (54) van den Berg, S. 2000, In: The Galaxies of the Local Group, Cambridge University Press
- (55) Wilkinson, M.I., Kleyna, J.T., Evans, N., et al. 2004, ApJ, 611, L21
- (56) Winnick, R. 2003, Ph.D. Thesis, Yale University
- (57) Young, L.M. 1999, AJ, 117, 1758
- (58) Zinn, R. 1978, ApJ, 225, 790