Discovery of X-ray eclipses from the transient source CXOGC J174540.0-290031 with XMM-Newton
We present the XMM-Newton observations obtained during four revolutions in Spring and Summer 2004 of CXOGC J174540.0-290031, a moderately bright transient X-ray source, located at only 2.9′′ from Sgr A*. We report the discovery of sharp and deep X-ray eclipses, with a period of 27,9615 s and a duration of about 1,100100 s, observed during the two consecutive XMM-Newton revolutions from August 31 to September 2. No deep eclipses were present during the two consecutive XMM-Newton revolutions from March 28 to April 1, 2004. The spectra during all four observations are well described with an absorbed power law continuum. While our fits on the power law index over the four observations yield values that are consistent with =1.6–2.0, there appears to be a significant increase in the column density during the Summer 2004 observations, i.e. the period during which the eclipses are detected. The intrinsic luminosity in the 2–10 keV energy range is almost constant with 1.8–2.3 10 erg s-1 over the four observations. In the framework of eclipsing semidetached binary systems, we show that the eclipse period constrains the mass of the assumed main-sequence secondary star to less than 1.0 M⊙. Therefore, we deduce that CXOGC J174540.0-290031 is a low-mass X-ray binary (LMXB). Moreover the eclipse duration constrains the mass of the compact object to less than about 60 M⊙, which is consistent with a stellar mass black hole or a neutron star. The absence of deep X-ray eclipses during the Spring 2004 observations could be explained if the centroid of the X-ray emitting region moves from a position on the orbital plane to a point above the compact object, possibly coincident with the base of the jet which was detected in radio at this epoch. According to our study, CXOGC J174540.0-290031 is a LMXB, and is more likely to have a black hole than a neutron star as its primary, which would entail an inclination angle greater than 75∘, i.e. the binary system and the accretion disk are seen close to edge-on.
Key Words.:
Galaxy: center – X-rays: binaries – (Stars:) binaries: eclipsing – X-rays: individuals: CXOGC J174540.0-290031(dporquet@mpe.mpg.de)
1 Introduction
The Galactic center region is a very complex region of the Galaxy as viewed in X-ray wavelengths. This region contains numerous diffuse and point-like sources, fluorescent X-ray emission from molecular clouds, supernova remnants, compact stellar sources as well as young and evolved stellar clusters. In addition to Sgr A*, the compact radio source which is thought to coincide with a supermassive black hole at the dynamical center of the Galaxy (Ghez et al. (2003), Schödel et al. (2003)), this region is populated by accreting compact objects, such as neutron stars and black hole binaries which are often transient in nature with peak X-ray luminosities in excess of 1036 erg s-1 (e.g., Churazov et al. (1997), Sidoli et al. (1999), Sakano et al. (2002), Porquet et al. (2003a)). Repeated, high sensitivity X-ray observations of this region carried out by XMM-Newton and Chandra, primarily for the purpose of monitoring Sgr A*, have also lead to the discovery of several X-ray transient binaries in various accretion states from quiescence (L 1033 erg s-1) to bright outburst (L 1036 erg s-1) as reported by Sakano et al. (2005), Porquet et al. (2005), and Muno et al. (2005a). Transients with intermediate X-ray luminosities (1034erg s-1) appear to be over-abundant by a factor of about 20 per unit stellar mass within 1 pc of Sgr A* (Muno et al. (2005a)).
During the large XMM-Newton multi-wavelength project to monitor
the light curve of Sgr A*, observations were carried out
in the Spring and Summer of 2004,
a brightening in the 2–10 keV energy band of
a factor of about two was detected within a radius of
10′′ around SgrA* (Bélanger et al. (2005)).
The centroid of the excess X-ray emission
was located at 2.9′′ South of the radio position of Sgr A*,
and was coincident with CXOGC J174540.0-290031, a moderately bright transient, discovered
by Chandra in July 2004 (Muno et al. (2005a)).
VLA observations also detected bright radio transients symmetrically
to CXOGC J174540.0-290031 whose flux
peaked during the Spring observing campaign (Bower et al. 2005).
The highest luminosity of CXOGC J174540.0-290031, in the 2–8 keV energy range,
observed by Chandra was about 51034 erg s-1 (Muno et al. (2005b)).
This luminosity is too high to be explained by the X-ray emission from
either the corona of an active star or the wind of a massive star,
but conversely strongly favors the presence of an accreting
compact object which could be either a white dwarf, or a neutron star, or a black hole.
Since the typical outburst luminosity of white dwarf system is only observed up to about
1034 erg s-1 (e.g., GK Per, Sen & Osborne SO98 (1998)),
we think that CXOGC J174540.0-290031 is more likely a X-ray binary with a neutron star or
a black hole as compact object.
| Rev. | Start time | End time | Livetime |
|---|---|---|---|
| # | (UT) | (UT) | (ks) |
| 406 | 2002-02-26T06:42:44 | 2002-02-26T17:49:55 | 40.0 |
| 788 | 2004-03-28T16:46:35 | 2004-03-30T03:47:37 | 105.3 |
| 789 | 2004-03-30T15:39:53 | 2004-04-01T03:53:19 | 106.2 |
| 866 | 2004-08-31T03:36:01 | 2004-09-01T16:03:58 | 127.5 |
| 867 | 2004-09-02T03:25:38 | 2004-09-03T16:11:28 | 130.8 |
We report here X-ray eclipses from CXOGC J174540.0-290031 discovered during the
XMM-Newton observations of Summer 2004.
The observations of eclipses from X-ray binaries are rather rare
with only 11 LMXB showing eclipses compared to the 80 LMXB reported
in the catalog of Ritter & Kolb111Version 7.4, http://www.mpa-garching.mpg.de/RKcat/.
Indeed for very high inclination angles, the thickness of the accretion disc
itself prevents us from seeing any of the X-rays at all. Eclipses are therefore
observable only in a small number of systems where the inclination still allows us
to see above the edge of the disk, see e.g. the review of Charles & Seward (1995).
The period and duration of the eclipses can be used to constrain the mass
of the secondary star and the mass of the compact object, respectively.
This paper is structured in the following manner. In section 2 we present the XMM-Newton observations and data reduction methods. Sections 3 and 4 describe the timing and spectral analysis of CXOGC J174540.0-290031, and are followed in sect. 5 and 6 by the study of the characteristics of the transient eclipses and the constraints that these impose upon the nature of the source.
2 XMM-Newton observations and data reduction


The XMM-Newton observations presented here are part of a large multi-wavelength campaign to monitor the flux of Sgr A*. The observations were made from March 28 to April 1 2004 (revolutions 788 and 789), and from August 31 to September 2 2004 (revolutions 866 and 867). The total exposure time is about 500 ks. Table 1 gives the observation log of the PN camera with the beginning and the end time of the first and last Good Time Interval (GTI) of the on-axis CCD #4, respectively. We also give in this table the XMM-Newton observation of Sgr A* of February 26, 2002, where the flaring background was very low, where no X-ray flares were observed from Sgr A*, and where CXOGC J174540.0-290031 was in its quiescent state. This latter observation will be used as reference for the X-ray flux of the quiescent emission of Sgr A* and the diffuse emission in the extraction region of CXOGC J174540.0-290031. The PN camera was in Prime Full extended window and Prime Full window mode, during revolutions 788 and 789, and revolutions 406, 866, and 867, respectively. The MOS cameras were in Prime Full window mode during all the observations. The data were processed with SAS (version 6.1.0). We selected only X-ray events with data quality flag equal to 0. X-ray events with patterns 0–12 and 0–4 were used for MOS and PN, respectively.
3 Timing analysis
The position of CXOGC J174540.0-290031 was determined in each XMM-Newton observation using its relative angular separation from three bright X-ray point sources, namely CXO J174530.0-290704, CXO J174607.5-285951, and CXO J174530.0-290704 (Muno et al. (2004)), which were observed by Chandra and XMM-Newton. We used the 5.1 ks Director Discretionary Time observation of CXOGC J174540.0-290031 made by Chandra on 28 August 2004 (ObsID 5360, PI: F. Baganoff) to measure these three angular separations. The angular separations between CXOGC J174540.0-290031 and the reference X-ray sources CXO J174530.0-290704, CXO J174607.5-285951, and CXO J174530.0-290704 are 79.50.1 ″, 362.20.4 ″, and 415.30.3 ″, respectively. The positions of these three sources were obtained in each XMM-Newton observation with the SAS command edetect_chain, using simultaneous detections in MOS1, MOS2, and PN images in the 0.3–10 keV energy band. We extract for each of the five XMM-Newton observations, the source events from a circular region of 10′′-radius centered on the inferred XMM-Newton position of the transient source.
We build the light curve of each camera from the beginning to the end of the first and the last GTI of the (on-axis) CCD #4 of PN, respectively. We corrected the light curves for the loss of exposure due to the triggering of counting mode during high flaring background, where count rate goes beyond the detector telemetry limit. Using the GTI extension of the event file, we computed for each time bin the ratio of the bin length to exposure loss, and multiplied the count rate and corresponding error by this linear correction factor. Finally, light curves of the three detectors were added to produce the EPIC light curves for the four observations in the 2–10 keV energy range. The contribution of the quiescent X-ray emission of Sgr A* and the diffuse X-ray emission have been removed by subtracting the averaged count rate observed in the same extraction region (0.1610.002 cts s-1) during the February 2002 observation (see Table 1). The X-ray flaring background has a negligible contribution to the total flux in the 10′′-radius region around SgrA* assuming the incident particles are distributed uniformly across the detector.
Figure 1 shows the corresponding EPIC light curve of CXOGC J174540.0-290031 in the 2–10 keV energy band for each of the four XMM-Newton revolutions. X-ray flares identified as coming from SgrA* are clearly visible and the analysis of these events is presented in Bélanger et al. (2005). During revolution 866 we observed five periodic sharp flux troughs (indicated by thick vertical arrows in Fig. 1). These features will be discussed in sect. 5.
4 Spectral analysis


The spectral analysis has used only PN data, which have a higher S/N than the MOS data, and are sensitive up to 12 keV. The PN data has been cleaned from flaring background contributions by removing all time intervals where the PN background count rate was higher than 50 cts s-1 and 15 cts s-1 for the Spring and Summer 2004 observations, respectively. In addition we removed all time intervals with a significant contribution of X-ray flares from Sgr A* (marked with horizontal arrows in Fig. 1). The astrophysical X-ray background (quiescent emission of Sgr A* and diffuse emission) was obtained from the XMM-Newton observation of February 26, 2002, where both Sgr A* and CXOGC J174540.0-290031 were in their quiescent state. With this double subtraction method, only the contribution of CXOGC J174540.0-290031 above its quiescent state is detected.
We use the updated X-ray absorption cross-sections of Wilms et al. (2000) (tbabs in xspec). We fit the data taking into account the scattering of X-rays by dust, using the scatter model (Predehl & Schmitt (1995)) assuming a visual extinction value =30 mag, as determined from IR observations of stars close to Sgr A* (e.g., Rieke et al. (1989)). The fitting parameter errors correspond to 90% confidence ranges for one interesting parameter (=2.71). Table 2 gives our best fit parameters for the four observations using an absorbed power law continuum model. Taking into account the error bars, the photon power law indices are consistent with a constant value in the four observations. However there is a hint of spectral hardening and decrease of the intrinsic luminosity during the last observation. Interestingly, there is a significant variation of the column density between Spring and Summer 2004 (see variation of the soft emission in Figure 2), with the highest value of observed during the revolution 866 of Summer 2004, where several deep X-ray eclipses from CXOGC J174540.0-290031 are observed.
| Rev. | /d.o.f. | |||||
|---|---|---|---|---|---|---|
| # | (1022 cm-2) | 2–10 keV | ||||
| 788 | 6.11.4 | 1.98 | 22.5/17 | 1.8 | 2.3 | |
| 789 | 5.71.4 | 2.03 | 22.5/18 | 1.6 | 2.0 | |
| 866 | 16.2 | 2.01 | 15.6/20 | 1.4 | 1.9 | |
| 867 | 9.2 | 1.60 | 10.5/24 | 1.3 | 1.8 | |
5 X-ray eclipses
 |
 |
 |
 |
As reported in sect. 3, five periodic sharp flux troughs are observed during revolution 866. Since the duration of these troughs is short compared to the trough period, we associate these features with eclipses. These eclipses are likely produced by the secondary star of the binary system rather than by optical depth effects or electron scattering in material near the magnetic pole of the compact object (as seen in some NS or WD systems), which would produced broader dips. Therefore we will assume in the following that this eclipse periodicity is associate with the orbital motion of the binary system, where a compact object emits X-rays.
We determine the eclipse ephemeris using the five eclipses of revolution 866, where the eclipses are well defined, and not affected by exposure losses (see vertical thick arrows in Fig. 1). We start from the arrival times of photons detected by MOS1+MOS2+PN, which are convolved with a Gaussian smoothing kernel to reduce the Poissonian noise and to produce a smooth shape of the light curve. Each eclipse is then fitted with a Gaussian plus a linear term to measure accurately the five eclipse epochs. The eclipse period () and the epoch of the first eclipse (T0) are obtained with corresponding errors from mean and rms of the eclipse epoch differences. The best estimate of the eclipse period is obtained by minimizing its rms error by varying the FWHM of the smoothing kernel. The minimum rms is obtained for a FWHM760 s, leading to T0=05h00m18s and s. The Julian date epochs of the eclipses are , where is an integer. The predicted eclipses are marked in Fig. 1 by thin vertical arrows. While similar fainter eclipses, coinciding with the ephemeris predictions (see vertical thin arrows), are visible during revolution 867, no obvious deep eclipses are observed during the revolutions 788 and 789 (Spring 2004 observations) at the times predicted by the eclipse ephemeris. Based on the Chandra observations performed in July and August 2004, Muno et al. (2005a) proposed the possible presence of dips from this source with a tentative period of 7.9 h, slightly larger than our measurement. Our eclipse ephemeris predict well the epochs of the troughs observed with Chandra in July 2004.
To obtain folded light curves, the arrival times of photons detected by each instrument when Sgr A* was not flaring were folded using the eclipse period. Then using the GTI extension and the time intervals of Sgr A* flares, we determine the net exposure within each phase bin to calculate the count rate. Instrument folded light curves are then added to obtain the EPIC folded light curve. Figure 3 shows the resulting folded light curves. We compute the average count rates of the transient and its dispersion outside the time interval where the eclipse occurs. The average count rate level for the revolutions 788, 789, 866, and 867 are CR=0.160.03, 0.160.03, 0.140.03, and 0.110.02 cts s-1, respectively. During each epoch, CR is constant, whereas there is a hint of a decrease between the Spring and Summer epochs. Deep eclipses are visible for the revolutions 866 and 867 during Summer 2004 (Fig. 3 lower panels). The duration of the eclipse is defined as the time interval where the count rate is lower than one sigma from the average count rate. Both eclipse duration measurements are consistent with about 1,100100 s, which is a small fraction (4%) of the eclipse period. The eclipses are not total as suggested by the folded curves of the revolutions 866 and 867 (Fig. 3) where the minimum flux is not compatible with zero. The eclipse of revolution 867 is less deep () than the eclipse of revolution 866 (). This could suggest an extended X-ray emitting region, which would be only partly hidden by the secondary star. As previously suggested by the light curves of revolutions 866 and 867 there is no such deep eclipses during the Spring 2004 observations (see the upper panels of Fig. 3 upper panels). We can exclude confidently for this epoch any eclipse with depth greater than 19% (i.e. below one sigma dispersion of the light curve). The absence of these deep X-ray eclipses in Spring 2004 are possibly due to a displacement of the X-ray emitting region above the orbital plane as we will discuss in §6.3.
6 Nature of CXOGC J174540.0-290031
We consider that the X-ray source CXOGC J174540.0-290031 is a semidetached binary system, with a circular orbit (tidal circularization in binary system with short period), which has a sufficiently high inclination to the line-of-sight so as to produce X-ray eclipses of the compact object by the secondary star. In this framework, the eclipse period ( s) is identified as the orbital period of the binary system, and will provide constraints on the mass of the secondary star, whereas the eclipse fraction () will then constrain the mass of the compact object (e.g., Weisskopf et al. (2004)).
6.1 Upper limit on the mass of the secondary star from the eclipse period
We can determine a mass-radius relation of the secondary star knowing the orbital period. The mass of the secondary star is
| (1) |
where , , and are the mean density and the radius of the secondary star, and the solar mean density (1.41 g cm-3), respectively. We consider that the secondary star’s radius is equal to the secondary star’s effective Roche lobe radius222The effective Roche lobe radius is defined so that the sphere with this radius has the same volume that the one within the Roche lobe., , given by Eggleton (1983)’s approximation:
| (2) |
where (where is the mass of the primary star), and is the separation of the two stars, which is related to the eclipse period by
| (3) |
Combining Eqs. (1)–(3) leads to:
| (4) |
Applying Eq. (1) in Eq. (4) gives the mass-radius relation of the secondary star knowing the orbital period:
| (5) | |||||
Figure 4 shows this mass-radius relation for the eclipse period, compared with the mass-radius relation of low-mass stars in the Zero-Age Main-Sequence stage (ZAMS), calculated by Siess et al. (2000). When the star evolves away from the main-sequence its stellar radius increases. Assuming that the secondary star is on the ZAMS or older, we can see that for a large range of masses of the compact star (taking –3.0 M⊙ for a neutron star, or – M⊙ for a stellar-mass black hole), the mass donor star has mass M⊙. As shown by Kolb et al. (2001) using stellar models and allowing for different mass transfer rates and different system ages prior to mass transfer, the mass of a ZAMS star with the same spectral type is an upper limit to the donor mass. As well, Howell et al. (2001) shown that the secondary masses in CVs just above the period gap of about 2–3 h should be as much as 50% lower than would be inferred if one assumes ZAMS donor star. Therefore, the value of the mass donor star found here ( M⊙) assuming a ZAMS star is a conservative upper limit, hence, CXOGC J174540.0-290031 is a Low-Mass X-ray Binary (LMXB).

This maximum stellar mass corresponds to a mass donor star with spectral type later than about K0. For comparison a ZAMS star later than K0 (which corresponds to an age of about 150 million years) has an absolute magnitude in the infrared band of mag (Siess et al. (2000)), which corresponds at the galactic center distance ( kpc; Eisenhauer et al. (2003)) where the extinction in the band is mag (Clénet et al. (2001)), to mag. The detection of the mass donor late-type star with ground adaptive optics (e.g., NACO at VLT using for the infrared wavefront sensor the close mag source IRS 7 as reference star) will allow to identify the X-ray transient binary in the near-infrared.
6.2 Upper limit on the mass of the compact object from the eclipse fraction
The eclipse fraction, i.e. the ratio of the eclipse duration to the orbital period, is geometrically related to the angular size of the path of the observer behind the secondary photosphere seen from the compact object by
| (6) |
where is the orbital inclination. Using Eq. (2), we find that the eclipse fraction depends only on the orbital inclination and the mass ratio.
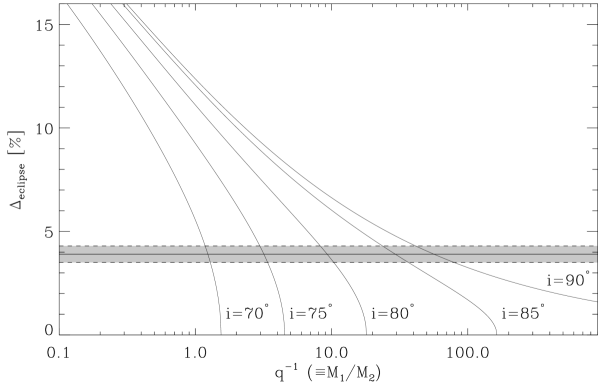

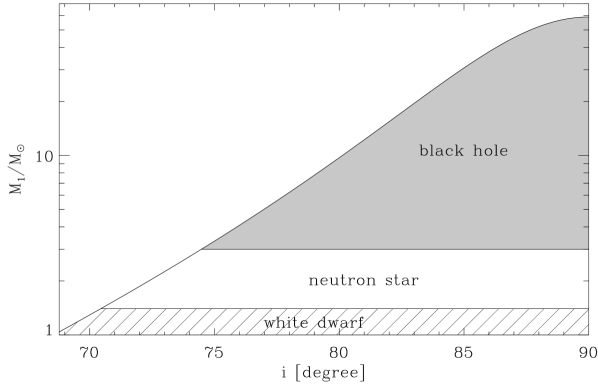
Figure 5 shows the eclipse fraction as a function of (), for different orbital inclinations. To each mass ratio corresponds a critical inclination where only a grazing eclipse is possible, below this critical inclination an eclipse of the compact source by the secondary star cannot occur. More generally, the proper inclination needed to obtain a given eclipse fraction can be derived from Eq. (5):
| (7) |
This equation is useful to compute the eclipse visibility as a function of the mass ratio and the orbital inclination (see Figure 7).
The maximum eclipse duration is obtained in Fig. 5 for , i.e. when the line-of-sight is parallel to the orbital plane. Consequently, the observed eclipse fraction provides an upper limit on . If the inclination is known, is obtained by solving numerically the following equation:
| (8) |
The eclipse duration of 1,100 s corresponds to =0.039, implying that the maximum value for , i.e. , is . Since M⊙ (see §6.1), we obtain that the mass of the compact object is M⊙.
Accretion disks around compact objects are likely not thin, and should then produce a permanent total X-ray eclipse when seen exactly edge-on. Therefore an orbital inclination of is unlikely. Figure 7 shows the inferred maximum mass of the compact object as a function of the orbital inclination. Inclinations lower than can be excluded because the luminosity of the X-ray transient exclude a white dwarf as primary star. We conclude that the possible values of the orbital inclination are between and . If the orbital inclination is – a black hole can be excluded.

6.3 Constraints from the missing eclipses in Spring 2004
The absence of eclipse in Spring 2004 cannot be explained easily in this strict geometry of the binary system, where a decrease of the secondary star radius appears rather unlikely. We investigate a vertical motion of the X-ray emitting region from the orbital plane to a region located above the compact object. In such a configuration, the critical inclination, , which produces grazing eclipses, is related to the vertical elevation, , of the X-ray emitting region above the orbital plane by
| (9) |
Taking equal to the orbital inclination constrained from Eq. (7) provides the value of the minimum vertical elevation needed to suppress the eclipses. Replacing in Eq. (9), and by Eq. (3) and (7), respectively, leads to
| (10) | |||||
where is a function of the mass ratio only, see Eq. (2). Using M⊙ provides an upper limit on the minimum value of needed to produce the disappearance of the eclipses.
Figure 8 shows as a function of the mass ratio for M⊙. If the compact object is a neutron star a vertical elevation of the X-ray emitting region of only R R2 is sufficient to suppress the eclipses by the secondary star. If the compact object is a black hole a greater vertical elevation is needed.
7 Discussion
From the Chandra observations (Muno et al. (2005a)), the minimum 2–8 keV luminosity of CXOGC J174540.0-290031 at 8 kpc was determined to be less than 2 1031 erg s-1 (Muno et al. (2005a)), and the maximum to be about 5 1034 erg s-1 (Muno et al. (2005b)). This large amplitude variation corresponds to a factor of at least 2,500. We infer a minimum 0.5–10 keV luminosity of less than 3.5 1031 erg s-1. Such a low luminosity lends support to the interpretation that the compact object of this binary system is more likely to be a black hole than a neutron star. Indeed, the quiescent 0.5–10 keV X-ray luminosities of neutron stars are about 1032–1034 erg s-1, i.e., 100 times higher than those for black holes (1030–1033 erg s-1), as shown by Garcia et al. (2001). In addition, VLA observations have revealed a radio outburst coincident with the X-ray position of this source, with a peak intensity of 100 mJy at 7 mm (45 GHz) (Bower et al. (2005)). The peak radio emission occurred in March 2004 and continued decaying in its surface brightness until the start of the September 2004 campaign (Bower et al. (2005)). Therefore, the minimum luminosity and the radio outburst strongly suggest that this source is more likely to contain a black hole than a neutron star primary (e.g., Fender & Kuulkers (2001)).
We observed with XMM-Newton X-ray eclipses from CXOGC J174540.0-290031 with a period of 27,961 5 s (about 7.76 hours) in the period from August 31 to September 2 2004 but did not however detect such a feature in the earlier observations of March 28 to April 1 2004. In the framework of eclipsing semidetached binary systems, we show that the 27,9615 s eclipse period constrains the mass of the assumed main-sequence secondary star to less than 1.0 M⊙. Therefore, we deduce that CXOGC J174540.0-290031 is a low-mass X-ray binary. Moreover the eclipse duration (1,100100 s) constrains the mass of the compact object to less than about 60 M⊙, which is consistent with a stellar mass black hole or a neutron star.
The obtained XMM-Newton spectra are well described with an absorbed power law continuum. The column density values on the line-of-sight and the 2–10 keV luminosities confirm that this source is an X-ray binary, with a black hole or a neutron star as compact object, located at or near the Galactic Center. The 2–10 keV luminosity is almost constant with 1.8–2.3 1034 erg s-1 over the four observations, assuming a distance of 8 kpc. While the power law indices (=1.6–2.0) are consistent within the statistical uncertainty over the four observations, we observed a significant increase of the column density during the Summer 2004 observations, i.e. when X-ray eclipses are observed.
We propose to explain the absence and the presence of deep X-ray eclipses during the Spring 2004 and Summer 2004 observations, respectively, without any significant change of the X-ray luminosity (see Table 2) by a different position of the X-ray emitting region. In Spring 2004 observations the absence of X-ray eclipses could be due to the vertical movement of the centroid of the X-ray emission from a point on the orbital plane to a position above the compact object (the offset being at least 0.1 times the radius of the secondary star for a neutron star and more for a black hole primary). In such a configuration, our line-of-sight to the X-ray emitting region does not intercept the upper layer of the accretion disk, which is consistent with the lower column density value observed in the Spring 2004 observations. We propose that this displacement of the X-ray emitting region could be linked to the presence of a jet. When the jet is launched, a part of the hot plasma accreting towards the central compact object is lift off above the accretion disk, extending consequently the X-ray emission region well above the limb of the secondary star. On the contrary in Summer 2004, the X-ray emission from the base of the jet becomes almost negligible and most of the X-ray emission comes from the mid-plane accretion disk which is eclipsed by the secondary star. This scenario is compatible with the significant increase in the column density during the Summer 2004 observations, since here the line-of-sight to the X-ray emitting region intercepts the upper layer of the accretion disk.
Radio observations of this transient object strongly support the appearance of a jet. Indeed, two new transient radio sources were discovered by the VLA at 7 mm on March 2004 symmetrically to the position of the X-ray source (Bower et al. (2005), see also fig. 1 in Muno et al. (2005a)). The peak of the radio emission occurred in March 2004 and continued decaying in its surface brightness until the start of the September 2004 campaign (Bower et al. (2005)). Also VLA observations at 6 cm show clearly the brightening of this transient radio source in the 2004 epoch compared to the 1983 epoch (Yusef-Zadeh, Cotton & Bower 2005, in preparation). These two bright radio sources (as well as X-ray reflection off the orbiting gas reported by Muno et al. (2005b)) most likely associated with the binary system CXOGC J174540.0-290031 can be the imprint of radio emission from a collimated bipolar outflow, as observed in microquasars (e.g., Spencer et al. (1997)), where a mass ejection is triggered by an instability in the accretion disk of a binary system, with the primary star being a black hole as suggested above. In conclusion, CXOGC J174540.0-290031 appears to be a LMXB with more likely a black hole as compact object, which lead to an inclination angle of the system greater than 75∘ according to our study. Sensitive follow up observations of this embedded X-ray binary with ground based adaptive optic system should be able to detect the mass donor star in the near-IR and allow us to impose more restrictive constraints on the parameters of this transient eclipsing binary system.
Acknowledgements.
This work is based on observations obtained with XMM-Newton, an ESA science mission with instruments and contributions directly funded by ESA Member States and the USA (NASA). The authors would like to thank the referee for useful comments. D.P. is supported by a MPE fellowship.References
- Bélanger et al. (2005) Bélanger, G., Goldwurm, A., Melia, F., Ferrando, P., Grosso, N., Porquet, D., Warwick, R. S., Yusef-Zadeh, F. 2005, ApJ, submitted
- Bower et al. (2005) Bower, G. C., Roberts, D., Yusef-Zadeh, F., Backer, D., Cotton, B. et al. (2005), ApJ, accepted [astro-ph/0507221]
- Charles & Seward (1995) Charles, P. A., & Seward, F. D. 1995, Cambridge, New York: Cambridge University Press
- Churazov et al. (1997) Churazov, E., Gilfanov, M., Sunyaev, R. et al. 1997, Advances in Space Research, 19, 55
- Clénet et al. (2001) Clénet, Y., Rouan, D., Gendron, E., Montri, J., Rigaut, F., Léna, P., & Lacombe, F. 2001, A&A, 376, 124
- Eggleton (1983) Eggleton, P. P. 1983, ApJ, 268, 368
- Eisenhauer et al. (2003) Eisenhauer, F., Schödel, R., Genzel, R. et al. 2003, ApJ, 597, L121
- Fender & Kuulkers (2001) Fender, R. P., & Kuulkers, E. 2001, MNRAS, 324, 923
- Garcia et al. (2001) Garcia M. R., McClintock J. E., Narayan R. et al. 2001, ApJ, 553, L47
- Ghez et al. (2003) Ghez, A. M., Duchêne, G., Matthews, K. et al. 2003, ApJ, 586, L127
- Howell et al. (2001) Howell, S. B., Nelson, L. A., & Rappaport, S. 2001, ApJ, 550, 897
- Kolb et al. (2001) Kolb, U., King, A. R., & Baraffe, I. 2001, MNRAS, 321, 544
- Muno et al. (2004) Muno, M. P., Arabadjis, J. S., Baganoff, F. K. et al. 2004, ApJ, 613, 1179
- Muno et al. (2005a) Muno, M. P., Pfahl, E., Baganoff, F. K. et al. 2005a, ApJL, 622, L113
- Muno et al. (2005b) Muno, M. P., Lu, J. R., Baganoff, F. K. et al. 2005b, ApJ, submitted [astro-ph/0503572]
- Porquet et al. (2003a) Porquet, D., Rodriguez, J., Corbel, S. et al. 2003a, A&A, 406, 299
- Porquet et al. (2003b) Porquet, D., Predehl, P., Aschenbach B. et al. 2003b, A&A, 407, L17
- Porquet et al. (2005) Porquet, D., Grosso, N., Burwitz, V. et al. 2005, A&A, 430, L9
- Predehl & Schmitt (1995) Predehl, P. & Schmitt, J. H. M. M. 1995, A&A, 293, 889
- Rieke et al. (1989) Rieke, G.H., Rieke, M.J. & Paul, A. E. 1989, ApJ, 336, 752
- Sakano et al. (2002) Sakano, M., Koyama, K., Murakami, H. et al. 2002, ApJS, 138, 19
- Sakano et al. (2004) Sakano, M., Warwick, R. S., Hands, A., Decourchelle, A. 2004, MmSAI, 75, 498
- Sakano et al. (2005) Sakano, M., Warwick, R. S., Decourchelle, A., Wang, Q. D. 2005, MNRAS, 357, 1211
- Schödel et al. (2003) Schödel, R., Ott, T., Genzel, R. et al.
- (25) Sen C. & Osborne J. P., 1998, ASP Conf. Ser., Vol. 137, 463
- Sidoli et al. (1999) Sidoli, L., Mereghetti, S., Israel, G. L. et al. 1999, ApJ, 525, 215
- Siess et al. (2000) Siess, L., Dufour, E., & Forestini, M. 2000, A&A, 358, 593
- Spencer et al. (1997) Spencer, R. E., Newell, S. J., & Garrett, M. A. 1997, Vistas in Astronomy, 41, 193
- Weisskopf et al. (2004) Weisskopf, M. C., Wu, K., Tennant, A. F. et al. 2004, ApJ, 605, 360
- Wilms et al. (2000) Wilms, J., Allen, A., McCray, R., 2000, ApJ, 542, 914