Structure and stellar content analysis of the open cluster M 11 with 2MASS photometry
An overall analysis of the structure and stellar content of M 11 is presented, thanks to the wide-angle 2MASS spatial coverage. We derive photometric and structural parameters and discuss the spatial dependance of the luminosity and mass functions. Photometric parameters basically agree with previous ones mostly based on the optical. We obtained a core radius of 1.23 pc and a tidal radius of 29 pc. In particular, the cluster is populous enough so that the tidal radius could be obtained by fitting the three-parameter King profile to the radial distribution of stars. We analyzed the spatial distribution of mass functions, finding that the the slope changes from in the core to in the outer halo. The spatial distribution of mass function slopes derived from 2MASS agrees with that derived from optical CCD data, which further confirms the reliability of 2MASS data for future analyses of this kind at comparable observational limits. We detect mass segregation up to distances from the center of . We emphasize that the mass function slope in the core is flatter than anywhere else as a consequence of mass segregation. The derived total cluster mass is .
Key Words.:
Galaxy: open clusters and associations: individual: M 111 Introduction
The open cluster M 11 (NGC 6705, Mel 213, Cr 391, OCl 76 - Alter et al. (1970)) is a concentrated, populous stellar system projected on the Scutum Cloud towards the central part of the Galactic disk [, , , ]. Although dark clouds permeate the sky on the cluster direction, it is situated in a clear area characterized by a relatively low interestelar extintion nearby the Sagittarius arm. Were it a low surface brightness cluster it would be probably missed by surveys due to the rich field from the Galactic background stars. For several reasons, M 11 has captured attention over the years, not only for its intrinsic properties, but also for its contribution to the understanding of chemical and dynamical Galactic evolution.
Being closer to the Galactic center than the solar radius, M 11 suffers from relatively stronger tidal effects, as well as more frequent interactions with molecular clouds. The WEBDA database (Mermilliod 1996) provides a distance from the sun pc, reddening , apparent distance modulus , age t Myr and metallicity .
McNamara & Sanders (1977) studied proper motions in M 11 and obtained a velocity dispersion , and an observed mass of M⊙. The inner cluster region may have isotropic orbits, while the orbits in the outer parts are probably eccentric with larger velocities in the radial direction.
Mathieu (1984) carried out a comprehensive analysis of M 11 based on proper motion and membership probability data (from McNamara et al. 1977) as well as photographic photometry reaching and . By studying the cluster luminosity function out to a radius of 10’, evidence was found that inside 2’ the luminosity function is flatter than for the outer region, implying mass segregation. The total observed mass estimated inside the radius of 10’ and considering stellar masses down to was .
Santos et al. (1990) inferred the cluster overall mass function (MF) slope using a population synthesis method and the integrated spectrum aided by the HR diagram. The cluster visible light is dominated by the upper main sequence and turnoff stars (B6-A2).
Nilakshi et al. (2002) studied the spatial structure of a large sample of open clusters using photometric data from the DSS. For M 11 they derived a core radius of pc, in agreement with the one obtained by Mathieu (1984).
Recently, Bonatto & Bica (2005), Bonatto et al. (2005), Bica et al. (2004), Bonatto & Bica (2003) and references therein undertook a systematic study of open cluster parameters, structure and other fundamental properties employing 2MASS photometry, making use of a spatial coverage as large as necessary for each case. For M 11, a deep UBVRI CCD study was carried out by Sung et al. (1999), including a spatial dependance of the MF. We intend to compare the performances of these optical CCD data and the 2MASS photometry. This is crucial for future cluster studies as 2MASS becomes widely used.
In the present work we explore M 11 with 2MASS photometry. In Sect. 2 the 2MASS photometry is presented. In Sect. 3 the cluster parameters are discussed. The cluster structure is analyzed in Sect. 4. Luminosity and mass functions are discussed in Sect 5. Concluding remarks are given in Sect. 6.
2 Database: 2MASS photometry
The 2MASS catalogue (Skrutskie et al. 1997) was employed in the present study because of the homogeneity and the possibility of large-area data extractions. The near-infrared photometry is also suitable for M 11, since its MS (and giant clump) stands out from the rich stellar field in CMDs as the one shown in Fig. 1. A circular data extraction with radius centered in M 11 yielded 8432 stars surmounting by 941 the number of stars in the background field of same area (7491 stars), which is defined by an annulus with maximum radius of (Fig. 1). From J=10 to J=14 the cluster MS seems to be little affected by field stars and should result in more precise determinations of the luminosity function (LF). A good account of the field is therefore necessary to obtain the LF of fainter stars. On this regard, we advance that a statistical approach was employed in which the number of cluster stars in a magnitude interval is obtained from the difference between the total number of stars within that interval at a given annulus and the same number at an external annulus supposedly containing only field stars. Before this procedure the data are submitted to a CMD filter, selecting only stars in the MS and giant cluster sequences (Fig. 1).
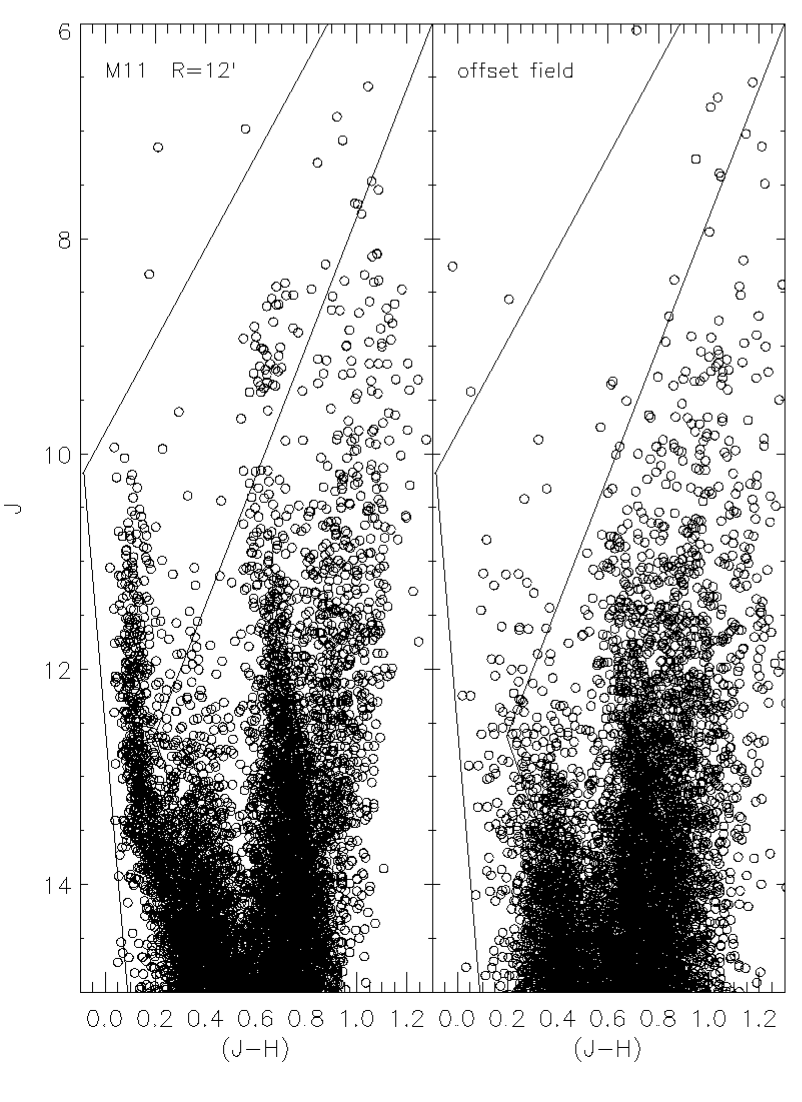
The distance from the cluster center used to extract a fiducial background field was chosen on the basis of a compromise between the premise that, on one side, the field is far enough in order to not contain cluster stars, and on the other side, the field is close enough to keep at small levels the irregularities produced by dust and stellar density gradient. Interesting to note that the field sequences correspond to disk stars as shown by means of CMDs simulations (Marigo et al. 2003): the vertical distribution around (J-H)=0.4 is formed by old disk turnoff stars (m M⊙), the one at (J-H)=0.75 is associated to old disk low MS (m M⊙) (but also may include reddened giants) and the stars redder than (J-H)=0.9 are probably disk giants.
2.1 Crowding effects
M 11 is a rich compact cluster, being classified as type “II2r” (detached, weak concentration; moderate range in brigthness; rich, more than 100 stars) by Trumpler (1930). Interestingly, Ruprecht (1966) has classified M 11 as a globular cluster of Trumpler type “I2r”, even though its first colour-magnitude diagram had already been obtained ten years before suggesting that the age of M 11 is intermediate between that of the Pleiades and that of Praesepe (Johnson et al. 1956). Not surprisingly, its concentration towards the center makes crowding an expected effect, enhanced by the instrumental limited spatial resolution. We have taken advantage of the complete analyses in the 2MASS database, which provide information on crowding for every source and band by means of a flag (“cc_flg”). This flag identifies whenever a source/band had its photometry (flux) overestimated by at least 5% due to image artifacts, most of them associated to crowded fields.
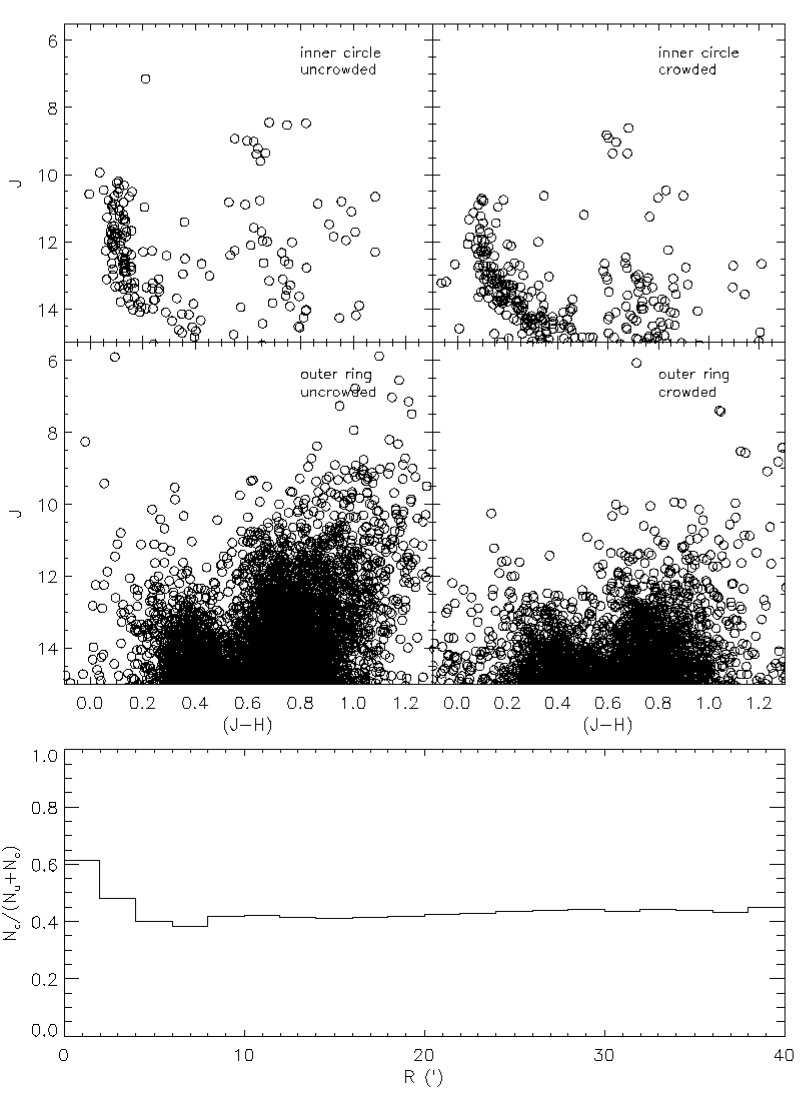
We used this flag as an estimate of how significant is crowding over the cluster radius. The distribution of the ratio between the number of stars with photometry affected by crowding () and the total number of stars () was calculated as a function of radius. The counts were carried out within rings 2’ wide. The results are presented in Fig. 2. A nearly constant distribution of () can be noticed except for the cluster inner regions (R’), in which crowding becomes important, as expected. What is the influence of crowding on the LF? Since most stars affected by crowding in the cluster inner regions follow the cluster sequences, i. e., the photometric precision is not severely degraded for those stars, the LF should preserve its shape if the magnitude bins are wider than the photometric uncertainty. Magnitude bins of 0.5 mag were used in the following since an uncertainty of 5% in flux corresponds to 0.05 mag, about one tenth of the magnitude bin. To reach 0.5 mag (bin width), the flux should be overestimated by 50%. Then, the crowding effects yield a negligible bias in the LF since large flux overestimates seem not to be the case according to Fig. 2, which shows that most of the stars affected by crowding are distributed over the same sequences as those unaffected. Indeed, significant flux overestimates caused by crowding would be immediately detected in the CMDs of Fig. 2 by an overall smearing of the sequences. Although completeness corrections were applied to M 11 by Mathieu (1984) and Sung et al. (1999), we have not applied such procedure since we focused most of our analysis outside the cluster core.
3 Cluster parameters
The interstellar reddening towards M 11 seems to be well established (E(B-V)=), with no evidence for a differential pattern across the cluster field (e. g. Sung et al. 1999). The apparent distance modulus has been measured with different methods resulting (Sung et al. 1999; Brocato et al. 1993). The cluster metallicity is nearly above solar, [Fe/H]=, according to Twarog et al. (1997), which is approximately the value given in WEBDA (Sect. 1).
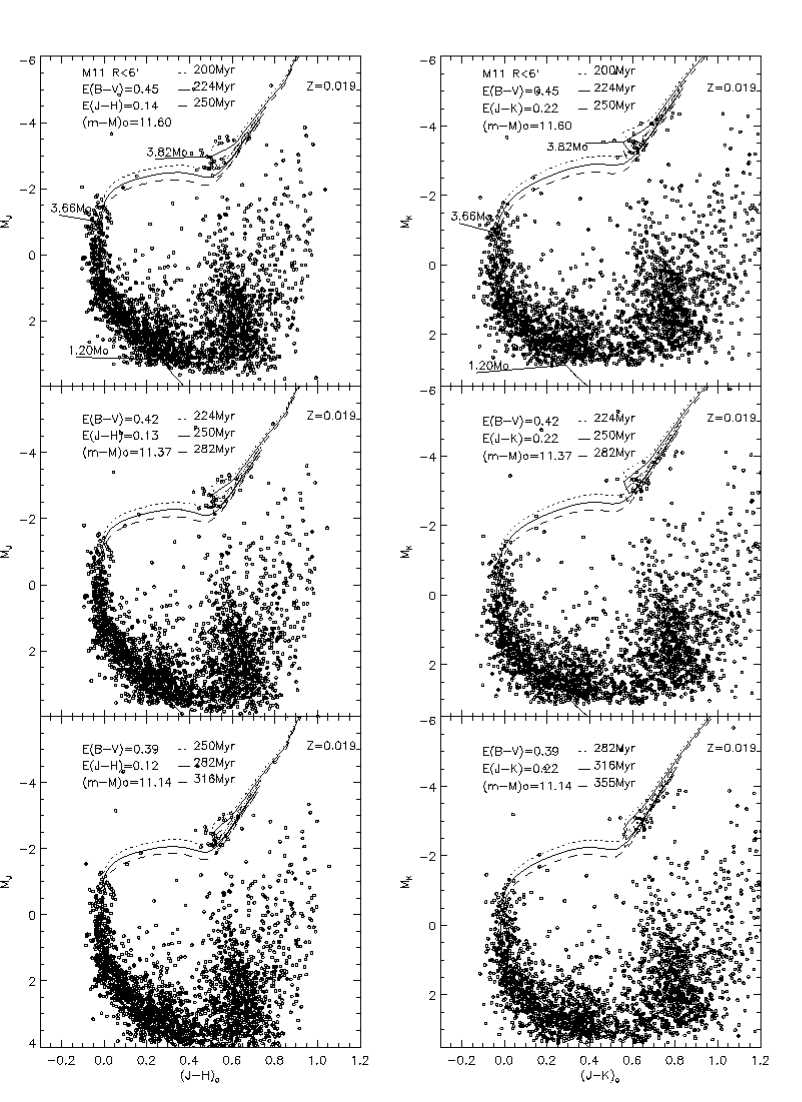
Cluster parameters were derived by fitting isochrones built using 2MASS filters (Bonatto et al. 2004) to the cluster central region (R’) CMDs J(J-H) and , which best define the cluster sequences. The cluster central region corresponds to its visual diameter and it was chosen to maximize cluster members over field stars. Isochrones were adjusted to both CMDs using as constraints and (m-M). Since each CMD was built from independent observations involving a mixture of different bands, they provide different data sets on which the isochrone matching should converge, giving more weight to the analysis. Fig. 3 shows the best matching solar metallicity isochrones where the data have been corrected for the extreme and average values that E(B-V) and (m-M)∘ may assume due to errors. Selected stellar masses associated to the 224 Myr isochrone are also indicated in the top panels: the lower mass (1.2 M⊙) corresponds approximately to the data instrumental limit, the intermediate mass (3.66 M⊙) locates the turnoff, and the higher mass (3.82 M⊙) marks the bluest point of the core He-burning phase (giant clump).
By fixing E(B-V) and (m-M)∘ according to observational constraints, the free parameters were reduced to the isochrone age and metallicity. The well-defined main sequence (MS) and giant clump of M 11 allow an unambiguous derivation of its age with an uncertainty of nearly 10%.
A good overall match is obtained if the average reddening and average true distance modulus are used for the 250 Myr isochrone (Fig. 3, middle panels), with satisfactory results also being obtained for the 224 Myr isochrone and the 282 Myr one. In spite of this, a difference of mag. is found for the giant clump mean locus in the M(J-H)∘ CMD.
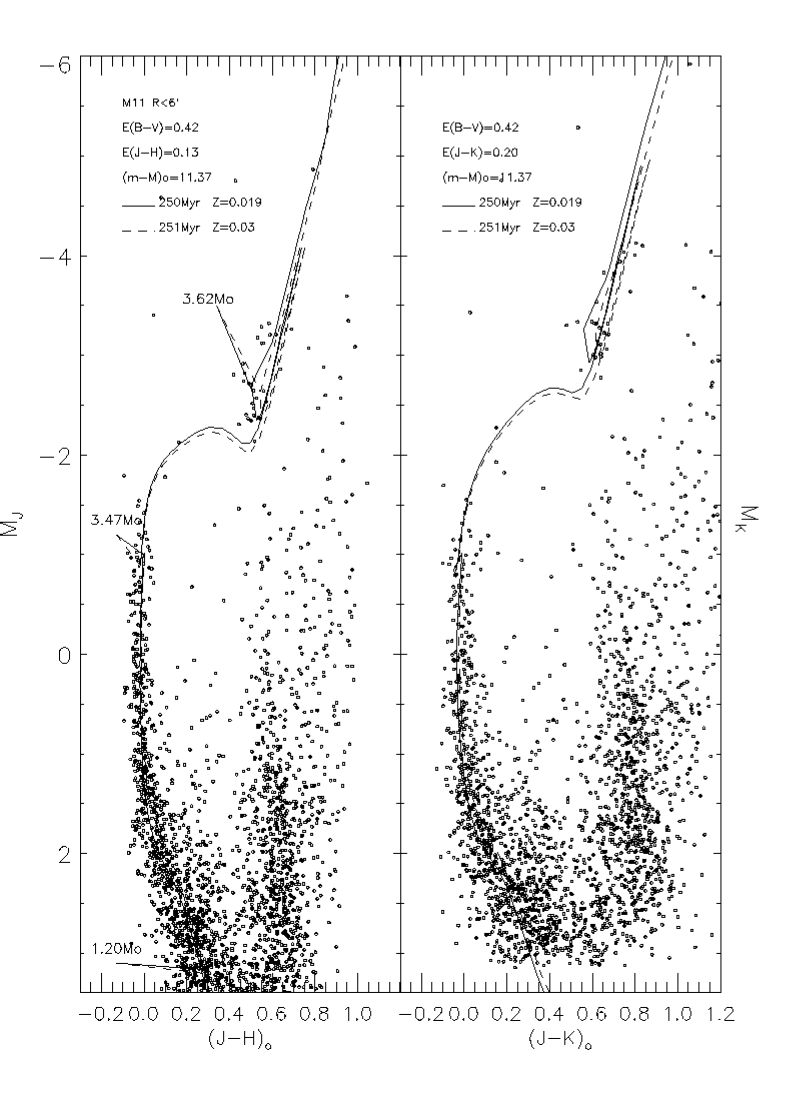
Taking into account the fact that the cluster has metallicity above solar (Twarog et al. 1997), the best match isochrone (250 Myr) is presented in Fig. 4 for two metallicities (Z=0.019 and Z=0.03 or [Fe/H]=0.20) together with the corrected data in both CMDs. Three mass values are shown connected to the corresponding isochrone. This comparison indicates that the colour of the cluster stars in the clump is not due to a cluster metallicity higher than solar, indeed the higher metallicity isochrone indicates a redder colour for the clump. Binaries may be affecting the cluster clump colour, since they would explain a brightening of clump stars if they were in binary systems and a blueing if they comprise a red giant and a blue turnoff star.
In conclusion, an age of tMyr was obtained for M 11 and the solar metallicity isochrone was employed as representative of the cluster stellar population. Such a representation is relevant in the determination of the mass function since the isochrone is the source of the mass-luminosity relation used to transform the observed luminosity function (LF) into the mass function (MF). Indeed, as it is well known, the precise location of masses over the MS and the clump are influenced by age and metallicity as can be noticed by comparing Fig. 3 and Fig. 4. Thus, the mass range of observed stars and, in consequence, the cluster MF are partially determined by the isochrone chosen.
4 Cluster structure from the King-profile
The colour-magnitude filter (see Fig. 1) in the plane J(J-H) was applied in order to select the CMD regions containing the cluster evolutionary sequences. The magnitude cutoff at the lower MS end adopted for fitting a King-profile is based on the optimal separation of cluster stars and background field. Fig. 5 shows that at J=15.0 the density of cluster stars with respect to the background reaches a maximum value of 25.08 stars.arcmin-2 at the central circle of 1 arcmin of radius. Therefore, the magnitude cutoff at J=15.0 was adopted.

A discussion on the effects of applying colour-magnitude filters and background selection are given in Bonatto et al. (2005). Because the background selection is critical for M 11, the filtered cumulative distribution of stars in the cluster outer regions was analyzed as a function of MJ. In Fig. 6 the cumulative LF of the three outer rings 5 arcmin wide are compared. The counts were carried out within bins of mag and the range of MJ presented in this Figure corresponds to the cluster MS. The LFs are normalized to the area of the outer ring (R(’)). A clear excess in the cumulative LF is noticed for the inner ring (R(’)), which is better visualized by the difference between its cumulative LF and that for the outer ring, and characterized as the “inner ring excess” in Fig. 6. The middle ring (R(’)) excess is also shown, which indeed does not reveal any significant difference between the middle and outer cumulative LFs, presumably for representing both a fiducial background field, little affected by cluster stars. In contrast, the inner ring clearly reveals the presence of cluster stars. Therefore cluster stars are present and dominant over the field for distances less than 30’ from its center.

An analysis of the cluster structure was performed on this selected sample. The radial distribution of stellar surface density (stars/arcmin2) was investigated by counting stars within rings of width 1 up to 40’ from the cluster center. As expected, the procedure carried out to maximize cluster stars over field stars helps to enhance the cluster structure keeping the background field at acceptable levels, as shown in the top panels of Fig. 7. In this Figure, a constant background was fitted to the outer region sampled, R(’), its 1- dispersion being shown in the top-right panel.

A reasonable limiting radius for M 11 is R ’, where the cluster star density begins to stand out from the background one. The fitted constant background was then subtracted from the overall surface density and a King-profile fitting was performed. Two-parameter (central stellar surface density, , and core radius, Rc) and three-parameter (, Rc and tidal radius, Rt) King functions (King 1962, 1966) were employed. The fitted functions are presented in Fig 7 in log scales (bottom) together with the best fit parameters. The two-parametric King function should better represent the cluster inner regions and the three-parametric King function should provide a better estimate of the cluster overall structure. In both fittings the estimates of inner parameters ( and Rc) agree within the uncertainties. The tidal radius was estimated with 50% precision because of the sensitivity of the three-parameter King model to the fluctuations in the density of cluster stars in its outskirts, almost at the background level. Such fluctuations (represented by poissonian errors in Fig. 7) are taken into account in the fitting by applying a weigthed least-squares method.
The adopted true distance modulus (m-M) translates into a distance from the Sun of d kpc. Therefore, the linear limiting radius of M 11 is R pc (Fig. 7). A galactocentric distance of d kpc is obtained using d kpc for the Sun Galactocentric distance (Reid 1993).
In Fig. 8 the same three-parametric King function shown in Fig. 7 is presented in absolute units, where 1 arcmin=0.55 pc. The cluster structural parameters concerning stars with J are stars.pc-2, R pc and R pc. The core radius is 1.7 times larger than that quoted by Nilakshi et al. (2002).
A deviation from the King profile can be seen between 6 and 9 pc (which is inside Rlim, but well beyond Rc) where the cluster star density is in excess with respect to the model (Fig. 8). Such an excess is expected if the cluster is in the process of loosing low mass stars by means of energy equipartition. If so, this excess of stellar surface density is also expected in the cluster outskirts, but detecting this effect beyond 9 pc is more difficult because of the uncertainties produced by the background field.

Alternative means of diagnosing mass segregation in clusters have been successfully employed by e.g. Raboud & Mermilliod (1998a), Raboud & Mermilliod (1998b), Mathieu (1984). Specifically, following these studies, we derive the cluster structure and cumulative distributions as characterized by stars in four mass ranges: m (lower MS, M), m (intermediate MS, M), m (upper MS, M) and m (giants, M). Two-parametric King models were fitted to the radial stellar density profile for each mass range separately. The results are presented in Fig. 9, where the best solution for the core radius is shown. The more extended populations (larger Rc) correspond to those populations composed by less massive stars, as one would expect for a dynamically evolved cluster with conspicuous mass segregation. Although satisfactory fittings were obtained for the lower and intermediate MS, reasonable fittings were not achieved for the upper MS and giants, whose less numerous samples are subject to larger statistical errors. Therefore Rc should be taken carefully as an indicator of mass segregation in the cluster.

Indeed, a better, direct account of mass segregation is revealed by the cumulative distribution of stars in the mass ranges as above (Fig. 10). The cumulative distribution (F(N)), field subtracted and determined up to 20 pc ( 2Rlim), shows that less stars in the lower MS sample are concentrated in the inner 6-7 pc in comparison with the other more massive samples. Closer to the cluster center, at R pc, the number of stars more massive than 1.68 increases more sharply than the number of lower mass stars, indicating mass segregation. Comparing the lower MS with the intermediate MS, the former is less concentrated, in accord with the mass segregation effects. In the outer regions at R pc, the number of giant stars appears to be still increasing, a feature already noticed by Mathieu (1984). Mathieu (1984) consider mass loss as a possible explanation for this unexpected effect: by losing mass the giant stars would reproduce the distribution of lower mass stars.

For being at the present time relatively close to the Galactic center, M 11 may have suffered the consequences of strong interactions with molecular clouds and/or tidal effects of the Galaxy determining its structure by affecting its tidal radius. In this respect, the internal dynamical processes occurring in M 11 are less effective in shaping the cluster overall structure than in the case of the older cluster NGC 188, which orbits the Galaxy in a path beyond the solar circle (Bonatto et al. 2005). An orbit calculation for M 11 would help to constrain its dynamical properties.
5 Radial luminosity and mass functions
LFs of the filtered CMD were determined for each 2MASS band separately and different annular regions corresponding to the cluster core, an intermediate annulus (RR pc), the halo (5.5 pcRlim) and the overall cluster extension (0 pcRRlim). The LFs have been properly corrected for the background field by subtracting the counts measured in the outer field (R(’)) from the counts per magnitude bin in each region scaled to their area. The main-sequence LFs constructed independently for each band were converted in one MF for each cluster region by fitting mass-luminosity relations (in J, H and ) from the solar metallicity 250 Myr isochrone. The overall MF and the MFs of the selected spatial regions are presented in Fig. 11 together with power-law MF (, where A is the MF normalization and is the MF slope) weighted fittings. The resulting MF slopes are shown in Table 1. The regions sampled are the core, the inner and outer halo and the overall cluster. The MF slope in the core is very flat, comparable to those of the cores of M 93, NGC 2477 and NGC 3680 (Bonatto & Bica 2005). M 11 presents a MF slope gradient from the core to the outer regions, which is characteristic of large-scale mass segregation. The overall MF slope value is similar to the standard Salpeter one, and comparable to most of the classical open clusters studied in Bonatto & Bica (2005).

In order to determine the total cluster mass from the overall MF, it was extrapolated to m M⊙ down to the H-burning limit using the universal MF model by Kroupa (2001), which gives for m(M⊙) and for m(M⊙). The slope was applied to the observed portion of the MF, which spans MS masses between m(M⊙). Following this procedure we get m(MS)=() M⊙.
The mass content in evolved stars was computed from the integrated LF above the turnoff at M and the corresponding isochrone mass interval of the CMD observed stars. According to the 250 Myr isochrone, we observe evolved stars in the mass range m(M⊙) with a strong concentration around m=3.62 M⊙ in the giant clump region (see Fig. 4). We assume a typical mass for the evolved stars in M 11 of m M⊙ and use it to get the total mass in evolved stars, i. e., m(post-MS)= M⊙.
Therefore, the total mass obtained for M 11 inside a circular area of radius 11.5 pc is () M⊙.
MFs in the selected regions of the cluster were used to compute the total mass of the subsystems. They are presented in Table 1.
| Evolved | |||||||||||
| Region | N∗ | ||||||||||
| (pc) | (Stars) | () | (stars) | () | () | () | (stars) | () | () | () | |
| (1) | (2) | (3) | (4) | (5) | (6) | (7) | (8) | (9) | (10) | (11) | (12) |
-
Col. 4 gives the MF slope derived for the observed MS mass range. The mass of the evolved stars is included in (col. 6) and (col. 10).
The relation between the tidal radius and the cluster mass as given by King (1962) was also used to compute a total mass for M 11. Mathematically: m=3M, where Rp is the perigalacticon distance and MG is the Galactic mass inside Rp. Assuming a nearly circular orbit for M 11, and consequently Rp=dCG= kpc, and MM⊙ (Carraro & Chiosi 1994), we get an expected mass of , the large error coming from the uncertainty in the tidal radius. Such a theoretical value is about 2 times larger than our estimate.
The relaxation time of a star system can be defined as ttcross, where tR/ is the crossing time, N is the total number of stars and is the velocity dispersion (Binney & Tremaine 1987). trelax is the characteristic time scale in which the cluster reaches some level of kinetic energy equipartition with massive stars sinking to the core and low-mass stars being transferred to the halo. Using the velocity dispersion found for M 11 of km/s (McNamara & Sanders 1977) we obtain t Myr for the whole cluster and t Myr for the cluster core. The MF slope flattening towards the center, as an evidence of mass segregation observed in M 11 is consistent with the cluster core being dynamically evolved in agreement with trelax in the core, which is smaller than the cluster age.
6 Concluding remarks
We employed 2MASS photometry to explore the structure and stellar content of the open cluster M 11, which is located internal to the Solar circle. The near-IR photometry basically confirmed previous photometric parameters derived from the optical. We studied this cluster with spatial resolution, owing to the wide-angle analysis allowed by 2MASS data. We obtained a core radius of 1.23 pc and a tidal radius of 29 pc. The latter value was obtained by fitting the three-parameter King profile to the radial distribution of stars, which is possible only for the more populous and highest-contrast open clusters.
The spatial distribution of mass functions showed a very flat one in the core () and a steep halo one (), particularly in the outer region. Mass segregation is implied by the results. The overall mass function slope is similar to a standard Salpeter one. The spatial distribution of mass function slopes derived from 2MASS agrees with that derived from optical CCD data, which further confirms the reliability of 2MASS data for future analyses of this kind at comparable observational limits.
The cluster is massive, with a total (extrapolating the mass function to 0.08 M⊙) mass of , which is somewhat larger than previous estimates.
The large cluster mass of M 11 is a slowing down factor of dynamical evolution because of a longer relaxation time. However, its position well within the Solar circle is expected to speed it up because of stronger tidal effects (e.g. de la Fuente Marcos & de la Fuente Marcos 2002; Bergond et al. 2001; Bonatto & Bica 2005).
Acknowledgements.
This publication makes use of data products from the Two Micron All Sky Survey, which is a joint project of the University of Massachusetts and the Infrared Processing and Analysis Center/California Institute of Technology, funded by the National Aeronautics and Space Administration and the National Science Foundation. We also thank the referee, Dr. J.-C. Mermilliod, for helping to improve the work and for the use of the WEBDA open cluster database. We acknowledge support from the Brazilian Institutions CNPq and FAPEMIG.References
- Alter et al. (1970) Alter, G., Ruprecht, J., & Vasinek, J. 1970, in Catalogue of Star Clusters and Associations, ed. G. Alter, B. Balázs, & J. Ruprecht (Akademiai Kiado, Budapeste)
- Bergond et al. (2001) Bergond, G., Leon, S. & Guibert, J. 2001, A&A, 377, 462
- Bica et al. (2004) Bica, E., Bonatto, C., & Dutra, C. 2004, A&A, 422, 555
- Binney & Tremaine (1987) Binney, J., & Tremaine, S. 1987, in Galactic Dynamics, Princeton, NJ: Princeton University Press. (Princeton series in astrophysics)
- Bonatto & Bica (2003) Bonatto, C., & Bica, E. 2003, A&A, 405, 525
- Bonatto & Bica (2005) Bonatto, C. & Bica, E. 2005, A&A, in press (astro-ph//0503589)
- Bonatto et al. (2004) Bonatto, C., Bica, E., & Girardi, L. 2004, A&A, 415, 571
- Bonatto et al. (2005) Bonatto, C., Bica, E., & Santos Jr., J.F.C. 2005, A&A, 433, 917
- Brocato et al. (1993) Brocato, E., Castellani, V., & Digiorgio, A. 1993, AJ, 105, 2192
- Carraro & Chiosi (1994) Carraro, G., & Chiosi, C. 1994, A&A, 288, 751
- de la Fuente Marcos & de la Fuente Marcos (2002) de la Fuente Marcos, R. & de la Fuente Marcos, C. 2002, ApSS, 280, 381
- Johnson et al. (1956) Johnson, H.L., Sandage, A.R., & Wahlquist, H.D. 1956, ApJ, 124, 81
- King (1962) King, I. 1962, AJ, 67, 471
- King (1966) King, I. 1966, AJ, 71, 64
- Kroupa (2001) Kroupa, P. 2001, MNRAS, 322, 231
- Marigo et al. (2003) Marigo, P., Girardi, L., & Chiosi, C. 2003, A&A, 403, 225
- Mathieu (1984) Mathieu, R.D. 1984, ApJ, 284, 643
- McNamara et al. (1977) McNamara, B.J., Pratt, N.M., & Sanders, W.L. 1977, A&AS, 27, 117
- McNamara & Sanders (1977) McNamara, B.J., & Sanders, W.L. 1977, A&A, 54, 569
- Mermilliod (1996) Mermilliod, J.-C. 1996, in The Origins, Evolution, and Destinies of Binary Stars in Clusters, ASP Conf. Series, eds. E. F. Milone & J.-C. Mermilliod, 90, 475
- Nilakshi et al. (2002) Nilakshi, Sagar, R., Pandey, A.K., & Mohan, V. 2002, A&A, 383, 153
- Raboud & Mermilliod (1998a) Raboud, D., & Mermilliod, J.-C. 1998a, A&A, 329, 101
- Raboud & Mermilliod (1998b) Raboud, D., & Mermilliod, J.-C. 1998b, A&A, 333, 897
- Reid (1993) Reid, M.J. 1993, ARA&A, 31, 345
- Ruprecht (1966) Ruprecht, J. 1966, BAICz, 17, 33
- Santos et al. (1990) Santos Jr., J.F.C., Bica, E., & Dottori, H. 1990, PASP, 102, 454
- Skrutskie et al. (1997) Skrutskie, M., Schneider, S.E., Stiening, R., et al. 1997, in The Impact of Large Scale Near-IR Sky Surveys, ed. Garzon et al., Kluwer (Netherlands), 210, 187
- Sung et al. (1999) Sung, H., Bessell, M.S., Lee, H.-W., Kang, Y.H., & Lee, S.-W. 1999, MNRAS, 310, 982
- Trumpler (1930) Trumpler, R.J. 1930, Lick Observatory Bulletin, 14, 154
- Twarog et al. (1997) Twarog, B.A., Ashman, K.M., & Anthony-Twarog, B.J. 1997, AJ, 114, 2556