The 2MASS galaxy angular power spectrum: Probing the galaxy distribution to Gigaparsec scales
Abstract
We present an angular power spectrum analysis of the 2 Micron All Sky Survey (2MASS) full release extended source catalogue. The main sample used includes 518 576 galaxies below an extinction-corrected magnitude of 13.5 and limited to . The power spectrum results provide an estimate of the galaxy density fluctuations at extremely large scales, 1000 Mpc. We compare this with mock predictions constructed from the CDM Hubble Volume mock catalogue. We find that over the range 1100 the 2MASS is steeper than that for the Hubble Volume model. However, in the linear regime (30) there is good agreement between the two. We investigate in detail the effects of possible sources of systematic error. Converting linear power spectrum predictions for the form of the three-dimensional matter power spectrum, , and assuming a flat CDM cosmology, a primordial =1 spectrum and negligible neutrino mass, we perform fits to the galaxy angular power spectrum at large linear scales (30, corresponding to 50Mpc). We obtain constraints on the galaxy power spectrum shape of , in good agreement with previous estimates inferred at smaller scales. We also constrain the galaxy power spectrum normalisation to (); in combination with previous constraints on we infer a -band bias of =1.390.12. We are also able to provide weak constraints on and /. These results are based on the usual assumption that the errors derived from the Hubble Volume mocks are applicable to all other models. If we instead assume that the error is proportional to the amplitude then the constraints weaken; for example it becomes more difficult to reject cosmologies with lower .
keywords:
cosmological parameters - cosmology: observations - large-scale structure of the Universe - infrared: galaxies1 Introduction
The nature of galaxy fluctuations at extremely large scales ( 1000 Mpc) is poorly constrained. Over the last decade, large galaxy surveys have constrained the form of the galaxy density field to a few hundred Megaparsecs. However, the agreement with the concordance model at these scales can only be weakly inferred. Indeed, recent evidence has suggested that there may be excess power over the expected CDM form to the three-dimensional power spectrum of matter, , at large scales (Frith et al., 2005, 2004, 2003; Busswell et al., 2004) arising from large inhomogeneities in the local galaxy distribution.
In recent years, large redshift surveys of both galaxies (Cole et al., 2005; Percival et al., 2001; Zehavi et al., 2002) and QSOs (Outram et al., 2003) have determined at relatively small scales. Using the 2dF Galaxy Redshift Survey (2dFGRS), Cole et al. (2005) have constrained the form of galaxy density fluctuations to scales of 300Mpc and the associated cosmological parameters to =0.1680.016 and /=0.1850.046 (assuming =0.72). However, determining the power spectrum through such redshift surveys suffers from large statistical uncertainty at large scales due to the relatively few objects available, as well as uncertainties arising from cosmic variance due to the relatively small volumes surveyed.

Using imaging surveys as opposed to redshift surveys provides a greater number of objects over larger solid angles. With angular power spectrum analysis of such surveys it is therefore possible to constrain the form of galaxy fluctuations to extremely large scales. However, since the clustering signal from a particular scale in real space is smeared over a range of angular scales, cosmological constraints through comparisons with linear theory predictions at smaller scales cannot be made; the departure from linearity at scales of 40Mpc (Percival et al., 2001) affects the clustering signal in the angular power spectrum over a wide range of scales. Nevertheless at large scales, where this effect is insignificant, angular power spectrum analysis represents one of the most effective probes of local large-scale structure.
Previously, the galaxy angular power spectrum has been determined for the Sloan Digital Sky Survey Early Data Release, the Edinburgh-Durham Southern Galaxy Catalogue, and a sample of IRAS galaxies (Tegmark et al., 2002; Huterer, Knox & Nichol, 2001; Scharf et al., 1992, respectively), which along with the recent analyses of redshift surveys has constrained the form of galaxy fluctuations to Mpc .
The 2 Micron All Sky Survey (2MASS) has recently been completed and provides , and -band photometry for 1.6106 extended sources over the entire sky to 13.5 (Jarrett, 2004; Jarrett et al., 2000); at the time of writing this dataset represents the largest all sky galaxy survey. The 2MASS data therefore represents a uniquely powerful probe of the local galaxy density field at large scales; applying a galactic latitude cut of 20∘ in order to remove regions of high extinction and stellar contamination yields a sample containing 518 576 galaxies, probing a volume approximately 5 times larger than the final 2dF Galaxy Redshift Survey (2dFGRS) volume. A further advantage of 2MASS over previous datasets is that the photometry is extremely accurate with high completeness; the photometric zero-point calibration is accurate to 2-3 per cent; galaxy identification is 99 per cent reliable and the galaxy catalogue is 90 per cent complete for 20∘ (Jarrett, 2004).
In this paper, we use data from the 2MASS final release extended source catalogue to determine the -band galaxy angular power spectrum with the aim of determining the form of the clustering of galaxies at extremely large scales, and constraining the shape and normalisation of the power spectrum. In section 2, we describe the 2MASS dataset and the magnitude estimator used. The method of analysis is outlined and the 2MASS angular power spectrum is determined and compared to mock power spectra in section 3. In section 4, we investigate various sources of systematic error. We determine constraints for various cosmological parameters in section 5. The conclusions follow in section 6.
2 Data
2.1 The 2MASS Extended Source Catalogue
The 2 Micron All Sky Survey (2MASS) final release extended source catalogue provides , and -band photometry for over 1.6106 extended sources over the entire sky with high completeness to =13.5 (Jarrett, 2004).
Previously, in order to estimate the total -band magnitudes from the 2MASS second incremental release data, Cole et al. (2001) used the deeper -band Kron magnitudes, colour-corrected to the -band via the and default aperture magnitudes. The accuracy of this magnitude estimator was determined through a comparison with the -band photometry of Loveday (2000); the Loveday photometry had better signal-to-noise and resolution than the 2MASS scans and so enabled more accurate 2MASS magnitudes to be determined.
The final release data uses revised magnitude estimates and the default aperture magnitudes used in Cole et al. (2001) have been abandoned (Jarrett - priv. comm.). In Fig. 1 we show a selection of 2MASS -band magnitude estimates with the revised 2MASS photometry compared with the Loveday (2000) photometry used previously. In the place of the default aperture magnitudes used in Cole et al. (2001), we use fiducial elliptical Kron magnitudes in panels (b) and (d) to colour-correct the -band magnitudes to the -band. Of the many different magnitude estimates examined, the most accurate in terms of the scale error between the Loveday and 2MASS photometry and the zero-point offset uses the -band extrapolated magnitude colour-corrected to the -band as described above. Using the dust maps of Schlegel et al. (1998), the main galaxy sample uses extinction-corrected -band magnitudes calculated in this way.
In order to verify the usefulness of the magnitude estimator used in this work as an estimate of the total -band magnitude, we perform an internal check via a comparison with the magnitude estimates used in the 2MASS-selected 6dF Galaxy Survey (6dFGS). The 6dFGS -band magnitudes are determined using a surface brightness correction to the -band 20 mag. arcsec-2 isophotal elliptical aperture magnitude (Jones et al., 2004). We find excellent agreement with a slope of 1.022, an offset of 0.018 magnitudes and a spread of =0.048 magnitudes for 20∘ galaxies matched below .
The 2MASS dataset removes or flags sources identified as artefacts such as diffraction spikes and meteor streaks (Jarrett et al., 2000); we use the 2MASS to remove such objects. We also employ a colour cut (0.7 and 1.4) below =12 in order to remove a small number of objects identified as non-extragalactic extended sources (Maller et al., 2003, 2005). In this work, our main sample includes 518 576 13.5 galaxies above a galactic latitude of 20∘. For reference, the surface density is 19.1 deg-2. We also use a shallower sample limited at =12.5 and 20∘ which includes 124 264 galaxies and for which the surface density is 4.58 deg-2.
2.2 The CDM Hubble Volume Simulation
The Hubble Volume catalogues represent the largest volume N-body simulations of the Universe to date. The CDM simulation follows the evolution of 109 dark matter particles from 50 over a volume of 3000Mpc3 to a resolution of 3Mpc. The associated cosmological parameters are =0.3, =0.04, =0.7, =0.9 (Jenkins et al., 1998).
In this work, we construct mock 2MASS catalogues from the CDM Hubble Volume simulation dark matter particles. We divide the total volume into 27 virtually independent spherical volumes of Mpc. These are subjected to the 2MASS selection function:
| (1) |
(Baugh & Efstathiou, 1993; Maller et al., 2005) where is determined from the 2MASS-2dFGRS matched sample described in Frith et al. (2005); for reference =0.074 for 13.5 and =0.050 for 12.5. Equation 1 is normalised to match the total number of observed 2MASS galaxies for 20∘. Due to the volume of the 27 mock 2MASS catalogues, the selection function is artificially truncated for the 13.5 mocks at 0.156. However, this has a negligible effect on the work in this paper; at this redshift, 95 per cent of the galaxies are sampled for 13.5.
3 The 2MASS Angular Power Spectrum
3.1 Estimating the Power Spectrum
Following the usual method (e.g. Peebles, 1973; Hauser & Peebles, 1973; Peebles & Hauser, 1974; Scharf et al., 1992), the angular power is estimated through a spherical harmonic expansion of the surface density of galaxies. The coefficients of this expansion are determined over the observed solid angle :
| (2) |
where = is the observed number of galaxies per steradian. The angular power is then determined:
| (3) |
where,
| (4) |
The angular power is then normalised, subtracting the expected shot noise contribution:
| (5) |
such that =0 corresponds to a random distribution.
3.2 Fitting to the Power Spectrum
In order to compare the angular power spectrum with cosmological predictions, we determine an expected form for the angular power spectrum for various cosmological parameters using the relation between the three and two-dimensional power spectra:
| (6) |
(Scharf et al., 1992; Tegmark et al., 2002; Huterer, Knox & Nichol, 2001), which we normalise as before. Here, is the 2MASS selection function, and is a spherical Bessel function. The 2MASS selection function is determined using equation 1.
We use the transfer function fitting formulae of Eisenstein & Hu (1998) to obtain a linear theory prediction for the dark matter power spectrum, , with input parameters for the matter, vacuum, baryon and neutrino densities (, , and ), (such that ) and matter power spectrum normalisation (). We also employ a linear biasing scheme such that = to provide a linear prediction for the galaxy . This is then transformed to a galaxy angular power spectrum prediction using the spherical Bessel function transform in equation 6.
3.3 Results
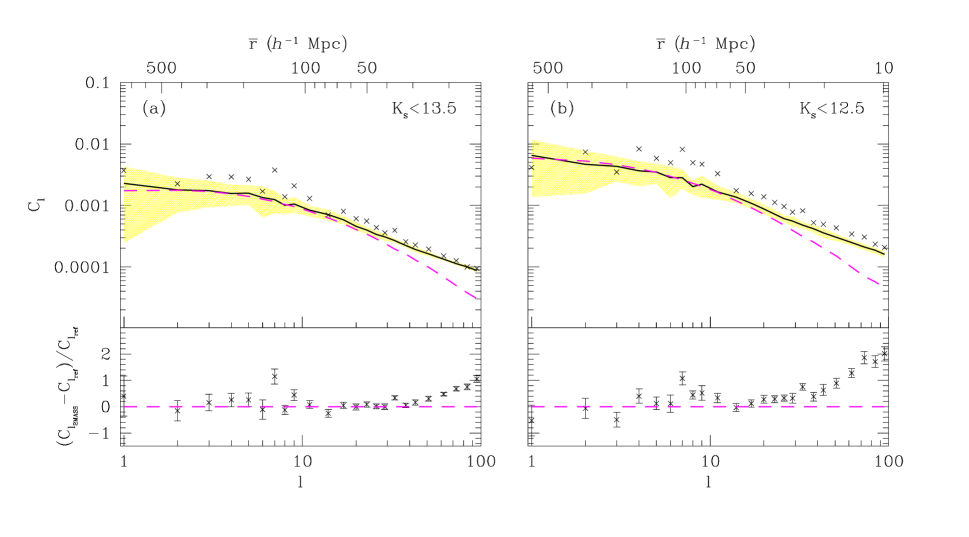
The angular power spectrum for 518 576 , 20∘ 2MASS galaxies is presented in Fig. 2a, determined through a spherical harmonic expansion of the galaxy number density as described in section 3.1. In order to determine the expected scatter due to cosmic variance we determine the angular power spectrum for the 27 unbiased mock 2MASS catalogues constructed from the CDM Hubble Volume simulation described in section 2.2; the mean and 1 spread are indicated by the solid line and shaded region. On the top -axis we also indicate the approximate distance scale probed by the angular power spectrum at the mean depth of the sample determined from the 27 mock 2MASS catalogues. At the very smallest -modes, the 13.5 power spectrum probes scales of 500Mpc.
We have also calculated the linear prediction corresponding to the CDM Hubble Volume input parameters (=0.3, =0.7, =0.04, =0.7, =0.9 and =0) through a spherical Bessel function transform of the three-dimensional power spectrum as described in section 3.2; this is indicated for a bias of 1.0 by the dashed line. The linear model and the mean mock 2MASS power spectrum are in good agreement at large scales. At smaller angular scales (30) the effects of non-linear clustering become significant.
In order to verify whether the form and scatter of the mock power spectra, which we later use to estimate the error on the observed angular power spectrum, is consistent with the data, we perform a fit between the two. We marginalise over the normalisation of the mean mock angular power spectrum and use the binning as shown in order to reduce the covariance to insignificant levels. We assume that the spread in the mock power spectra is independent of normalisation, i.e. we apply the same spread determined for the unbiased mock power spectra to the observed angular power spectrum. In this particular case, this is likely to provide an optimistic view of the observed errors since we are not shot noise limited. In this scenario, the errors are likely to be independent of the power spectrum amplitude; on the other hand, if the observed power spectrum is cosmic variance limited the errors scale with model normalisation (see Feldman, Kaiser & Peacock (1994) for further discussion on this point). We investigate the impact of this assumption on the associated cosmological constraints in section 5. First, we perform a fit over the full angular range 1100 between the 13.5 2MASS galaxy angular power spectrum and the mean mock 2MASS power spectrum; we find that =3.0. Limiting the angular range to scales which are not significantly affected by non-linear clustering (30), the form of the mock power spectra are in better agreement with the observed 2MASS galaxy angular power spectrum, with =2.0.
The form of the 2MASS angular power spectrum is therefore in good agreement with the CDM prediction in the linear regime, although it is clear from Fig. 2a that there is some difference in slope at small scales. Assuming the validity of the prediction, this is due either to scale-dependent bias in the non-linear regime or resolution effects in the Hubble Volume simulation. Consistency with the CDM prediction in the linear regime, of interest in this work, is confirmed through a comparison (in the lower panel) with the linear prediction for the CDM Hubble Volume simulation input parameters applying a scale-independent bias to match the normalisation of the observed power spectrum at large scales (see section 5).
4 Systematic Errors
4.1 Magnitude Limits
Before turning to the cosmological constraints inferred from the 2MASS galaxy angular power spectrum it is important to verify that the results are robust and not significantly affected by potential sources of systematic error. While the 2MASS catalogue is 98 per cent reliable for 20∘, 13.5 galaxies (Jarrett et al., 2000) and 99 per cent complete for 30∘, 12.013.7 galaxies (Maller et al., 2005), we wish to verify that the angular power spectrum is robust to changes in the magnitude limit, and is not adversely affected by variable incompleteness or reliability at faint magnitudes or scale errors in the photometry.
Fig. 2 shows the 2MASS galaxy angular power spectrum as a function of imposed magnitude limit. The shape and normalisation of the power spectrum, with respect to both the linear model and the mean mock 2MASS power spectrum, are remarkably robust to changes in the magnitude limit. The departure of the linear model from the observed power spectrum occurs at larger angular scales with the shallower magnitude limit due to the reduced mean depth of the sample. For this reason also, the mock 2MASS power spectrum is more significantly distorted at the very smallest scales by resolution affects resulting in a slightly steeper slope at 70.
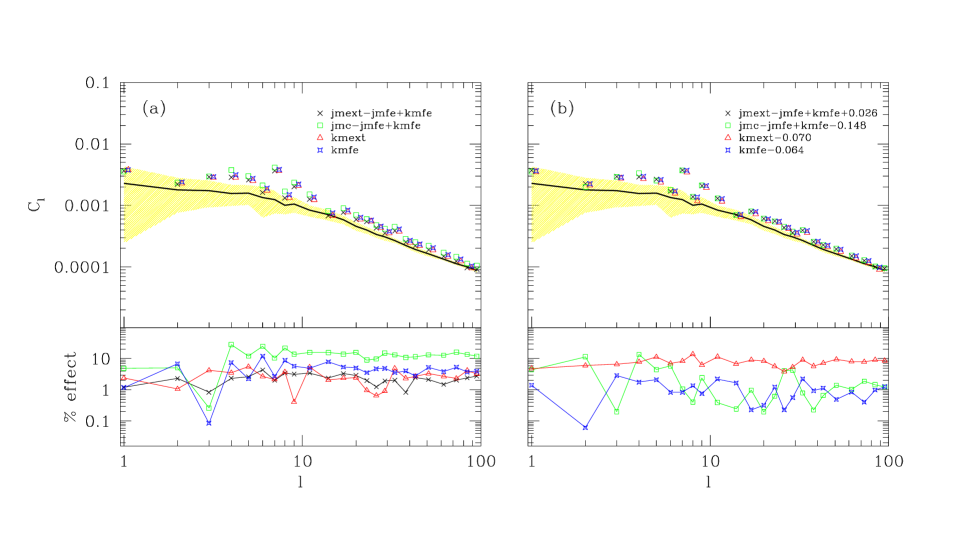
4.2 Magnitude Estimator
Throughout this paper, we estimate the -band magnitudes using the -band extrapolated magnitudes colour-corrected using the and -band fiducial elliptical Kron magnitudes, as this results in a smaller zero-point offset and scale error when compared to the more accurate -band photometry of Loveday (2000). We wish to investigate the effect on the power spectrum by the choice of magnitude estimator; in Fig. 3a and b we compare the power spectra for the four magnitude estimators presented in Fig. 1 with and without respectively the associated correction to the Loveday (2000) zero-point.
The power spectrum is robust to changes in the magnitude estimate and zero-point at the 10 per cent level. This is due to the fact that the change in the depth of the survey due to differences in the magnitude limit and scale error effects are insignificant.
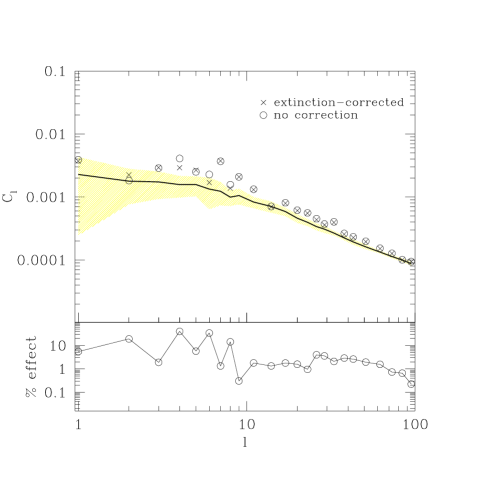
4.3 Extinction
While the level of extinction in the -band is low and the 2MASS magnitudes have been corrected using the Schlegel et al. (1998) dust maps, it is useful to examine the potential level of systematic error introduced by extinction. Fig. 4 shows the 2MASS galaxy angular power spectrum with and without correction for extinction. In this extreme case, the effect of removing the dust correction to the magnitude estimate is at the 10 per cent level at large scales and 1 per cent above 10.
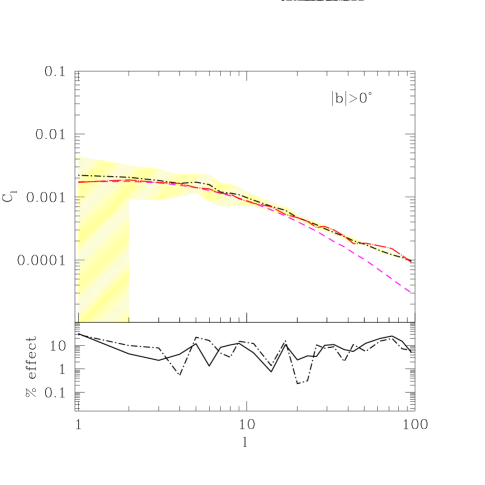
4.4 The Window Function
Throughout this paper a 20∘ galactic latitude cut is applied in order to avoid the high levels of extinction and stellar contamination in the zone of avoidance. We wish to determine the level of any systematic effect on the spread of the Hubble Volume mock power spectra (and therefore our interpretation of the statistical uncertainty) introduced by the window function. In Fig. 5 the 27 mock 2MASS power spectra and corresponding linear theory model for the CDM Hubble Volume input parameters are shown with no galactic latitude cut. Neither the shape nor the spread of the power spectra are significantly altered. The effect of the window function on the angular power spectrum is 5 per cent at all scales.
In order to check the consistency of our results we provide a further verification of the mock 2MASS power spectrum results through a comparison with the transform of the numerically-determined CDM Hubble Volume simulation (Carlton Baugh - priv. comm.). There is good agreement with both the 0∘ and 20∘ mean mock 2MASS power spectra.
5 Cosmological Constraints
Using the 2MASS galaxy angular power spectrum we have determined the form of the galaxy density field at extremely large scales and verified that it is not significantly affected by common sources of systematic error. We now wish to determine the associated cosmological constraints.
Using the Eisenstein & Hu (1998) transfer function fitting formulae we have determined linear theory predictions for the three-dimensional power spectrum of matter, , using input parameters of , , , and matter power spectrum normalisation, ; in the subsequent analysis we assume a negligible neutrino mass density, a primordial =1 spectrum and =1-. We form galaxy angular power spectrum predictions using the spherical Bessel function transform described in section 3.2 and a linear biasing scheme.
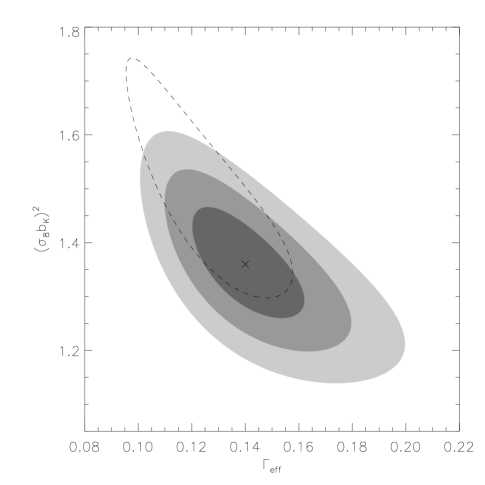
First, we perform fits to the galaxy power spectrum shape and normalisation. Assuming a CDM cosmology, the power spectrum can be defined through a parameterisation of the shape
| (7) |
(Sugiyama, 1995), and a normalisation, which for galaxy power spectra may be parameterised through the galaxy bias and . We constrain and ()2 using a grid of 200800 models between 0.10.3 and 0.0()8.0 respectively. We perform least squares fits to the 20∘, 13.5 angular power spectrum as shown in Fig. 2a at scales of 30 (binned as shown to reduce the covariance to insignificant levels); beyond 30 the angular power spectrum begins to be significantly affected by non-linear effects.
We take the spread determined from the 27 mock 2MASS angular power spectra in order to estimate the errors on the 2MASS datapoints, assuming that
the uncertainty remains the same for a biased as for an unbiased distribution (as in section 3.3). In doing this, we assume that
the CDM Hubble Volume mock catalogue provides an accurate description of the local galaxy distribution at large scales and that the
associated uncertainty in the datapoints is realistic. However, since these errors are valid only in an unbiased CDM cosmology we are
required to make assumptions as to the nature of the cosmic variance in the various other cosmologies scrutinised in these fits. Here we assume that
the errors are independent of cosmology and power spectrum normalisation; the likely impact of this assumption is examined below. We find that:
and
()
marginalising over the normalisation and power spectrum shape respectively. The associated confidence regions are indicated by the filled contours in
Fig. 6.
This value of is in excellent agreement with the 2dFGRS fit (Percival et al., 2001) of (for =0.7) and the WMAP value (Spergel et al., 2003) of (for =0.99). However, our value is slightly higher than the Maller et al. (2005) result which constrains at 95 per cent confidence using a measure of the three-dimensional -band galaxy power spectrum via an inversion of the 2MASS angular correlation function.
Our constraint on the -band galaxy power spectrum normalisation of () is also slightly higher than the Maller et al. (2005) result of =1.00.1. Using the WMAP-2dFGRS best fit matter power spectrum normalisation of (Bennett et al., 2003), we constrain the -band bias to , in reasonable agreement with previous measurements determined from the 2MASS clustering dipole of (Maller et al., 2003) and the 2MASS angular correlation function analysis of (Maller et al., 2005). The constraint on the bias derived in this work rejects at ; it appears therefore that galaxies selected in the -band are clustered more strongly than both the underlying mass distribution and galaxies selected in optical wavebands for which 1 (e.g. Verde et al., 2002; Gaztañaga, 1994).
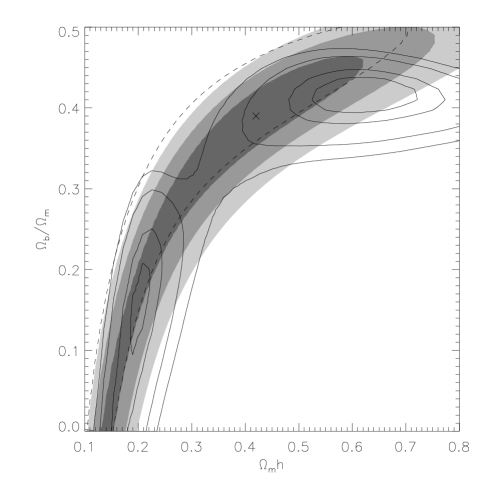
We are also able to provide constraints on other cosmological parameters. We fit to and / since these primarily determine the shape of the input and the size of the baryon oscillations. We determine model angular power spectra in a 715111 grid between 0.10.9, 0.0/0.5 and 0.40.9 (the effect of on the angular power spectrum is fairly small and we therefore use a lower resolution). We perform least squares fits to the 13.5, 20∘ angular power spectrum at scales of 30, using errors determined for the 2MASS datapoints as before which are independent of power spectrum normalisation.
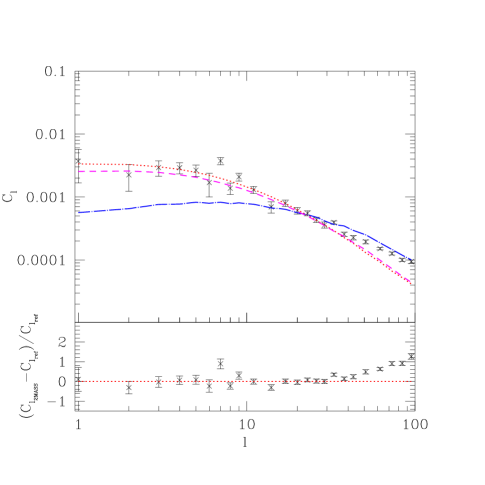
The filled contours in Fig. 7 show the associated confidence regions marginalising over the normalisation. We are able to provide weak constraints on the cosmology of 0.62 and /0.46 (at 1 confidence). These constraints are particularly insensitive to the baryon density since the acoustic oscillations detected in redshift survey analyses are smoothed over a wide range of angular scales. However our constraints are in good agreement with the previous results at smaller scales from the 2dFGRS (Percival et al., 2001; Cole et al., 2005). As an example of how our results can differentiate between different cosmological models we show the 2MASS galaxy angular power spectrum compared with CDM and SCDM predictions in Fig. 8.
We also wish to examine our assumption, used throughout this work, that the uncertainty due to cosmic variance determined from the 27 CDM mock 2MASS catalogues is independent of the power spectrum normalisation. To do this, we instead assume that the errors determined from the CDM mock catalogues simply scale with the model power spectrum normalisation as would be the case in the cosmic variance limited scenario, and compare the two cases. In Figs. 6 and 7 we show the associated 1 confidence regions by the dashed lines, marginalising over the power spectrum normalisation. We find best fit parameters of =0.1250.030, ()2=1.47, 0.52 and . This constraint on the galaxy power spectrum normalisation implies a -band bias of =1.44 (using the WMAP-2dFGRS constraint on as before). It is clear that while the associated confidence regions for each parameter are slightly larger the results are in fair agreement whichever error analysis is used. However, it is clear from Fig. 6 that using this alternative assumption about the errors it is more difficult to reject combinations of high bias and steeper slopes. For example, =0.05 would only be rejected at 2.5. More simulations of other cosmologies are needed to check whether these errors or the errors used elsewhere in this paper are most likely to be correct.
6 Conclusions
We have used 518 576 , galaxies selected from the 2MASS full release extended source catalogue to determine the associated angular power spectrum and constrain the form of galaxy fluctuations to Gigaparsec scales. We have compared this to a CDM N-body mock prediction constructed from the Hubble Volume simulation; it is in reasonable agreement although there is a discrepancy in the slopes at 30 in that the 2MASS result is significantly steeper than the mock prediction. We compare these to a linear theory prediction using the CDM Hubble Volume simulation input parameters; there is good agreement with the mock prediction at scales where non-linear effects are insignificant (30).
Possible sources of systematic error were investigated. We first examined the effect of imposed magnitude limit; the 2MASS angular power spectrum slope was robust with respect to the 2MASS mock and model predictions. The 2MASS galaxy angular power spectrum is also robust to different magnitude estimators and zero-point corrections (imposed to agree with the Loveday (2000) photometry) at the 10 per cent level. We correct for extinction using the Schlegel et al. (1998) dust maps; the effect on the angular power spectrum is 10 per cent at 10, and 1 per cent at smaller scales. Our results are also robust to window function effects; the effect of a cut is 5 per cent at all scales.
Finally, we have used linear theory predictions for the 2MASS galaxy angular power spectrum formed from the transfer function fitting formulae of Eisenstein & Hu (1998) to determine constraints on and / assuming a flat CDM cosmology, a primordial =1 spectrum and a negligible neutrino mass. Our results are in agreement with the 2dFGRS constraints (Percival et al., 2001), and we are able to provide weak constraints of 0.62 and /0.46 (at 1 confidence). Angular power spectrum analysis is particularly insensitive to the baryon density since any associated baryon oscillations are likely to be smoothed over a wide range of angular scales. However, given the huge volume probed (5 times the final 2dFGRS volume) the associated constraints on the power spectrum shape and normalisation are more significant. We also determine constraints for the galaxy power spectrum shape, , and normalisation, ()2. In agreement with the 2dFGRS and WMAP values, we find that . This is slightly higher than an alternative value found by Maller et al. (2005) using the 2MASS dataset of , determined through an inversion of the angular correlation function. We also tightly constrain the -band galaxy power spectrum normalisation to (). Using the WMAP-2dFGRS value of (Bennett et al., 2003), this implies a -band bias of .
We also investigated the likely impact on our assumption that the errors which we use to constrain various cosmological parameters, determined from the unbiased CDM mocks, are independent of cosmology and power spectrum normalisation by instead assuming that these errors simply scale with the power spectrum normalisation as would be the case in the cosmic variance limited scenario. We find that while the associated confidence regions are slightly larger the results are in fair agreement. However it becomes less easy to reject models with lower ; therefore although the data appears to prefer a CDM power spectrum slope, it may still not be possible to rule out a ssignificantly steeper .
Acknowledgements
This publication makes use of data products from the 2 Micron All-Sky Survey, which is a joint project of the University of Massachusetts and the Infrared Processing and Analysis Centre/California Institute of Technology, funded by the Aeronautics and Space Administration and the National Science Foundation. We thank Shaun Cole for useful discussion, Tom Jarrett for his help with the 2MASS magnitudes, Adrian Jenkins and Carlton Baugh for their assistance with the Hubble Volume mock catalogues, and Will Percival for providing the 2dFGRS constraints. We also thank David Johnston for useful comments.
References
- Baugh & Efstathiou (1993) Baugh, C.M. & Efstathiou, G. 1993, MNRAS, 265, 145
- Bennett et al. (2003) Bennett, C.L. et al. 2003, ApJS, 148, 1
- Bruzual & Charlot (1993) Bruzual, A.G., & Charlot, S. 1993, ApJ, 405, 538
- Busswell et al. (2004) Busswell, G.S., Shanks, T., Outram, P.J., Frith, W.J., Metcalfe, N. & Fong, R. 2004, MNRAS, 354, 991
- Cole et al. (2001) Cole, S.M. et al. 2001, MNRAS, 326, 555
- Cole et al. (2005) Cole, S.M. et al. 2005, submitted to MNRAS, astro-ph/0501174
- Colless et al. (2001) Colless, S. et al. 2001, astro-ph/0306581
- Driver (2003) Driver, S. 2003, IAUS, 216, 97
- Eisenstein & Hu (1998) Eisenstein, D.J. & Hu, W. 1998, ApJ, 496, 605
- Feldman, Kaiser & Peacock (1994) Feldman, H.A., Kaiser, N. & Peacock, J.A. 1994, ApJ, 426, 23
- Frith et al. (2003) Frith, W.J., Busswell, G.S., Fong, R., Metcalfe, N. & Shanks, T. 2003, MNRAS, 345, 1049
- Frith et al. (2004) Frith, W.J., Shanks, T. & Outram, P.J. 2004, astro-ph/0408011
- Frith et al. (2005) Frith, W.J., Shanks, T. & Outram, P.J. 2005, submitted to MNRAS, astro-ph/0411204
- Gaztañaga (1994) Gaztañaga, E. 1994, MNRAS, 268, 913
- Hauser & Peebles (1973) Peebles, P.J.E. & Hauser, M.G. 1973, ApJ, 185, 757
- Hawkins et al. (2003) Hawkins, E. et al. 2003, MNRAS, 346, 78
- Huterer, Knox & Nichol (2001) Huterer, D., Knox, L. & Nichol, R.C. 2001, ApJ, 555, 547
- Jarrett et al. (2000) Jarrett, T.H., Chester, T., Cutri, R., Schneider, S., Skrutskie, M. & Huchra, J.P. 2000, AJ, 119, 2498
- Jarrett (2004) Jarrett, T.H. 2004, astro-ph/0405069
- Jenkins et al. (1998) Jenkins, A. et al. 1998, ApJ, 499, 20
- Jones et al. (2004) Heath, D.H. et al. 2004, MNRAS, 355, 747
- Loveday (2000) Loveday, J. 2000, MNRAS, 312, 517
- Loveday et al. (1996) Loveday, J., Peterson, B.A., Maddox, S.J. & Efstathiou, G. 1996, ApJS, 107, 201
- Loveday (2004) Loveday, J. 2004, MNRAS, 347, 601L
- Maddox et al. (1990) Maddox, S.J., Sutherland, W.J., Efstathiou, G. & Loveday, J. 1990, MNRAS, 243, 692
- Maller et al. (2003) Maller, A.H., McIntosh, D.H., Katz, N. & Weinberg, M.D. 2003, ApJ, 598, 1
- Maller et al. (2005) Maller, A.H., McIntosh, D.H., Katz, N. & Weinberg, M.D. 2005, ApJ, 619, 147
- Metcalfe et al. (1995) Metcalfe, N., Fong, R. & Shanks, T. 1995, MNRAS, 274, 769
- Metcalfe et al. (2001) Metcalfe, N., Shanks, T., Campos, A., McCracken, H.J. & Fong, R. 2001, MNRAS, 323, 795
- Outram et al. (2003) Outram, P.J., Hoyle, F., Shanks, T., Croom, S.M., Boyle, B.J., Miller, L., Smith. R.J. & Myers, A.D. 2003, MNRAS, 342, 483
- Peebles (1973) Peebles, P.J.E.. 1973, ApJ, 185, 413
- Peebles & Hauser (1974) Peebles, P.J.E. & Hauser, M.G. 1974, ApJS, 28, 19
- Percival et al. (2001) Percival et al. 2001, MNRAS, 327, 1297
- Scharf et al. (1992) Scharf, C., Hoffman, Y., Lahav, O. & Lynden-Bell, D. 1992, MNRAS, 256, 229
- Schlegel et al. (1998) Schlegel, D.J., Finkbeiner, D.P. & Davis, M. 1998, ApJ, 500, 525
- Spergel et al. (2003) Spergel, D.N. et al. 2003, ApJS, 148, 175
- Sugiyama (1995) Sugiyama, N. 1995, ApJS, 100, 281
- Tegmark et al. (2002) Tegmark, M. et al. 2002, ApJ, 571, 191
- Verde et al. (2002) Verde, L. et al. 2002, MNRAS, 335, 432
- Yasuda et al. (2001) Yasuda, N. et al. 2001, AJ, 122, 1104
- Zehavi et al. (2002) Zehavi, I. et al. 2002, ApJ, 571, 172