“PAH” emission bands in selected planetary nebulae: a study of the behaviour with gas phase C/O ratio111based on observations with ISO, an ESA project with instruments funded by ESA member states (especially the PI countries: France, Germany, the Netherlands and the United Kingdom) and with the participation of ISAS and NASA
Abstract
Airborne and space-based low-resolution spectroscopy in the 1980s discovered tantalizing quantitative relationships between the gas phase C/O abundance ratio in planetary nebulae (PNe) and the fractions of total far-infrared luminosity radiated by the 7.7 and 11.3 m bands (the C=C stretch and C-H bend, respectively), of polycyclic aromatic hydrocarbons. Only a very small sample of nebulae was studied in this context, limited by airborne observations of the 7.7 m band, or the existence of adequate Low Resolution Spectrometer data for the 11.3 m band. To investigate these trends further, we have expanded the sample of planetaries available for this study using Infrared Space Observatory (ISO) low-resolution spectra secured with the Short Wavelength Spectrometer (SWS) and the Long Wavelength Spectrometer (LWS). The new sample of 43 PNe, of which 17 are detected in PAH emission, addresses the range from C/O = 0.213 with the objective of trying to delineate the pathways by which carbon dust grains might have formed in planetaries. For the 7.7-m and 11.3-m bands, we confirm that the ratio of band strength to total infrared luminosity is correlated with the nebular C/O ratio. Expressed in equivalent width terms, the cut-on C/O ratio for the 7.7-m band is found to be 0.6, in good accord with that found from sensitive ground-based measurements of the 3.3- band too.
keywords:
planetary nebulae, dust properties, abundances1 Introduction
Emission features occur near 3.3, 6.2, 7.7, 8.7, 11.3 m in infrared (IR) nebular spectra (Russell, Soifer & Merrill 1977; Russell, Soifer & Willner 1977; Sellgren, Werner & Dinerstein 1983; Aitken & Roche 1982; Roche & Aitken 1986). Airborne spectroscopy (Cohen et al. 1986,1989) shows these form a generic spectrum, with the most intense peaks unobservable from the ground (6.2,7.7 m); all band intensities are correlated; and the 7.7-m band tightly correlates with gas phase C/O ratio in planetaries (i.e., for newly formed dust, in a circumstellar environment). The features are attributed to vibrationally excited polycyclic aromatic hydrocarbons (PAHs) and related materials (Duley & Williams 1981; Leger & Puget 1984; Allamandola, Tielens & Barker 1985; Peeters et al. 2002). The PAHs are regarded as permeating almost every phase of the interstellar medium (ISM)(Allamandola, Hudgins, & Sandford 1999). Various components are recognized (Allamandola, Tielens & Barker 1989; Tielens 1993): the narrow features are carried by molecular-sized PAHs (50 C-atoms); larger PAH clusters (500 C-atoms) yield the plateaus underlying the narrow features; while the 25 and 60-m “cirrus” emission originates from amorphous carbon grains, perhaps built from PAHs, of size 5000 to 50,000 C-atoms. This hypothesis is supported by the obvious link between carbon abundance and the bands (Barlow 1983; Cohen et al. 1986,1989; Casassus et al. 2001), and the tight correlation between the 6.2 and 7.7-m bands (both from C=C skeletal modes). The 11.3-m feature is due to out-of-plane bending vibrations of peripheral H atoms attached to aromatic molecular units; its precise frequency depends on the number of adjacent H atoms on each edge ring (Bellamy 1958). The observed 11.3 and 12.7-m bands and the 10.5-14 m plateau of emission (Cohen, Tielens & Allamandola 1985) are characteristic of aromatic rings with nonadjacent, or 2 or 3 adjacent, peripheral H atoms (see also van Diedenhoven et al. 2004). With the advent of ISO (Kessler et al. 1996) spectra, additional features attributed to PAHs have been identified, such as the 16.4-m peak and plateau, attributed by Moutou et al. (2000) to C-triple bonds.
Using exclusively the Low Resolution Spectrometer (LRS) data base, Volk & Cohen (1990) sought a correlation of the 11.3-m band with C/O, finding an apparently constant value of 11.3-m strength for C/O1, with an abrupt transition near C/O = 1, the boundary between O- and C-rich nebulae. Any relationship between the 7.7-m or 11.3-m bands and gas phase C/O may also hold clues to the mechanisms of dust formation in planetaries, and might even elucidate the role of peripheral hydrogen atoms.
Understanding carbon dust formation has wide significance in astronomy, because AGB stars, the precursors of C-rich PNe, are the dominant formation sites known for refractory grains
| Object | TDT | AOT | Date | Integration(s) | LWS off? | Diam.(′′) | Diameter reference |
|---|---|---|---|---|---|---|---|
| BD+30∘3639 | 35501412 | LWS01 | 06-Nov-1996 | 1266 | N | 8.0 | Acker et al. (1992) |
| BD+30∘3639 | 35501531 | SWS01 | 06-Nov-1996 | 1140 | … | ||
| BD+30∘3639 | 86500540 | SWS01 | 29-Mar-1998 | 3454 | … | ||
| CPD-56∘8032 | 08401538 | LWS01 | 09-Feb-1996 | 1552 | N | 1.9 | De Marco et al. (1997) |
| CPD-56∘8032 | 13602083 | SWS01 | 01-Apr-1996 | 3462 | … | ||
| CPD-56∘8032 | 27301339 | SWS01 | 16-Aug-1996 | 1140 | … | ||
| Cn 1-5 | 47101650 | SWS01 | 01-Mar-1997 | 1912 | N | 27 | Schwarz et al. (1992) |
| Cn 1-5 | 47101651 | LWS01 | 01-Mar-1997 | 1052 | Y | ||
| Cn 1-5 | 48500404 | LWS01 | 15-Mar-1997 | 1908 | Y | ||
| Hb 12 | 43700330 | SWS01 | 26-Jan-1997 | 1912 | … | 0.4 | Zhang & Kwok (1993) |
| Hb 12 | 57101028 | LWS01 | 09-Jun-1997 | 1318 | Y | ||
| He 2-113 | 07903229 | LWS01 | 04-Feb-1996 | 1554 | Y | 1.3 | De Marco et al. (1997) |
| He 2-113 | 07903307 | SWS01 | 04-Feb-1996 | 1044 | … | ||
| He 2-113 | 43400768 | SWS01 | 23-Jan-1997 | 1912 | … | ||
| He 2-113 | 60701891 | LWS01 | 15-Jul-1997 | 620 | Y | ||
| He 2-113 | 66900121 | LWS01 | 14-Sep-1997 | 2228 | Y | ||
| He 2-131 | 07902010 | SWS01 | 04-Feb-1996 | 1044 | … | 6.0 | Zhang & Kwok (1993) |
| He 2-131 | 27301830 | LWS01 | 16-Aug-1996 | 1268 | N | ||
| Hu 1-2 | 35801255 | SWS01 | 09-Nov-1996 | 1912 | … | 8.2 | Zhang & Kwok (1993) |
| Hu 1-2 | 35801256 | LWS01 | 09-Nov-1996 | 710 | Y | ||
| Hu 2-1 | 13400705 | SWS01 | 30-Mar-1996 | 1834 | N | 1.8 | Acker et al. (1992) |
| IC 3568 | 21304921 | LWS01 | 17-Jun-1996 | 1256 | N | 12 | Zhang & Kwok (1993) |
| IC 3568 | 21304923 | SWS01 | 17-Jun-1996 | 1140 | … | ||
| IC 418 | 68900805 | LWS01 | 04-Oct-1997 | 3430 | Y | 12 | Acker et al. (1992) |
| IC 418 | 82901301 | SWS01 | 22-Feb-1998 | 1912 | … | ||
| IC 418 | 86801205 | LWS01 | 01-Apr-1998 | 3428 | Y | ||
| IC 4406 | 43600728 | SWS01 | 25-Jan-1997 | 1912 | … | 35 | Zhang & Kwok (1993) |
| IC 4406 | 44700327 | LWS01 | 05-Feb-1997 | 1318 | N | ||
| IC 4997 | 31901334 | SWS01 | 30-Sep-1996 | 1140 | … | 1.6 | Zhang & Kwok (1993) |
| IC 4997 | 37400215 | LWS01 | 24-Nov-1996 | 1858 | Y | ||
| IC 5117 | 36701822 | LWS01 | 18-Nov-1996 | 1858 | N | 1.4 | Zhang & Kwok (1993) |
| IC 5117 | 36701824 | SWS01 | 18-Nov-1996 | 1140 | … | ||
| M 1-42 | 48500234 | LWS01 | 15-Mar-1997 | 1316 | N | 9.0 | Zhang & Kwok (1993) |
| M 1-42 | 48500235 | LWS01 | 15-Mar-1997 | 1318 | N | ||
| M 1-42 | 70302306 | SWS01 | 19-Oct-1997 | 1912 | … | ||
| M 2-36 | 70302403 | SWS01 | 19-Oct-1997 | 1912 | … | 7.0 | Zhang & Kwok (1993) |
| M 4-18 | 83801755 | SWS01 | 02-Mar-1998 | 1912 | … | 3.7 | De Marco & Crowther (1999) |
| Mz 3 | 08402133 | LWS01 | 09-Feb-1996 | 1552 | Y | 25 | Zhang & Kwok (1993) |
| Mz 3 | 27300834 | SWS01 | 15-Aug-1996 | 1140 | … | ||
| NGC 2346 | 71602536 | LWS01 | 01-Nov-1997 | 2230 | N | 55 | Zhang & Kwok (1993) |
| NGC 2346 | 71602537 | SWS01 | 01-Nov-1997 | 1912 | … | ||
| NGC 2440 | 72501762 | SWS01 | 10-Nov-1997 | 1912 | … | 18 | Zhang & Kwok (1993) |
| NGC 3918 | 26700720 | LWS01 | 09-Aug-1996 | 1268 | Y | 16 | Zhang & Kwok (1993) |
| NGC 3918 | 29900201 | SWS01 | 10-Sep-1996 | 1140 | N | ||
| NGC 40 | 30003803 | SWS01 | 12-Sep-1996 | 3454 | … | 36.4 | Zhang & Kwok (1993) |
| NGC 40 | 44401917 | SWS01 | 02-Feb-1997 | 1912 | … | ||
| NGC 40 | 47300616 | LWS01 | 03-Mar-1997 | 1318 | Y | ||
| NGC 5189 | 31800124 | LWS01 | 29-Sep-1996 | 1266 | Y | 140 | Zhang & Kwok (1993) |
| NGC 5189 | 31800125 | SWS01 | 29-Sep-1996 | 1140 | … | ||
| NGC 5315 | 07902104 | SWS01 | 04-Feb-1996 | 1044 | … | 6.1 | Zhang & Kwok (1993) |
| NGC 5315 | 28001926 | LWS01 | 23-Aug-1996 | 1268 | Y | ||
| NGC 5315 | 43600267 | SWS01 | 25-Jan-1997 | 1912 | … | ||
| NGC 6153 | 08402635 | LWS01 | 09-Feb-1996 | 1552 | Y | 23 | Zhang & Kwok (1993) |
| NGC 6153 | 08402713 | SWS01 | 09-Feb-1996 | 1044 | … | ||
| NGC 6153 | 45901470 | SWS01 | 17-Feb-1997 | 1912 | … | ||
| NGC 6210 | 30400331 | SWS01 | 15-Sep-1996 | 1912 | … | 16 | Zhang & Kwok (1993) |
| NGC 6210 | 30400332 | LWS01 | 15-Sep-1996 | 650 | Y | ||
| NGC 6210 | 46300706 | LWS01 | 21-Feb-1997 | 586 | Y | ||
| NGC 6302 | 09400716 | SWS01 | 19-Feb-1996 | 6528 | … | 45 | Zhang & Kwok (1993) |
| NGC 6302 | 28901940 | LWS01 | 01-Sep-1996 | 1266 | Y | ||
| NGC 6369 | 31100910 | LWS01 | 23-Sep-1996 | 1340 | N | 29 | Zhang & Kwok (1993) |
| NGC 6369 | 45601901 | SWS01 | 14-Feb-1997 | 1140 | … |
| Object | TDT | AOT | Date | Integration(s) | LWS off? | Diameter( | Diameter reference |
|---|---|---|---|---|---|---|---|
| NGC 6445 | 48700507 | SWS01 | 17-Mar-1997 | 1912 | … | 33 | Zhang & Kwok (1993) |
| NGC 6445 | 48700508 | LWS01 | 17-Mar-1997 | 640 | Y | ||
| NGC 6537 | 47000722 | SWS01 | 28-Feb-1997 | 1912 | … | 75 | Schwarz et al. (1992) |
| NGC 6537 | 47000802 | LWS01 | 28-Feb-1997 | 1318 | Y | ||
| NGC 6537 | 70300475 | SWS01 | 18-Oct-1997 | 3454 | … | ||
| NGC 6543 | 02400714 | SWS01 | 11-Dec-1995 | 6544 | … | 20 | Zhang & Kwok (1993) |
| NGC 6543 | 02400807 | SWS01 | 11-Dec-1995 | 3484 | … | ||
| NGC 6543 | 02400910 | SWS01 | 11-Dec-1995 | 1096 | … | ||
| NGC 6543 | 02800908 | SWS01 | 15-Dec-1995 | 1094 | … | ||
| NGC 6543 | 03201202 | SWS01 | 19-Dec-1995 | 1860 | … | ||
| NGC 6543 | 25500701 | LWS01 | 28-Jul-1996 | 1266 | … | ||
| NGC 6572 | 30901603 | LWS01 | 21-Sep-1996 | 1266 | Y | 14. | Zhang & Kwok (1993) |
| NGC 6572 | 31901125 | SWS01 | 30-Sep-1996 | 1140 | … | ||
| NGC 6720 | 17601005 | LWS01 | 11-May-1996 | 4321 | N | 70 | Zhang & Kwok (1993) |
| NGC 6720 | 36600206 | LWS01 | 16-Nov-1996 | 1268 | N | ||
| NGC 6720 | 36600207 | SWS01 | 16-Nov-1996 | 1140 | … | ||
| NGC 6741 | 13401806 | SWS01 | 30-Mar-1996 | 1062 | … | 7.8 | Zhang & Kwok (1993) |
| NGC 6790 | 13401107 | SWS01 | 30-Mar-1996 | 1062 | … | 1.8 | Zhang & Kwok (1993) |
| NGC 6790 | 13401608 | LWS01 | 30-Mar-1996 | 1330 | N | ||
| NGC 6826 | 30201113 | LWS01 | 14-Sep-1996 | 1266 | N | 25 | Zhang & Kwok (1993) |
| NGC 6826 | 30201114 | SWS01 | 14-Sep-1996 | 1140 | … | ||
| NGC 6884 | 13901709 | SWS01 | 04-Apr-1996 | 1834 | … | 6.0 | Zhang & Kwok (1993) |
| NGC 6886 | 13400810 | SWS01 | 30-Mar-1996 | 1062 | … | 7.4 | Zhang & Kwok (1993) |
| NGC 6891 | 37600943 | SWS01 | 27-Nov-1996 | 1912 | … | 12.6 | Zhang & Kwok (1993) |
| NGC 6891 | 37600944 | LWS01 | 27-Nov-1996 | 1166 | Y | ||
| NGC 7009 | 34400517 | LWS01 | 25-Oct-1996 | 1268 | N | 27 | Zhang & Kwok (1993) |
| NGC 7009 | 34400518 | SWS01 | 25-Oct-1996 | 1140 | … | ||
| NGC 7009 | 73801242 | SWS01 | 23-Nov-1997 | 1912 | … | ||
| NGC 7027 | 02401183 | SWS01 | 11-Dec-1995 | 6542 | … | 15 | Acker et al. (1992) |
| NGC 7027 | 23001256 | SWS01 | 04-Jul-1996 | 1140 | … | ||
| NGC 7027 | 23001357 | SWS01 | 04-Jul-1996 | 1912 | … | ||
| NGC 7027 | 23001458 | SWS01 | 04-Jul-1996 | 3453 | … | ||
| NGC 7027 | 55800537 | SWS01 | 27-May-1997 | 6537 | … | ||
| NGC 7027 | 71300611 | LWS01 | 28-Oct-1997 | 2156 | N | ||
| NGC 7662 | 43700427 | SWS01 | 26-Jan-1997 | 1912 | … | 26 | Zhang & Kwok (1993) |
| NGC 7662 | 56801325 | LWS01 | 06-Jun-1997 | 1318 | N | ||
| Sw St 1 | 47101511 | SWS01 | 01-Mar-1997 | 1140 | … | 1.5 | Schwarz et al. (1992) |
| Vy 2-2 | 32002528 | SWS01 | 02-Oct-1996 | 1140 | … | 0.6 | Zhang & Kwok (1993) |
| Vy 2-2 | 54700310 | LWS01 | 16-May-1997 | 1318 | N |
subsequently injected into the ISM. Models for soot formation in flames have been proposed, based on neutral radicals, ions, PAHs, polyacetylenic chains, or fullerenes as intermediaries (Hucknall 1985; Barnard & Bradley 1985; Curl & Smalley 1988; Ugarte 1992,1995; Hecht 1986; Iglesias-Groth 2004). Each route could probably lead to C-soot, depending on specific physical conditions. Our goal is to explore these routes, using C-rich planetaries as laboratories to seek the precursors to C-dust grains. Strong nebular UV fields excite the PAHs and the resulting emission serves as a direct probe of the molecular gas content.
2 The sample of Planetary Nebulae
There are two ways to investigate the dependence of PAHs on gas-phase C/O in PNe: using a single well-studied band from the ground; or measuring the strongest bands from airborne and space-borne observatories. An example of the former approach is the survey of the 3.3-m band by Roche et al. (1996), who used common instrumentation for their entire sample of PNe. Previous space-based and airborne work on the relationships between the PAH bands and nebular C/O has depended upon the use of measurements made with a variety of instruments, with different apertures, and at different spectral resolutions. This approach encounters the problem of poor sensitivity to either the 11.3-m band from the Kuiper Airborne Observatory (KAO) or to the 3.3-m band from the ISO SWS. It is clearly important to cover a wide range of IR wavelengths with common instrumentation for this work, so that any trends found are not compromised. ISO afforded a unique opportunity to secure the requisite measurements.
However, such observations were clearly predicated primarily on the IR brightness of the nebulae, without specific regard to their C/O ratios. Therefore, the PNe we have selected have well-determined C/O values, with broad agreement among several authors and different analytical methodologies (e.g. Kingsburgh & Barlow 1994; Rola & Stasinska 1994; Zuckerman & Aller 1986). Further, we have isolated precisely those nebulae whose C/O values bear most directly on the investigation of the trends with PAH band strength found in the old airborne data.
Table 1 summarizes the set of PNe assembled for this study; objects are listed alphabetically. For each PN spectrum we tabulate the name, TDT (ISO’s observation identification number), the astronomical observing template (AOT), date, integration time, whether an LWS01 spectrum was obtained in an “off” position, the angular diameter in arcsec, and a reference for the adopted diameter. We initially selected all PNe for which AOTs SWS01 and LWS01 (low-resolution spectra) were obtained by ISO. The prerequisite for PN selection was the existence of a published value of C/O (eliminating such objects as M 2-43 with its bright PAH emission but no C/O abundance ratio). The SWS aperture varies with wavelength. From 2-12 m, the size is between 14′′ and 20′′ across the several bands; from 12-29 m, between 14′′ and 27′′; and from 29-45 m, between 20′′ and 33′′. The sample includes three large PNe that extend substantially outside the SWS apertures. One of these is even larger than the LWS apertures (NGC 5189). For several nebulae of interest (i.e. with sizeable C/O) no LWS01 spectra were taken by ISO because of far-infrared (FIR) faintness (e.g. M 4-18) yet the PAHs were well-detected by the SWS. Therefore, we extended the sample to PNe for which SWS01 and 60/100-m photometry were available, but which lacked any usable LWS01 spectra (i.e. absent, or too noisy).
The restriction to PNe for which SWS01 spectra are available through the ISO Data Archive leads to a bimodal sample of nebulae. Both PNe with bright emission lines and very weak IR continua, and PNe of types known to exhibit PAH emission bands with strong IR continua (e.g. the [WCL] sequence whose central stars show Wolf-Rayet-like emission spectra) were almost equally frequently targeted by the observing community. The integration times used for the sample varied by a factor of six, depending on the goals of the original observers. Consequently, we can offer no statement as to the completeness of our sample based upon any physical characteristic.
For two PNe multiple data sets exist because those objects had been designated as LWS wavelength calibrators (NGC 7027 (26 spectra) and NGC 6543 (94)). For these objects, a single representative LWS01 spectrum was chosen. NGC 6543 was also observed on five occasions in the SWS01 AOT but we coadded all five spectra using inverse-variance weighting to enhance the signal-to-noise ratio.
3 The available spectra
The two relevant ISO spectroscopic instruments are the SWS (de Graauw et al. 1996) and LWS (Clegg et al. 1996). In each case we sought low-resolution data from the AOTs “SWS01” (covering the range from 2.38 to 45.2 m), and “LWS01” (43-197 m).
The SWS01 data include all the known mid-infrared PAH emission bands and emission plateaus (3.2-3.6, 6-9, 10.5-15, and 16-21 m) between 3 and 21 m. The SWS apertures were generally well-matched to the optical and radio diameters of the selected PNe. Typical achieved resolving powers were several hundred for AOTs taken at the fastest speed (i.e. shortest observing time 1100s), although the data archive includes higher resolution spectra for some of our chosen PNe that were observed at the slowest speeds (e.g. resolving power 1500 for 6500s observing time).
LWS01 AOTs serve to assess the luminosity of the commonly found thermal emission from cool dust grains in PNe. The LWS01 spectra have a resolution of 0.3 m from 43–93 m, and 0.6 m from 84–197 m. Observing times with the LWS ranged from 640 to 3400s, through an aperture with an effective diameter of 66–86′′, depending on wavelength.
The Spitzer Space Telescope (SST) and its infrared spectrometer (IRS) are able to observe PNe. However, the great sensitivity of this observatory and its instruments implies that many of the known PNe with PAH emission are too bright for spectroscopy with the SST. Further, the small slits of the IRS cannot accommodate most of our target PNe. Consequently, the ISO Data Archive offers an opportunity to revisit many of the PNe known to show PAH emission, with apertures that generally are sufficiently large to capture essentially all the PAH emission across these objects (Smith, Aitken & Roche 1989) or from their surrounding photodissociation regions (PDRs) (Aitken & Roche 1983).
We visually inspected all SWS01 spectra for PNe that survived our selection criteria, seeking detections of the PAH features. Nebulae clearly showing the bands were investigated first. Subsequently we examined the remaining PNe with the goal of setting quantitative upper limits on their PAH emission.
4 Band integrals and the join of SWS and LWS spectra
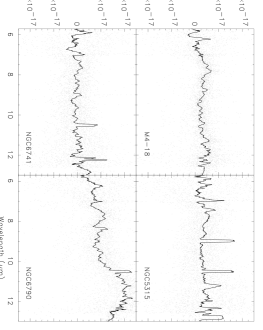
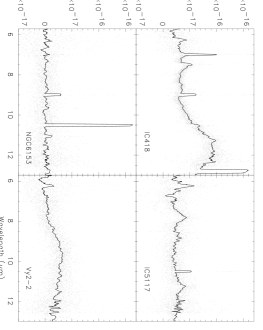
The PAH bands are low-resolution features. Therefore, to enhance the detectability of the bands with SWS spectra, we interactively used boxcar-smoothing (with widths of 50 or 75 points) better to define the overall continuum and PAH features in noisy data. Figures 1 and 2 illustrate the results of this smoothing applied to eight PNe. The 7.7-m and 11.3-m PAH bands were integrated after interactively defining a single underlying continuum in each PN across the m range. The wavelengths selected to define these continua (by cubic splines) and the regions chosen for the band integrals were those described by Cohen et al. (1986,1989) and Volk & Cohen (1990), for which choices the original relationships between integrated 7.7 or 11.3-m intensity and C/O were found. Care was taken to remove any influence of smoothed emission lines on these band integrals. For example, the 7.46-m Pf line was cut out of those nebulae in which it was detected, by replacing it by a local smooth continuum at the base of the line in the original, unsmoothed, SWS spectra. Likewise, in high-excitation PNe, we expunged the [Nevii] line at 7.65 m prior to smoothing and integrating the emission bands. In the absence of any visual recognition of the PAH features, formal upper limits were set by one of two methods. We measured the nearest positive emission hump lying within the wavelength interval for definition of a PAH integration. In addition we computed the formal integral over the same wavelength range of the mean spectrum plus 3 the standard deviation calculated over the interval. Differences arose between these two methods primarily when a spectrum had negative values or when the splined continuum locally exceeded the measured spectrum. We adopted whichever approach yielded the more conservative upper limit.
.
To evaluate the total, integrated, observed IR energy, I(IR), we assembled complete SWS+LWS energy distributions by splicing together the two data sets for each PN in the overlap region from 40-45 m. From past experience of this procedure (e.g. Cohen et al. 2002) we have determined that LWS01 spectra are better absolutely calibrated in this region than SWS. Moreover, if a PN extends slightly outside the SWS aperture, the larger LWS aperture will more reliably assess the total nebular continuum. Therefore, we visually examined the overlap and rescaled each SWS spectrum upwards to achieve the best match to the LWS when necessary. This approach assumes that the PN emission lying outside the SWS Band-4 aperture is spectrally identical to that sampled within the aperture.
Given the complete spliced energy distribution, each spectrum was examined overall to eliminate any remaining specious features at the long end of the SWS band-4 range and/or the beginning of the LWS detector SW1 range. The resulting cleaned and spliced spectra were then merged. When a PN had multiple spectra these were combined using inverse-variance weighting, before splicing the resulting SWS and LWS data.
For the ten PNe lacking adequate LWS01 spectroscopy, but having FIR photometry, we used 60 and 100-m flux densities as a substitute for absent, or an alternative to noisy, LWS01 data to estimate the FIR contribution to I(IR). We summed the products of flux density and bandwidth at 60/100 m, using the synthetic contiguous bandwidths of Emerson (1988) to avoid the uncertainties involved in color correction for PNe due to emission lines. Upper limits at either 60 or 100 m were treated as actual flux densities to assess the calculated FIR component of the IR luminosity. (These ten PNe are identified in Figures 3 and 4 by having a large plus sign through their plot symbols, and by asterisks in Table 2.) Tests were made on several PNe for which we had LWS01 data, comparing I(IR) derived by the two methods. These indicated that using data in this fashion produced values of I(IR) within 25 percent of the actual integrated SWS+LWS spectra.


5 Results
Table 2 presents the results, listing PN name, gas-phase C/O abundance ratio, I(IR) (in W cm-2), I(7.7)/I(IR), I(11.3)/I(IR), and a reference for the C/O value adopted. Whenever possible, we have selected abundance ratios derived from collisionally excited forbidden lines (CELs) rather than from optical recombination lines (ORLs). PNe often yield substantially different abundance ratios when determined by the two methods (e.g. Liu et al. 2000,2001a; Tsamis et al. 2004). Liu et al. (2000) have argued for the existence of H-deficient ionized clumps in PNe, cool enough to suppress forbidden CELs but produce strong ORL emission. Most of the PNe in Table 1 have CEL C/O ratios. When these are unavailable, we have used the ORL line ratio (e.g., for Vy 2-2). We have never mixed CEL and ORL abundance determinations to create a C/O value.
In the first studies of the multi-band PAH spectra of PNe from the KAO it was recognised that the ratio of I(7.7)/I(IR) ranged over two orders of magnitude. To avoid confining the distribution of the bulk of the PNe detected to the lower left corner of any figure against C/O by use of a linear plot, the logarithmic ordinate was selected. We have followed this precedent. CPD-56∘8032 and He 2-113 are well-measured objects with extreme values of C/O, yet they both emit comparable fractions of the IR flux in the PAH bands to those emitted by other PNe with much more modest C/O ratios. Consequently, we exclude them from our sample in terms of any regression analysis.
Fig. 3 illustrates the 7.7-m results, distinguishing between PNe detected in the 7.7-m band, the subset of nebulae with [WCL] central stars, and the 26 objects with only upper limits. The solid line plotted in this figure indicates the formal regression line for all detected PNe with the exceptions of CPD-56∘8032 and He 2-113. The intercept is , the slope is 1.470.33, and the Pearson correlation coefficient for these 15 PNe is r=0.76. We identify this dashed regression line as the ISO version of the relationship reported by Cohen et al. (1989: their Figure 20) based on airborne spectroscopy. (Note that, in their figure, the point for CPD-56∘8032 was misplotted too high by a factor of 10 in ordinate. It should have appeared at -1.1.)
The regression line for the six [WCL] objects (after excluding CPD-56∘8032 and He 2-113) with the 7.7-m band is insignificantly different (at the 1 level) from the line for the 15 PNe. M 4-18 has the largest value of I(7.7)/I(IR). Ground-based spectra (Aitken & Roche 1982; Rinehart et al. 2002) clearly show its 11.3-m band although its 8.7-m feature is convincingly shown only by the Aitken & Roche (1982) spectrum from Mauna Kea. M 4-18’s SWS spectrum is very noisy, although the PAH features are unquestionably detected. However, the spectral levels of the PAH bands in this SWS spectrum match those in the spectrum by Rinehart et al. (2002) to within 10 percent, confirming our estimate of I(7.7)/I(IR) for this object. In the small sample of PNe studied by Cohen et al. (1989) NGC 6302 substantively helped to define the trend at 7.7 m because of its low C/O ratio. With our enlarged set of PNe NGC 6302 no longer controls the existence of a trend in this diagram. The correlation coefficient remains r=0.76 even if one were to exclude NGC 6302 along with CPD-56∘8032 and He 2-113. There is no cause to reject this PN; we simply make the point that a single PN does not strongly influence the regression line in this sample at 7.7 m.
One immediately sees that the [WCL] PNe dominate the plot by contributing almost all the large ratios of I(7.7)/I(IR). Only NGC 6369, among the [WCL] PNe, was not detected in PAH emission. Roche, Aitken & Whitmore (1983) observed this PN from the ground at very low resolving power (40), in a 20′′ beam which accommodated about half the ionized gas distribution. At best there are possible suggestions of emission humps near 8.7 and 11.3-m emission in their spectrum. The object has only a single SWS01 spectrum, as opposed to several of the [WCL] nebulae which have higher IR surface brightness.
All the 7.7-m non-detections have relatively short exposure (fast speed) SWS01 observations (1062-1912 s), suggesting that they were spectra with poor signal-to-noise. Almost all PNe with C/O ratios 0.85 (logC/O -0.07) and I(7.7)/I(IR) 0.4 percent (log10 C/O -2.45) were detected in this PAH feature. Seven PNe, lying in the lower-left quadrant of Fig. 3 below these limiting values, were not detected in the 7.7-m band. Only NGC 6302 is detected outside the above limits of C/O and I(7.7)/I(IR). This detection was certainly aided by the use of the slowest speed SWS01 AOT (6528 s) because the PAHs are weak in this PN and I(IR) is large.
Fig. 4 similarly presents the 11.3-m results. A single regression line is again plotted for the 12 detected PNe, excluding CPD-56∘8032 and He 2-113. The intercept is -2.590.08 and slope 2.120.49. The influence of NGC 6302 on this regression line is again minimal: r drops from 0.71 to 0.67 if one were to exclude this object from the regression analysis. Clearly there is no justification for doing this. The PN furthest from the line, with the lowest I(11.3)/I)IR) of the sample, is IC 418 although there is likewise no reason to exclude it. Several nebulae show a broad hump between 10.6 and 12.4 m attributed to emission by SiC grains. In these objects the 11.3-m PAH band is a very small emission feature near the peak of the SiC structure, requiring careful definition of a local continuum to extract the PAH feature. Perhaps this accounts for its unusual weakness in IC 418, whose SiC emission is very bright. Overall, I(11.3)/I(IR) rises abruptly at low C/O and maintains this rise at least as far as C/O , exactly as found by Volk & Cohen (1990: their Figure 3). Only the two extreme PNe are observed beyond this value of C/O.
From their analysis of the 3.3-m band, Roche et al. (1996) suggested that the equivalent width (EW) of this band argued for a cut-off below C/O = 0.6. For high quality near-infrared ground-based spectra, EWs are appropriate. For space-based spectra the sample is still limited by signal-to-noise. This can lead to poor estimates of the local continuum required to define an EW. Therefore, I(7.7)/I(IR) is a far more robust measure of PAH strength than EW for our sample of PN spectra. However, in the interest of trying to determine whether our sample supports a similar conclusion, we have reformulated the 7.7-m data as EWs. But this lack of robustness means that we must exclude several PNe from the sample. These are precisely those objects in which portions of the overall splined continua are so noisy that negative continua result at some wavelengths within the broad 7.7-m feature, or else very large EWs (2 m) are formally derived. We again exclude CPD-56∘8032 and He 2-113 but must also reject Sw St 1, NGC 40, NGC 6302, Cn 1-5, and M 4-18. The final sample includes 10 PNe. We have carried out a careful estimation of the errors in the derived EWs by adding in quadrature the uncertainties in each integrated 7.7-m intensity with those associated with the definition of the underlying continuum. Fractional uncertainties of 30% have been assigned to the observed C/O values. Fig. 5 presents the EWs for these PNe linearly against C/O. The solid line is the best fitting relationship. The formal detectable onset of 7.7-m emission is for C/O = 0.56, which includes the value of 0.6 found by Roche et al. (1996), at which C/O value they estimate that 3.3-m PAH emission first appears.

Comparing the behaviour of CPD-56∘8032 and He 2-113 with the regressions in Figures 3 and 4 suggests that perhaps these two objects are so extreme because some process “saturates” so that further increase of C/O no longer yields more intense PAH emission relative to the overall dust continuum emission. For both these PNe, essentially all of the stellar ultraviolet (UV) photons are being absorbed and reradiated in the IR by the PAHs and dust particles (Aitken et al. 1980), which is not the case for most of the other objects in our sample. Around these two objects, there could therefore be a significant stratification with radius of both the spectral quality of the ambient UV radiation field, with harder photons being absorbed closer in, and of the characteristic grain temperature, so that strong PAH emission closer in may be offset by weak PAH and strong far-IR grain emission further out. Therefore, the best guides to any underlying correlations between band strengths and C/O ratios are those provided by our PN samples that omit CPD-56∘8032 and He 2-113.
The 6.2-m PAH band is seen in 14 PNe and their relative strengths, I(6.2)/I(IR), are given in Table 3. In most of these nebulae this band is measured rather poorly because high noise in the SWS spectra below 5-6 m adversely affects the definition of the underlying continua that we subtract. There is no meaningful correlation between I(6.2)/I(IR) and C/O.
| PN | C/O | I(IR) | I(7.7)/I(IR) | I(11.3)/I(IR) | C/O Reference |
|---|---|---|---|---|---|
| BD+30∘3639 | 1.60 | 4.90E-15 | 0.0275 | 0.0096 | Pwa, Pottasch & Mo (1986) |
| CPD-56∘8032 | 13.1 | 7.77E-15 | 0.0266 | 0.0056 | De Marco, Barlow & Storey (1997) |
| Cn 1-5 | 1.7 | 4.77E-15 | 0.0028 | 0.0030 | Walton, Barlow & Clegg (1993) |
| Hb 12∗ | 0.52 | 1.05E-15 | 0.0027 | 0.0099 | Hyung & Aller (1990) |
| He 2-113 | 10.4 | 6.00E-15 | 0.0253 | 0.0056 | De Marco, Barlow & Storey (1997) |
| He 2-131 | 0.30 | 1.60E-15 | 0.0035 | 0.0015 | Liu et al. (2001a) |
| Hu 1-2∗ | 1.23 | 8.60E-17 | 0.0094 | 0.0089 | Liu et al. (2004) |
| Hu 2-1∗ | 0.48 | 1.80E-16 | 0.0037 | 0.0076 | Wesson et al. (2005) |
| IC 3568 | 0.54 | 1.49E-16 | 0.0050 | 0.0039 | Liu et al. (2004) |
| IC 418 | 1.43 | 2.38E-15 | 0.0046 | 0.0005 | Henry, Kwitter & Bates (2000) |
| IC 4406 | 0.62 | 2.37E-16 | 0.0022 | 0.0042 | Tsamis et al. (2003) |
| IC 4997 | 0.34 | 2.31E-16 | 0.0021 | 0.0046 | Hyung et al. (1994) |
| IC 5117 | 1.32 | 8.29E-16 | 0.0174 | 0.0136 | Hyung et al. (2001) |
| M 1-42 | 0.15 | 1.29E-16 | 0.0047 | 0.0018 | Liu et al .(2001b) |
| M 2-36 | 0.76 | 9.15E-17 | 0.0012 | 0.0084 | Tsamis et al. (2003) |
| M 4-18∗ | 2.9 | 1.80E-16 | 0.0491 | 0.0111 | De Marco & Barlow (2001) |
| Mz 3 | 0.83 | 7.42E-15 | 0.0017 | 0.0003 | Zhang & Liu (2002) |
| NGC 2346 | 0.35 | 1.15E-16 | 0.0087 | 0.0015 | Rola & Stasinska (1994); Peimbert & Torres-Peimbert (1987) |
| NGC 2440∗ | 0.91 | 4.49E-16 | 0.0043 | 0.0044 | Hyung & Aller (1998) |
| NGC 3918 | 1.60 | 9.59E-16 | 0.0033 | 0.0019 | Ercolano et al. (2003) |
| NGC 40 | 1.41 | 1.38E-15 | 0.0095 | 0.0057 | Liu et al. (2004) |
| NGC 5189 | 0.34 | 1.71E-16 | 0.0018 | 0.0024 | Liu et al. (2001a) |
| NGC 5315 | 0.85 | 1.12E-15 | 0.0067 | 0.0039 | Pottasch et al. (2002a) |
| NGC 6153 | 0.55 | 1.20E-15 | 0.0022 | 0.0025 | Liu et al. (2000) |
| NGC 6210 | 0.26 | 4.21E-16 | 0.0035 | 0.0059 | Liu et al. (2004) |
| NGC 6302 | 0.31 | 8.08E-15 | 0.0029 | 0.0011 | Tsamis et al. (2003) |
| NGC 6369 | 2.00 | 1.54E-15 | 0.0104 | 0.0055 | Zuckerman & Aller (1986);Aller & Keyes (1987) |
| NGC 6445 | 0.81 | 3.38E-16 | 0.0026 | 0.0034 | Pottasch et al. (2002b) |
| NGC 6537 | 0.95 | 1.50E-15 | 0.0038 | 0.0034 | Liu et al. (2001) |
| NGC 6543 | 0.44 | 2.19E-15 | 0.0023 | 0.0003 | Wesson & Liu (2004) |
| NGC 6572 | 1.55 | 1.55E-15 | 0.0076 | 0.0033 | Liu et al. (2004) |
| NGC 6720 | 0.62 | 2.64E-16 | 0.0056 | 0.0008 | Liu et al. (2004) |
| NGC 6741∗ | 1.35 | 2.78E-16 | 0.0070 | 0.0041 | Liu et al. (2004) |
| NGC 6790 | 0.81 | 6.66E-16 | 0.0129 | 0.0015 | Liu et al. (2004) |
| NGC 6826 | 0.87 | 1.05E-15 | 0.0077 | 0.0057 | Liu et al. (2004) |
| NGC 6884∗ | 0.93 | 3.03E-16 | 0.0046 | 0.0017 | Liu et al. (2004) |
| NGC 6886∗ | 1.3 | 2.50E-16 | 0.0048 | 0.0109 | Hyung et al. (1995) |
| NGC 6891 | 0.51 | 1.62E-16 | 0.0158 | 0.0044 | Wesson et al. (2005) |
| NGC 7009 | 0.32 | 1.13E-15 | 0.0011 | 0.0005 | Liu et al. (2004); Liu et al. (1995) |
| NGC 7027 | 2.29 | 2.05E-15 | 0.0171 | 0.0106 | Middlemass (1990) |
| NGC 7662 | 1.23 | 5.60E-16 | 0.0025 | 0.0016 | Liu et al. (2004) |
| Sw St 1∗ | 0.93 | 1.47E-15 | 0.0083 | 0.0018 | De Marco et al. (2001) |
| Vy 2-2∗ | 0.26 | 8.46E-16 | 0.0076 | 0.0062 | Wesson et al. (2004) |
| PN | I(6.2)/I(IR) |
|---|---|
| BD+30∘3639 | 0.0073 |
| Cn 1-5 | 0.0041 |
| CPD-56∘8032 | 0.0105 |
| He 2-113 | 0.0116 |
| IC 418 | 0.0021 |
| IC 5117 | 0.0140 |
| M 4-18 | 0.0051 |
| NGC 5315 | 0.0037 |
| NGC 6302 | 0.0008 |
| NGC 6790 | 0.0089 |
| NGC 6826 | 0.0024 |
| NGC 6886 | 0.0079 |
| NGC 7027 | 0.0039 |
| Sw St 1 | 0.0050 |
6 Conclusions
PAHs were not detected in two of the three largest nebulae in our sample, either because the circumnebular PDRs that ought to contain PAHs are not sampled by the modest sizes of the SWS apertures, or else because these lower density nebulae are optically thin to ionizing radiation and have no PDRs. This could explain the absence of detectable 7.7-m emission bands in NGC 5189 and NGC 6720. PAHs were detected by the SWS in NGC 6537, despite its diameter of 70′′. However, this object is bipolar and has a similarly high excitation class and morphology to NGC 6302, in which PAHs are also detected. This morphology implies a central concentration of material that is lacking in large classical PNe like NGC 6720. Indeed, the strong 3.3 and 3.4-m bands seen in a 3′′ slit spectrum of NGC 6537 by Roche et al. (1996) offer confirmation that the PAH emission in at least this nebula arises in the compact core.
Using a sample of PNe more than twice as large as that previously available from airborne spectroscopy, we have vindicated the existence of a relationship between I(7.7)/I(IR) and gas phase C/O. The fraction of total IR luminosity emitted by the 7.7-m band is observed to be roughly linearly proportional to C/O for abundance ratios up to 3. From a sample of PNe about the same size as that used in the LRS study by Volk & Cohen (1990) but based on higher signal-to-noise SWS spectra, we have confirmed that I(11.3)/I(IR) rises rapidly with C/O to at least C/O 2, growing roughly as the square of the gas-phase abundance ratio. For nebulae with C/O beyond a value of 2-3 this fractional growth of the PAH emission bands apparently ceases. The difference between the logarithmic intercepts of these two relationships (-2.59 and -2.16) indicates that, for PNe with C/O1, the intensity of the 11.3-m band is 37 percent of the 7.7-m band’s intensity. Note that the use of logarithmic plots greatly reduces the dependence of this ratio of band strengths on abundance ratio because the centroid of our sample is C/O1. This is in excellent agreement with the average of 36 percent measured by Cohen et al. (1986, their Table 5) for the generic spectrum of astrophysical PAHs. The 1986 sample included only 7 PNe for which band ratios relative to I(7.7) were definable and included Hii regions and reflection nebulae too. We have, therefore, redetermined I(6.2)/I(7.7) and I(11.3)/I(7.7) purely from our new sample of PNe, and find a mean ratio and standard error of the mean of 0.620.13 (13 PNe) and 0.400.06 (14 PNe), respectively.
These empirical correlations between PAH band strength and nebular C/O abundance ratio could yield insights into the carbon dust condensation process because PAHs have been suggested to be the likely molecular precursors of C grains (Crawford, Tielens & Allamandola 1985; Allamandola, Tielens & Barker 1989). I(7.7)/I(IR) essentially measures the far-ultraviolet absorption cross sections of PAHs with respect to that of the larger C-grains, believed to dominate the continuum emission in planetaries. One obvious interpretation of the observed correlations in Figs. 3 and 4 is that n(PAH)/n(carbon grains) increases with increasing C/O ratio. If, on the other hand, n(PAH)/n(carbon grains) is largely invariant, one could interpret the correlations of PAH band strengths with C/O as due to growth of the grain component (higher C/O leading to bigger particles with smaller UV cross sections per unit volume, so that PAHs absorb more UV energy relative to the grains).
7 Acknowledgements
We thank the anonymous referee for comments that have helped improve the paper. MC thanks NASA for supporting the early portion of this work through grant NAG5-4884, and later through contract JPL961501, with Berkeley. It is a pleasure to thank the Physics & Astronomy Dept. at UCL for hosting a number of short-term visits that have enabled the completion of this effort.
References
- [] Acker A., Ochsenbein F., Stenholm B., Tylenda R., Marcout J., Schohn, C., 1992, Strasbourg-ESO Catalogue of Galactic Planetary Nebulae, ESO
- [] Aitken, D. K., Barlow, M. J., Roche, P. F., Spenser, P. M. 1980, MNRAS, 192, 679
- [] Aitken, D. K. & Roche, P. F. 1982, MNRAS, 200, 217
- [] Aitken, D. K. & Roche, P. F. 1983, MNRAS, 202,1233
- [] Allamandola, L. J., Hudgins, D. M., Sandford, S. A. 1999, ApJ, 511, L115
- [] Allamandola, L. J., Tielens, A.G.G.M., Barker, J. R. 1985, ApJ, 290, L25
- [] Allamandola, L. J., Tielens, A.G.G.M., Barker, J. R. 1989, ApJS., 71, 733
- [] Aller, L.H. & Keyes, C.D. 1987, ApJS, 65, 405
- [] Barlow, M. J. 1983, in Proc. IAU Symp. 103, ”Planetary Nebulae”, ed. D. R Flower (Dordrecht: Reidel), p.105
- [] Barnard, J. A. & Bradley, J. N. 1985, ”Flame & Combustion” (Chapman & Hall: New York)
- [] Bellamy, L. J. 1958, ”The Infrared Spectra of Complex Organic Molecules” (2nd ed., Wiley: New York)
- [] Casassus, S., Roche, P. F., Aitken, D. K., Smith, C. H. 2001, MNRAS, 327, 424
- [] Clegg, P. E. et al. 1996, A&A, 315, 38
- [] Cohen, M., Allamandola, L. J., Tielens, A.G.G.M., Bregman, J., Simpson, J. P., Witteborn, F. C., Wooden, D., Rank, D. 1986, ApJ, 302, 737
- [] Cohen, M., Barlow, M.J., Liu, X.-W., Sylvester, R.J., Jones, A.F. 2002, MNRAS, 332, 879
- [] Cohen, M., Tielens, A.G.G.M., Allamandola, L. J. 1985, ApJ, 299, L93
- [] Cohen, M., Tielens, A.G.G.M., Bregman, J. D., Witteborn, F. C., Rank, D. M., Allamandola, L. J., Wooden, D. H., de Muizon, M. 1989, ApJ, 341, 246
- [] Crawford, M. K., Tielens, A.G., Allamandola, L.J. 1985, ApJ, 293, L45
- [] Curl, R. F., Smalley, R. E. 1988, Science, 242, 1017
- [] de Graauw, T. et al., 1996, A&A, 315, 49
- [] De Marco, O. & Barlow , M.J. 2001 Ap&SS, 275, 53
- [] De Marco O, Barlow M. J., Storey P. J. 1997, MNRAS, 292, 86
- [] De Marco O., Crowther P. A. 1999, MNRAS, 306, 931
- [] De Marco, O., Crowther, P.A., Barlow, M.J., Clayton, G.C., de Koter, A. 2001, MNRAS, 328, 527
- [] van Diedenhoven, B., Peeters, E., Van Kerckhoven, C., Hony, S., Hudgins, D.M., Allamandola, L.J., Tielens, A.G.G.M. 2004, ApJ, 611, 928
- [] Duley, W. W., Williams, D. A. 1981, MNRAS, 196, 269
- [] Emerson, J. P. 1988, in NATO Advanced Science Institutes (ASI) Series C, Volume 241, p.193 (Dordrecht: Kluwer)
- [] Ercolano, B., Morisset, C., Barlow, M. J., Storey, P. J., Liu, X.-W. 2003, MNRAS, 340, 1153
- [] Hecht, J. H. 1986, ApJ, 305, 817
- [] Henry, R.B.C., Kwitter, K.B., & Bates, J.A. 2000, ApJ, 531, 928
- [] Hucknall, D. J. 1985, ”Chemistry of Hydrocarbon Combustion” (Chapman & Hall: New York)
- [] Hyung, S., Aller, L.H. 1990, MNRAS, 278, 551
- [] Hyung, S., Aller, L.H. 1996, MNRAS, 278, 551
- [] Hyung, S., Aller, L.H. 1998, PASP, 110, 466
- [] Hyung, S., Aller, L.H., Feibelman, W.A. 1994, ApJS, 94, 465
- [] Hyung, S., Aller, L.H., Feibelman, W.A., Lee, S.-J. 2001, ApJ, 563, 889
- [] Hyung, S., Keyes, C.D., Aller, L.H. 1995, MNRAS, 272, 49
- [] Iglesias-Groth, S. 2004, ApJ, 608, L37
- [] Kessler, M. F. et al. 1996, A&A, 315, 27
- [] Kingsburgh, R. L., Barlow, M. J. 1994, MNRAS, 271, 257
- [] Leger, A., Puget, J. L. 1984, A.A., 137, L5
- [] Liu, Y., Liu, X.-W., Barlow, M.J., Luo, S.-G. 2004, MNRAS, 353, 1251
- [] Liu, X.-W., Storey, P.J., Barlow, M.J., Clegg, R.E.S. 1995, MNRAS, 272, 369
- [] Liu, X.-W., Storey, P.J., Barlow, M.J., Danziger, I.J., Cohen, M., Bryce, M. 2000, MNRAS, 312, 585
- [] Liu, X.-W., Barlow, M.J., Cohen, M., Danzier, I.J., Luo, S.-G., Baluteau, J.P, Cox, P., Emery, R.J., Lim, T., Pequignot, D., Sun, Y.-R. 2001a, MNRAS, 323, 343
- [] Liu, X.-W., Luo, S.-G., Barlow, M.J., Danziger, I.J., Storey, P.J. 2001b, MNRAS, 327, 141
- [] Middlemass, D. 1990, MNRAS, 244, 294
- [] Moutou, C., Verstraete, L., Liger, A., Sellgren, K., Schmidt, W. 2000, A&A, 354, L17
- [] Peeters, E., Hony, S., van Kerckhoven, C., Tielens, A. G. G. M., Allamandola, L. J., Hudgins, D. M., & Bauschlicher, C. W. 2002, A&A, 390, 1089
- [] Peimbert, M. & Torres-Peimbert, S. 1987, 1987RMxAA, 14, 540
- [] Pottasch, S.R., Beintema, D.A., Bernard S.J., Koornneef, J., Feibelman, W.A 2002a, A&A, 393, 285
- [] Pottasch, S.R., Beintema, D.A., Bernard S.J., & Feibelman, W.A. 2002b, RevMexA&A, 12, 100
- [] Pwa, T.H., Pottasch, S.R., Mo, J.E. 1986, A&A, 164, 184
- [] Rinehart, S. A., Houck, J. R., Smith, J. D., Wilson, J. C. 2002, MNRAS, 336, 66
- [] Roche, P. F., Aitken, D. K. 1986, MNRAS, 221, 63
- [] Roche, P. F., Aitken, D. K., Whitmore, B. 1983, MNRAS, 204, 1017
- [] Roche, P. F., Lucas, P. W., Hoare, M. G., Aitken, D. K., Smith, C. H. 1996, MNRAS, 280, 924
- [] Rola, C., Stasinska, G. 1994, ApJ, 282, 199
- [] Russell, R. W., Soifer, B. T., Merrill, K. M. 1977, ApJ, 213, 66
- [] Russell, R. W., Soifer, B. T., Willner, S. P. 1977, ApJ, 217, L149
- [] Schwarz H., Corradi R. L. M., Melnick J., 1992, A&AS, 96, 23
- [] Sellgren, K., Werner, M. W., Dinerstein, H. L. 1983, ApJ, 271, L13
- [] Smith, C. H., Aitken, D. K., Roche, P. F. 1989, Proc. IAU Symp. 131, ed. S. Torres-Peimbert, p.203
- [] Tielens, A.G.G.M. 1993, in ”Dust & chemistry in astronomy”, eds T.J. Millar & D. Williams (IOP Publishing Ltd.: UK)
- [] Tsamis, Y. G., Barlow, M. J., Liu, X.-W., Storey, P. J., Danziger, I. J. 2004, MNRAS, 353, 953
- [] Tsamis, Y. G., Barlow, M. J., Liu, X.-W., Danziger, I. J., Storey, P. J. 2003, MNRAS, 345, 186
- [] Ugarte, D. 1992, Nature, 359, 707
- [] Ugarte, D. 1995, ApJ, 443, L85
- [] Volk, K. V., Cohen, M. 1990, AJ, 100, 485
- [] Walton, N.A., Barlow, M.J., Clegg, R.E.S. 1993, IAU Symp. 155, eds. R. Weinberger & A. Acker (Kluwer Academic Publishers; Dordrecht), p.581
- [] Wesson, R., Liu, X.-W. 2004, MNRAS, 351, 1026
- [] Wesson, R., Liu, X.-W., Barlow, M.J. 2005, MNRAS, in press
- [] Zhang C. Y., Kwok S., 1993, AJ, 88, 137
- [] Zhang, Y., Liu, X.-W. 2002, MNRAS, 337, 499
- [] Zuckerman, B., Aller, L. H. 1986, ApJ, 301, 772