Chandra Deep X-ray Observation of a Typical Galactic Plane Region and Near-Infrared Identification
Abstract
Using the Chandra Advanced CCD Imaging Spectrometer Imaging array (ACIS-I), we have carried out a deep hard X-ray observation of the Galactic plane region at , where no discrete X-ray source had been reported previously. We have detected 274 new point X-ray sources (4 confidence) as well as strong Galactic diffuse emission within two partially overlapping ACIS-I fields ( 250 arcmin2 in total). The point source sensitivity was erg s-1 cm-2 in the hard X-ray band (2 – 10 keV) and erg s-1 cm-2 in the soft band (0.5 – 2 keV). Sum of all the detected point source fluxes accounts for only 10 % of the total X-ray flux in the field of view. Even hypothesizing a new population of much dimmer and numerous Galactic point sources, the total observed X-ray flux cannot be explained. Therefore, we conclude that X-ray emission from the Galactic plane has truly diffuse origin. Removing point sources brighter than erg s-1 cm-2 (2– 10 keV), we have determined the Galactic diffuse X-ray flux as erg s-1 cm-2 deg-2 (2–10 keV). Only 26 point sources were detected both in the soft and hard bands, indicating that there are two distinct classes of the X-ray sources distinguished by the spectral hardness ratio. Surface number density of the hard sources is only slightly higher than that measured at the high Galactic latitude regions, indicating that majority of the hard sources are background AGNs. Following up the Chandra observation, we have performed a near-infrared (NIR) survey with SOFI at ESO/NTT. Almost all the soft X-ray sources have been identified in NIR and their spectral types are consistent with main-sequence stars, suggesting most of them are nearby X-ray active stars. On the other hand, only 22 % of the hard sources had NIR counterparts, which are presumably Galactic. From X-ray and NIR spectral study, they are most likely to be quiescent cataclysmic variables. Our observation suggests a population of cataclysmic variables in the entire Galactic plane fainter than erg s-1. We have carried out a precise spectral study of the Galactic diffuse X-ray emission excluding the point sources. Confirming previous results, we have detected prominent emission lines from highly ionized heavy elements in the diffuse emission. In particular, central energy of the iron emission line was determined as keV (90 % confidence), which is significantly lower than what is expected from a plasma in thermal equilibrium. The downward shift of the iron line center energy suggests non-equilibrium ionization states of the plasma, or presence of the non-thermal process to produce 6.4 keV fluorescent lines.
1 INTRODUCTION
The Galactic X-ray source population has been studied from the very beginning of X-ray astronomy. The Uhuru satellite detected 339 X-ray sources all over the sky brighter than erg s-1 cm-2 in 2 – 10 keV (Forman et al. 1978). Most bright X-ray sources are concentrated near the Galactic bulge and/or distributed along the Galactic plane, indicating their Galactic origin. A high sensitive X-ray observation with direct imaging was made for the first time with the Einstein satellite (Hertz and Grindlay 1984) in the soft X-rays below 4 keV. The ROSAT Galactic Plane Survey (Motch et al. 1991) was made as a part of the ROSAT all sky survey, but the energy range was again limited to below 2 keV. These soft X-ray surveys were not able to penetrate the Galactic heavy absorption ( cm-2), hence did not allow us to observe those X-ray sources located deepest in the Galactic plane or behind.
In order to observe completely through the Galactic plane and to determine the Galactic source population, hard X-ray ( 2 keV) observation is indispensable. This was made possible with ASCA, the first imaging satellite in the hard X-ray energy band (Tanaka, Inoue, & Holt 1994). ASCA carried out systematic surveys on the Galactic plane (Sugizaki et al. 2001) and the center region (Sakano et al. 2002) down to the sensitivity limit 3 erg s-1 cm-2 in 2 – 10 keV. ASCA’s point source sensitivity was limited by source confusion due to its moderate X-ray mirror point spread function (). ASCA discovered more than two hundreds new X-ray sources on the Galactic plane region within the longitudes of (Yamauchi et al. 2002; Ebisawa et al. 2003). Many of them are heavily absorbed and not detected in soft X-ray bands. ASCA suggested an intriguing possibility that there may be still more dimmer, undetected hard X-ray sources in the Galactic plane. How many Galactic hard X-ray sources are there in the Galactic plane? What is the origin of dimmest Galactic hard X-ray sources? Using Chandra, the most sensitive X-ray telescope in the history, we want to answer to these fundamental questions in X-ray astronomy.
Besides the discrete Galactic X-ray sources, the Galactic plane itself has been known to emit hard X-rays (e.g., Worrall et al. 1982; Warwick et al. 1985; Koyama et al. 1986). The emission forms a narrow continuous Galactic ridge, thus it is called the Galactic Ridge X-ray Emission (GRXE). GRXE exhibits emission lines from highly ionized heavy elements such as Si, S and Fe, which suggests that GRXE originates in thin hot plasmas with a temperature of several keV (Koyama et al. 1986; Yamauchi and Koyama 1993; Kaneda et al. 1997). Whether GRXE is composed of numerous point sources or truly diffuse emission has been a big problem for a long time. ASCA was expected to answer this crucial question, but not powerful enough to clearly separate numerous dim point sources and diffuse emission (Yamauchi et al. 1996; Kaneda et al. 1997; Sugizaki et al. 2001). The origin of GRXE remained unresolved with ASCA.
Chandra is an ideal satellite that is able to resolve GRXE into point sources with a superb spatial resolution of (Weisskopf et al. 2002). For this purpose, using the Chandra Advanced CCD Imaging Spectrometer Imaging array (ACIS-I; Garmire et al. 2003), we have carried out deep hard X-ray observations of the Galactic plane region at , where extensive observation had been already made but no discrete X-ray source detected with ASCA. Our first result was presented in Ebisawa et al. (2001); we have found that only 10 % of the hard X-ray flux (2 – 10 keV) in the Chandra field is explained by the point sources brighter than erg s-1 cm-2. Also, by comparing the observed source number density with those measured at high Galactic regions, we suggested that most of these hard X-ray point sources on the Galactic plane are background AGNs.
We have made two slightly overlapping Chandra deep observations for our project, only the first one was analyzed in Ebisawa et al. (2001). In the present paper, we will give full analysis of our two Chandra observations, as well as the result of near-infrared (NIR) follow-up observation using the New Technology Telescope (NTT) at the European Southern Observatory (ESO). Main purposes of this paper are the following; (1) to study nature of the dimmest X-ray point sources on the Galactic plane in details using X-ray and NIR data, (2) to constrain the population of faint Galactic hard X-ray sources, and (3) to investigate for origin of the Galactic diffuse emission through precise spectral analysis. Clean separation of the diffuse emission and the point sources has been made possible for the first time by superb Chandra spatial resolution.
2 OBSERVATION AND DATA REDUCTION
2.1 X-ray Observation and Data Reduction
We observed the “empty” Galactic plane region at around in order to study the Galactic diffuse X-ray emission and dim point X-ray sources. This direction is toward the Scutum arm and is known to have strong diffuse emission, thus already extensively observed with ASCA (Yamauchi et al. 1996; Kaneda et al. 1997). ASCA did not detect any point sources brighter than erg s-1 cm-2 (2 – 10 keV), while found an intriguing hard X-ray diffuse feature (AX J1843.8–0352; Bamba et al. 2001), which was another motivation for our Chandra observation in this region. Using ACIS-I, we carried out each 100 ksec pointing on February 25, 2000 (AO1; sequence number 900021) and May 20, 2001 (AO2; sequence number 900125), respectively, with slightly overlapping fields. The total area of the observed field is arcmin2. Detailed spatial and spectral study of AX J1843.8-0352 using both AO1 and AO2 observations was already published in Ueno et al. (2003).
In this paper, we use the event data processed by the Chandra X-ray Center with the latest processing system in early 2003. Furthermore, we have applied position and energy calibration (CTI correction) using the CIAO package (version 3.0.1). The Two Micron All Sky Survey (2MASS)111http://www.ipac.caltech.edu/2mass was adopted for the astrometric reference for the Chandra data as well as the NTT/SOFI data (see Section 2.3). Using the positions of those Chandra sources that have obvious NIR counterparts, we estimate our Chandra position accuracy as (see also Section 3.4), which is limited by statistical error and distortion of the point spread function for off-axis sources.
2.2 X-ray Point Source Extraction
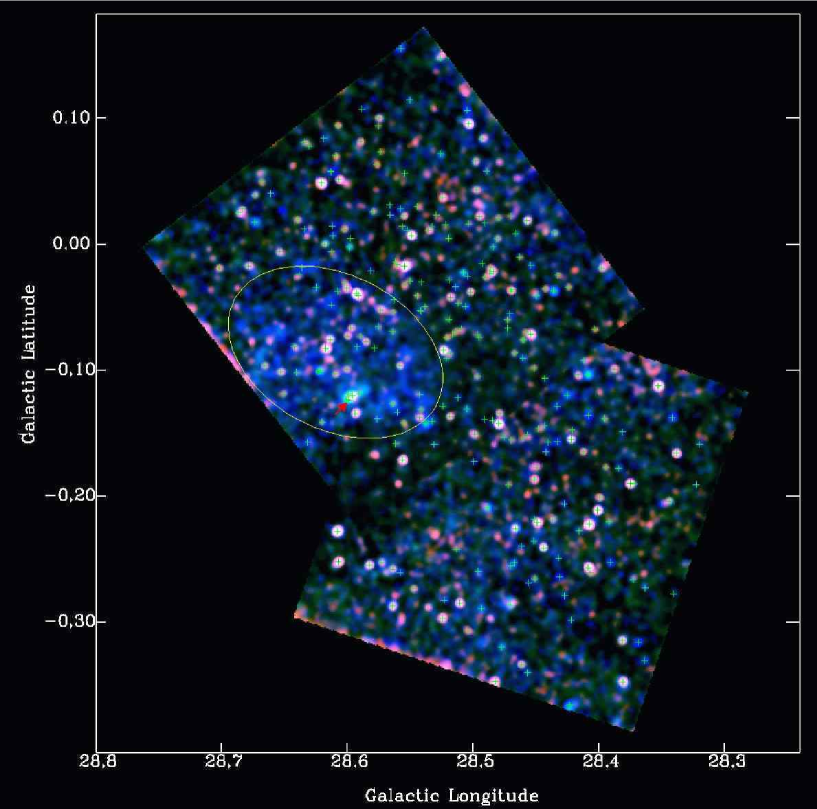
First, we made exposure and vignetting corrected images in 0.5 – 2 keV, 2 – 4 keV and 4 – 8 keV, and superposed them by assigning red, green and blue color respectively, followed by adaptive smoothing to enhance visibility (Fig. 1). We can clearly see many point sources as well as strong diffuse emission. We carried out point source search using the “wavdetect” program in the CIAO data analysis package. We searched for sources in the 0.5 – 3 keV (soft band), 3 – 8 keV (hard band) and 0.5 – 8 keV (total band) independently. We did not use data below 0.5 keV and above 8 keV for the source detection in order to avoid high backgrounds in both energy ends. Sources that exceed 4 significance (given by “wavdetect”) in any of the three energy bands were considered to be true detections. On the AO1 and AO2 overlapping field, we searched for the sources in the AO1 and AO2 data separately, and combined the two significances quadratically. We have detected 274 point sources within the total field of view. Source position and significance in each energy band are given in Table 1. Position errors are the statistical ones calculated by wavdetect, not including any systematic errors.
None of these point sources have been reported in X-rays before. In the soft band, 182 sources have been detected, while in the hard band 79 sources. Only 26 sources were detected both in the soft and hard bands, suggesting an intriguing dichotomy in the source population (see Sections 3.3 and 3.4 for more details). Those 4 sources near the on-axis roughly corresponds to erg s-1 cm-2 (2 – 10 keV) or erg s-1 cm-2 (0.5 – 2 keV), depending on the spectral hardness ratio and assumed spectral shapes (Section 3.2).
A new acronym “CXOGPE” (Galactic Plane sources reported by Ebisawa et al. 2005) is registered at CDS222http://vizier.u-strasbg.fr/viz-bin/DicForm for the sources in Table 1. Hence, the first source in Table 1 at (18:42:51.77, ) may be formally designated as “CXOGPE J184251.7035111”, and so on. In this paper, however, the sources in Table 1 are referred as Source 1, 2, etc. for simplicity.
Sources 208, 210, 213, and 216, detected at around (R.A., Decl.) seem to be parts of a single extended feature, which is designated as CXOU J184357-035441 by Ueno et al. (2003). This extended feature has a characteristic thermal spectrum (Ueno et al. 2003), and is probably a blob associated with the supernova remnant AX J 1843.8–0352/G28.6–0.1 (Bamba et al. 2001). All the other sources are consistent with the Chandra point spread function, thus they are considered as point sources.
2.3 NIR Observation and NTT/SOFI Data Reduction
Because of the heavy Galactic absorption, the NIR band has a great advantage over the optical waveband to identify dim X-ray sources on the Galactic plane. In fact, radio observation toward our field has been made (Dickey and Lockman 1990; Dame, Hartman and Thaddeus 2001; Minter et al. 2001), and the total hydrogen column density was estimated not less than cm-2 (Ebisawa et al. 2001). This corresponds to mag using the standard extinction formula ( cm-2 mag-1; Predehl and Schmitt 1995), so that there is hardly a hope to identify extragalactic sources or the most distant Galactic sources in the optical band. On the other hand, NIR extinction formulas cm-2 mag-1 (Vuong et al. 2003) and cm-2 mag-1 (Harjunpaeae and Mattila 1996) lead to mag and mag, hence NIR extinction is much smaller, and NIR observation will allow us to probe deeper into the Galactic plane.
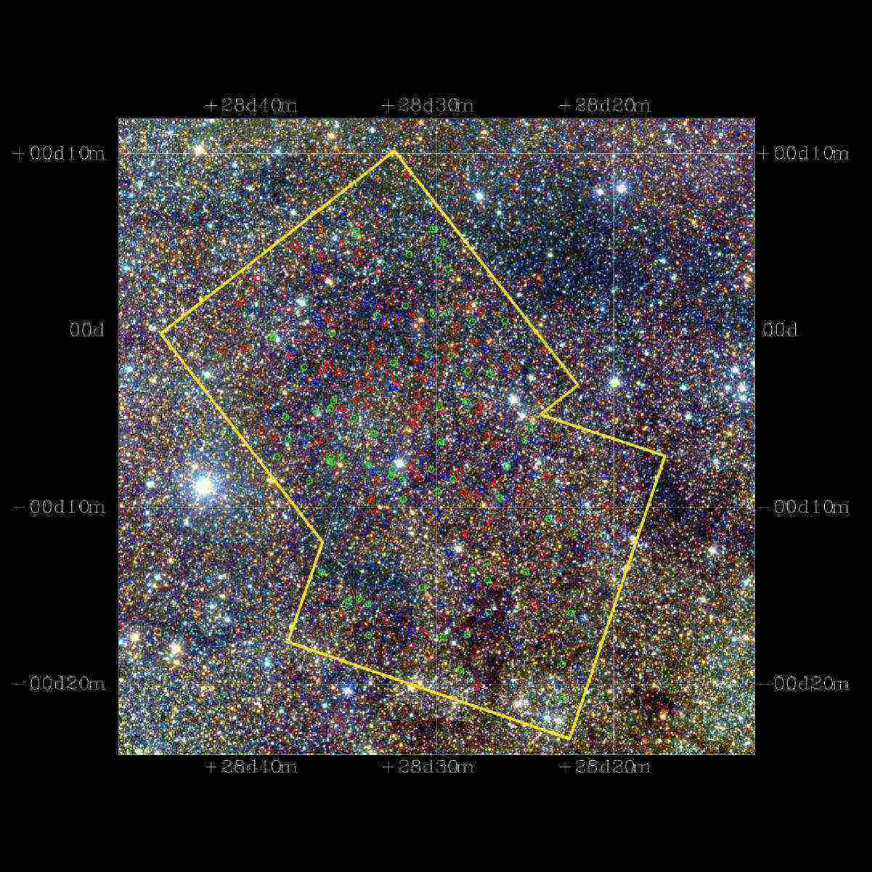
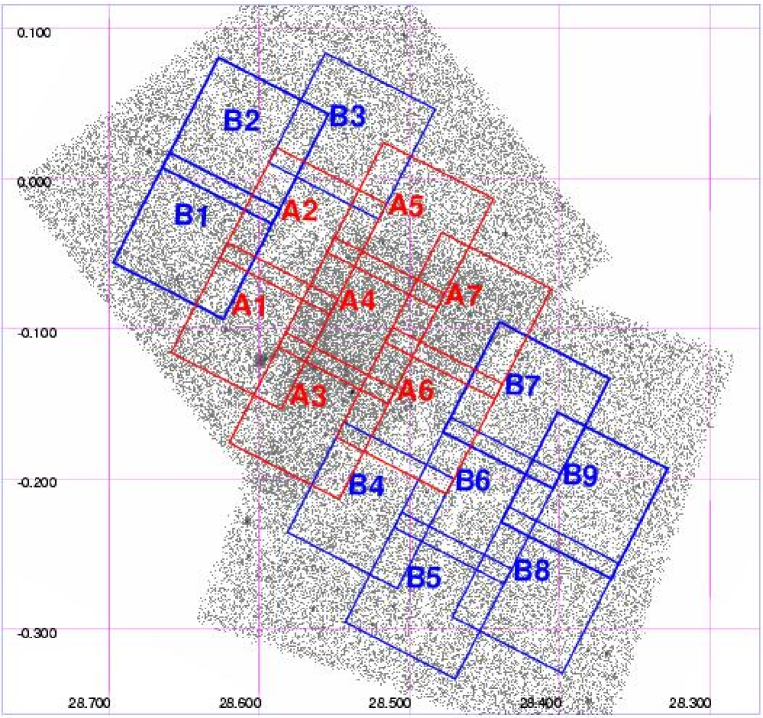
The 2MASS database covers all the sky, and its Point Source Catalog gives the accurate positions and , and magnitudes of all the major stars in our Chandra field of view (Fig. 2). In order to study more deeply than 2MASS, we have carried out a NIR follow-up observation at ESO using NTT (Tarenghi and Wilson 1989) with the SOFI infrared camera during the nights of 2002 July 28th and 29th. SOFI has HgCdTe pixels with a moderately large field of view (). The pixel size is , which is comparable to the Chandra one ( pixel), thus very suitable to identify Chandra X-ray sources. We performed a mosaic observation composed of the 16 pointings slightly-overlapping each other to cover the central region of the two Chandra fields (Fig. 3). We defined seven central “A” fields and nine surrounding “B” fields to cover 75 % of the total Chandra field. The total exposure times for , and bands for each A-field are 10, 10, and 14 minutes, respectively, and those for each B-field are 5, 5, and 7.47 minutes respectively. According to the standard SOFI observation procedure, we carried out a dithering observation, such that each field is covered by 5 ( and band in B-field), 8 ( band in B-field), 10 ( and band in A-field) or 15 ( band in A-field) sequential “frames”, each jittered by . Exposure time for each frame was 60 ( and bands) or 56 seconds ( band), and each frame was furthermore divided into 6 ( and bands) or 8 ( band) read-out segments in order to avoid saturation. Thus, each frame was the average of the 6 ( and bands) or 8 ( band) snap-shot images. The seeing was best in the first night () when we observed fields A1 through A6 (but only and bands for A6), whereas in the second night, the seeing was worse () when we observed the remaining fields.
IRAF333IRAF (Image Reduction and Analysis Facility) is distributed by the National Optical Astronomy Observatories, which are operated by Association of Universities for Research in Astronomy, Inc., under cooperative agreement with the National Science Foundation. was mainly used to reduce the data following the standard procedure, i.e., subtraction of the dark current, flat-fielding using the dome flat, subtraction of sky using the median-sky technique, removal of bad pixels and cosmic-ray events, and trimming the frame edges. SExtractor (Bertin & Arnouts 1996) was used to extract sources. We searched for sources in each , and band separately, and detected 16,890, 26,285 and 27,174 sources (with the DETECT_MINAREA, DETECT_THRESH, and ANALYSIS_THRESH SExtractor parameter values 5, 1.5, and 1.5, respectively) in , and bands, respectively. After removing the overlapping sources, 32,398 sources have been detected at least in one of the three bands (Table 2).
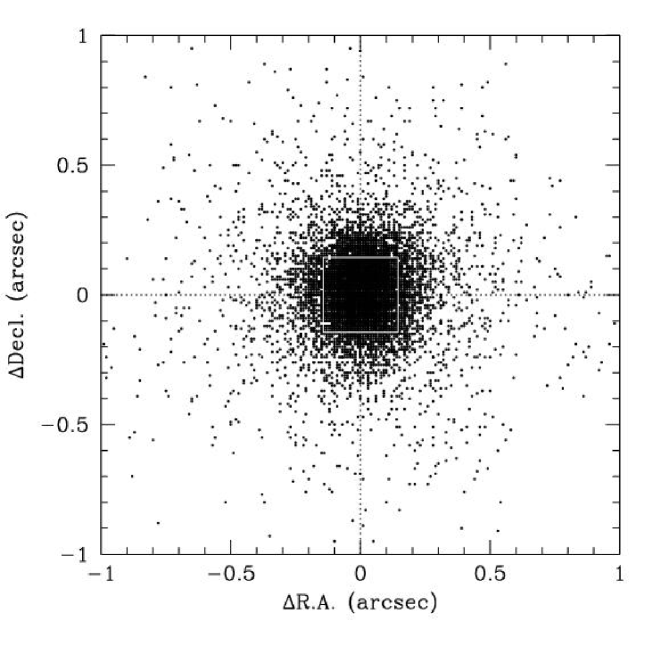
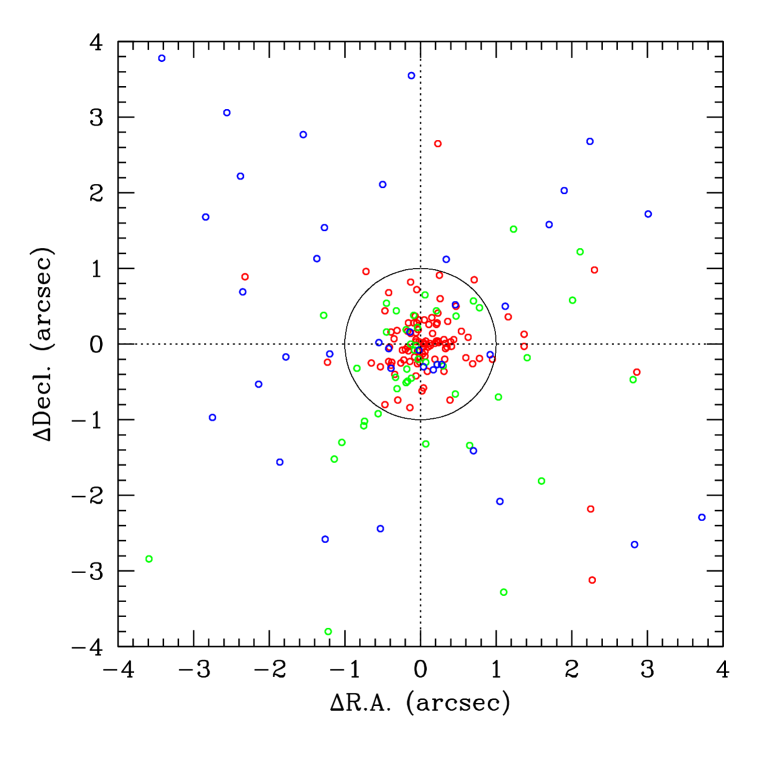
Using the 2MASS database as a reference, we have carried out astrometric correction and absolute magnitude calibration. In Fig. 4, we compare 2MASS and SOFI positions after the astrometric correction. The standard deviation of the shifts between 2MASS and SOFI is in R.A. and Decl., which is smaller than the SOFI pixel size (), and may be taken as a typical 2MASS and/or SOFI positional uncertainty. Considering the 2MASS source within radius as a counterpart, 8,655 SOFI sources are identified in 2MASS (Table 2).
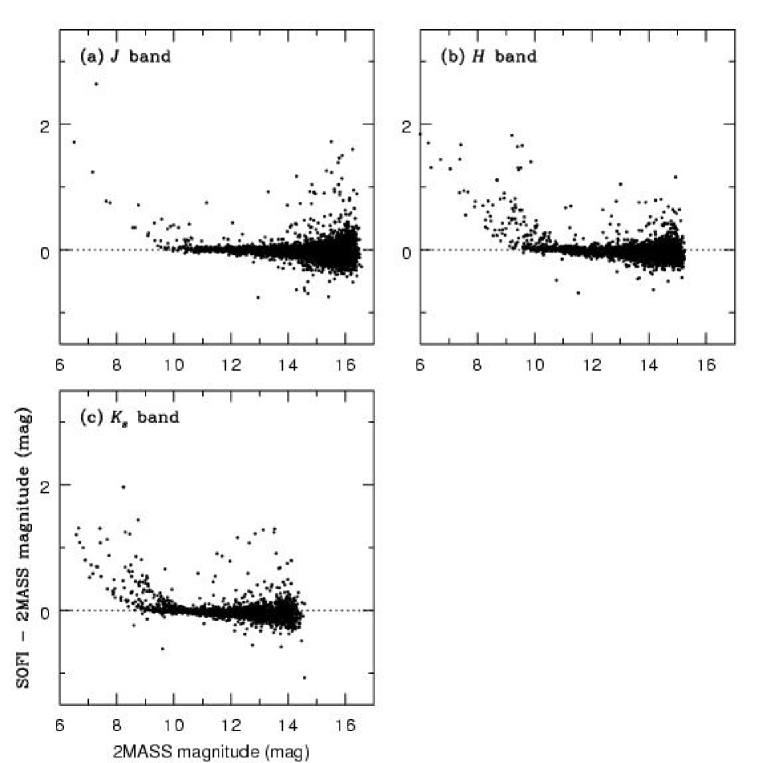
In Fig. 5 we show correlation of the 2MASS and SOFI , and magnitudes after the photometric correction. SOFI magnitudes tend to be greater than those of 2MASS for sources brighter than mag, where SOFI starts to saturate. Also, there is increasing confusion in the 2MASS-SOFI correlation for stars fainter than 14, 13 and 12, because of the relatively large 2MASS pixels. This leads to the increasing scatter in the 2MASS-SOFI photometric comparison. For the cleanest samples between 10 and 12 mag, the standard deviations of the 2MASS – SOFI magnitude differences are 0.08, 0.10, and 0.12 mag in , , and bands, respectively (for comparison, the 2MASS measurement precision for bright, non-saturated sources is 0.01 to 0.02 mags). These values may be considered as our typical photometric uncertainties.
In Fig. 6 we show cumulative histograms of the SOFI and 2MASS sources as a function of the SOFI magnitudes. We can see that our sample is almost complete down to 18, 17 or 16 mag in , , or bands, respectively, if we assume extrapolation of the power-law source distribution at the brighter counts. The depletion of the sources dimmer than these limiting magnitudes may be due to our sensitivity limit and/or depletion of the intrinsic source population. We can also see the depth of our SOFI observation relative to 2MASS which saturates at around 16, 15 or 14 mag in , , or bands, respectively.
Finally, we estimate our SOFI sensitivity for normal stars. We assume an A0 star with the -band absolute magnitude . At the sensitivity 16 mag in the -band, we would be observing the A0 star as far as kpc, since the source will have mag without reddening, and , assuming cm-2 mag-1 and an interstellar hydrogen density of cm-3.
3 DATA ANALYSIS AND RESULTS
3.1 Separation of the Diffuse Emission and Point Sources
One of the main goals of the present observation is to separate the diffuse X-ray emission from the point sources, and to study the diffuse spectrum free from the point source contamination. We have extracted an energy spectrum from both AO1 and AO2 data excluding the AX J 1843.8–0352/G28.6–0.1 region (marked in Fig. 1). Using the non-X-ray background database provided by Chandra X-ray Center (CXC), we have subtracted the background spectrum.
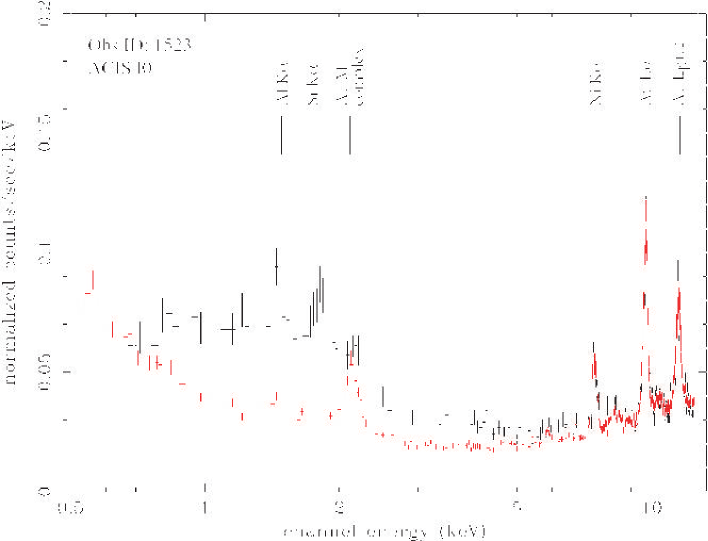
The CXC background database is constructed from a set of blank sky observations at high Galactic latitudes excluding recognized celestial sources. We have made background spectrum for each CCD chip, and the relative normalization of the background subtraction was adjusted for each chip and pointing to cancel the X-ray flux in the range of 10.5 – 12.5 keV (where ACIS is not sensitive to X-rays; Fig. 7). Note that there are several conspicuous instrumental lines in the background spectrum (Fig. 7; Townsley et al. 2002a,b). After background was subtracted for each chip and pointing in this manner, all the spectra from different chips and pointings have been combined for subsequent spectral study. After the background is thus subtracted, our spectrum is expected to include only point X-ray sources (Galactic and extragalactic) and Galactic plane diffuse emission. We notice that our results on the Galactic diffuse emission may not escape from uncertainty of the background subtraction. For example, the CXC background might include local soft diffuse emission which is presumably higher at high Galactic latitudes. However, in the 2 – 10 keV energy band, which we are most interested in, the particle background dominates, and its normalization may be correctly estimated (Fig. 7).
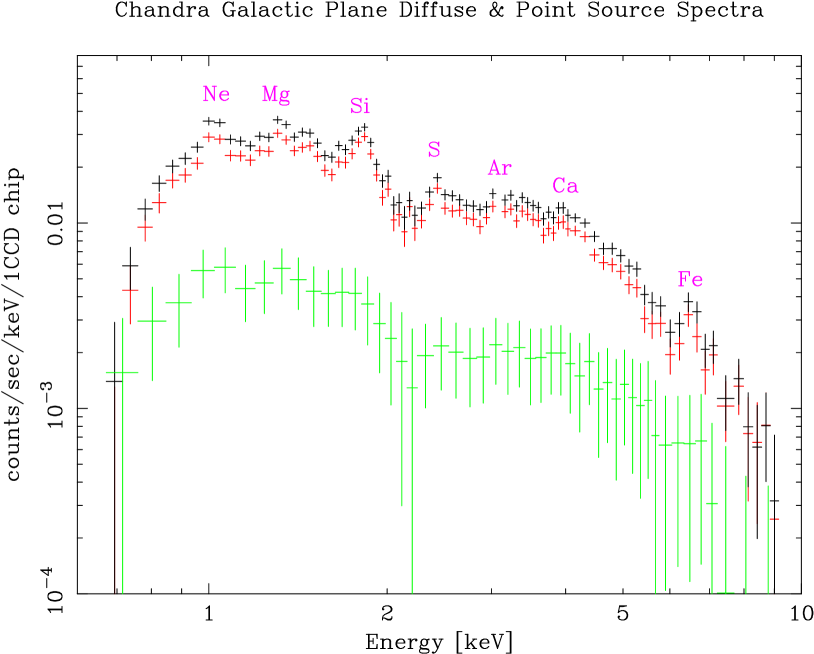
We have made an energy spectrum combining all the point sources in Table 1, subtracting the background in the same manner. In Fig. 8, we show the total energy spectrum and the combined point source spectrum, as well as the difference between the two. We can see that only 10 % of the total X-ray emission in the Chandra field of view is explained by the sum of all the detected point sources. Therefore, the difference spectrum, explaining 90 % of the total flux, is considered to be mostly the Galactic diffuse emission, though it should include some contribution from the point sources below our detection threshold (see detailed discussion in Section 4.4). We can see that emission lines from highly ionized heavy elements are associated with the diffuse emission. Although presence of the various emission lines in GRXE has been known for a long time (e.g., Koyama et al. 1986; Yamauchi and Koyama 1993; Kaneda et al. 1997), it is now clearly seen that these emission lines are from the diffuse emission, not from the point sources. More detailed diffuse emission spectral analysis is presented in Section 3.6.
3.2 Spectral Hardness-ratio and Source Fluxes
In order to study spectral characteristics of these new point sources, we computed energy flux and spectral hardness ratio () for each source. The detected raw source counts do not represent the correct source intensities, since they are affected by positional dependence of the detector response (mostly mirror vignetting). Hence, we define and calculate the “normalized count rate” for each energy band, that is the count rate expected when the source is located on the ACIS-I aim point (on-axis direction) and observed for 100 ksec exposure. We define the spectral hardness ratio as , where is the normalized count rate in the hard energy band (3 – 8 keV), and is that in the soft energy band (0.5 – 2 keV). The normalized count rates and are also shown in Table 1.
To determine source energy fluxes, we need to assume spectral models, but most sources are too dim to determine their energy spectra individually. Therefore, we took the following approach: first, energy spectra are extracted for all the sources, and corresponding instrumental responses were calculated. We categorized the sources into four spectral groups according to the hardness ratio; , , and . For each spectral group, all the source spectra and responses were averaged. The background spectrum was extracted in the blank detector field for AO1 and AO2 separately, and subtracted from the average spectra (thus, the Galactic diffuse emission is subtracted). Then, we fitted these four average spectra with an absorbed power-law model, and determined the average hydrogen column density and power-law index for each spectral group. The best-fit spectral model parameters, from the softest spectrum to the hardest one, are the following : = 0.66, 0.83, 3.4 and 8.0 cm-2 and photon-index = 4.0, 2.1, 1.9 and 1.2. As expected, the higher the goes up, the larger the absorption becomes and the flatter the spectral slope is. Finally, each source in the same spectral group was “fitted” with the average spectral model after background subtraction, only by adjusting the normalization. From the spectral model thus determined for each source, we calculated the 0.5 – 2 keV and 2 – 10 keV energy fluxes (Table 1). Note, individual source energy fluxes thus estimated may not help suffering from uncertainty of the spectral assumption. However, if we integrate all the sources, the total point-source energy flux should be valid, since we have assumed the average source spectrum for each spectral group.
3.3 and Source Population
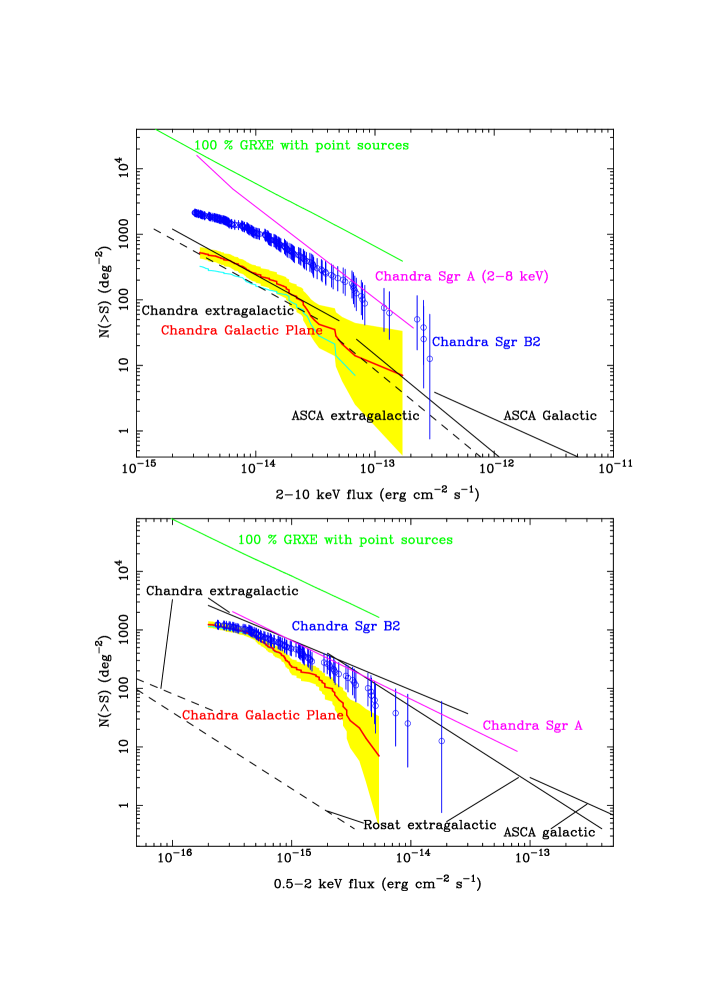
We study the point source number densities with the analysis in the hard band (2 – 10 keV) and soft band (0.5 – 2 keV) separately, adopting the source energy fluxes determined above (Fig. 9). The curve in the hard band using only the AO1 data was already presented in Ebisawa et al. (2001). We set the lower flux limits at erg s-1 cm-2 in the hard band and erg s-1 cm-2 in the soft band, respectively, which approximately correspond to the 4 detection limits near the on-axis.
We compare our Galactic plane curves with those of bright ASCA Galactic sources (Sugizaki et al. 2001), extragalactic point sources detected with ASCA (Ueda et al. 1999), ROSAT and Chandra (Giacconi et al. 2001). The extragalactic sources are significantly absorbed on the Galactic plane with a hydrogen column density of cm-2 (Section 2.3). Assuming a typical photon index of , we took into account the flux reduction due to the Galactic absorption, and made curves of the extragalactic sources expected to be seen through the Galactic plane (dashed lines in Fig. 9).
Let’s compare our Galactic plane curves with those for extragalactic sources. In the soft energy band, number of the Chandra sources detected above the lowest flux limit is more than 20 times higher than that expected from the extragalactic sources through the Galactic plane (dashed line). Therefore, it is no doubt that most of the soft sources are Galactic. On the other hand in the hard energy band, the situation is quite different; the extragalactic curve explains most of the observed sources on the Galactic plane. Hence, the observed dichotomy of the source population (Section 2.2) may be naturally explained in that most of the soft X-ray sources have the Galactic origin, while majority of the hard X-ray sources are extragalactic.
3.4 NIR Identification and Source Classification
We may classify the new X-ray sources according to the . We define the “soft” sources whose are equal or less than the median . For the rest, the median is , so the “medium” and the “hard” sources are defined as those with and , respectively. Excluding the sources obviously associated with the extended structure CXOU J184357-035441 (Ueno et al. 2003), number of the soft, medium and hard sources we have detected is 136, 65 and 69, respectively (Table 3). Also, we plot the locations of the soft, medium and hard Chandra sources on the 2MASS image with different colors (Fig. 2).
Our Chandra position accuracy is mostly limited by photon statistics and distortion of the point spread function. We may expect an error of for dim sources far from the aim points. We consider the NIR sources found within of the Chandra positions as counterparts. For the Chandra sources in the SOFI fields ( 75 % of all the Chandra sources; Table 3), we show SOFI counterparts in Table 1. 2MASS counterparts are given in Table 1 for the Chandra sources outside of the SOFI fields.
The SOFI detected 32,000 sources (Table 2) from the deg2 field (Fig. 2 and 3), namely, the SOFI source number density is arcsec-2. Therefore, within circle around any Chandra sources, SOFI source is expected by chance. In other words, we should be reminded that 10 % of the Chandra sources will have accidental SOFI counterparts.
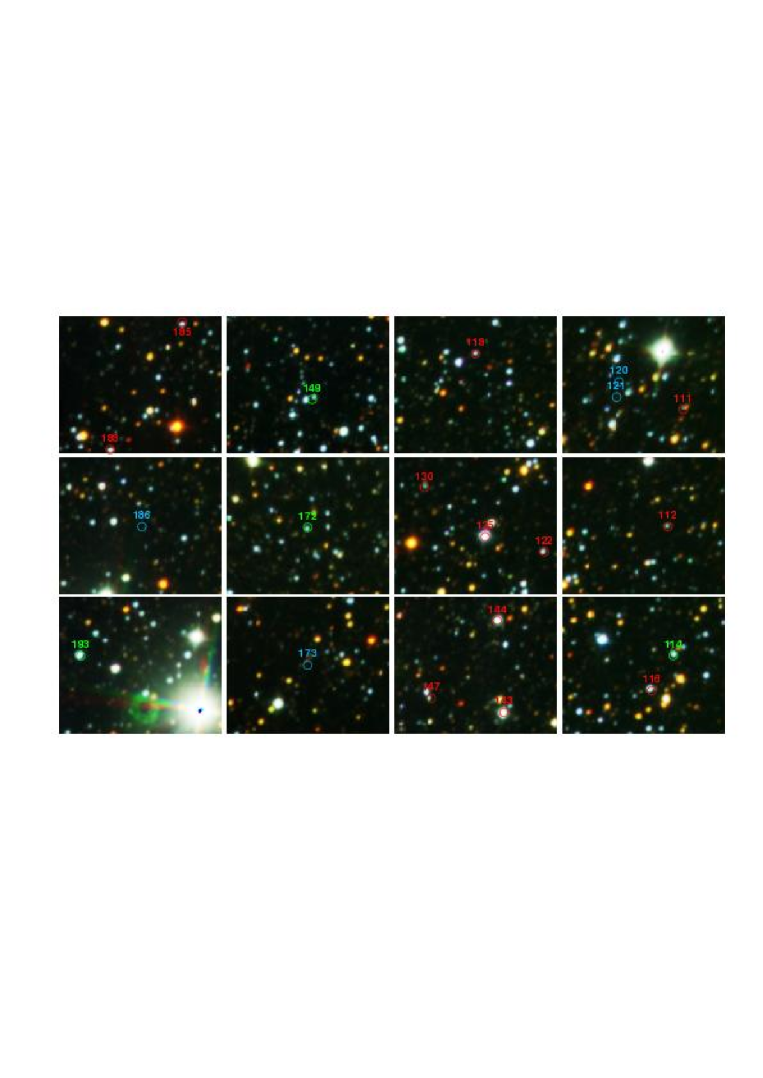
In Fig. 10, for each of the Chandra sources in the SOFI fields, we plot the relative positional difference to the nearest SOFI source. It is easily seen that most of the soft sources have the NIR counterparts, while medium and hard sources are less likely to have counterparts. In fact, the percentage of the Chandra sources having the SOFI counterparts is 83, 53, and 22 % for soft, medium, and hard sources, respectively (Table 3). For all the Chandra sources, the percentage with 2MASS counterparts is 45, 26 and 12 %, respectively (Table 3). The fact that the detectability of the NIR counterparts decreases with is consistent with the idea that most soft sources are Galactic, while most hard sources are extragalactic. In fact, if these hard X-ray sources are background AGNs, assuming a typical X-ray/NIR luminosity ratio and the significant Galactic extinction, they are too dim to be detected in the NIR band (see Section 4.1). Examples of the NIR counterparts for the Chandra sources are shown in Fig.11. This is for the SOFI “A4” field (Fig. 3), which is covered by both AO1 and AO2 observations. Note that all the 16 soft and medium sources have NIR counterparts, though none of the four hard X-ray sources are identified.
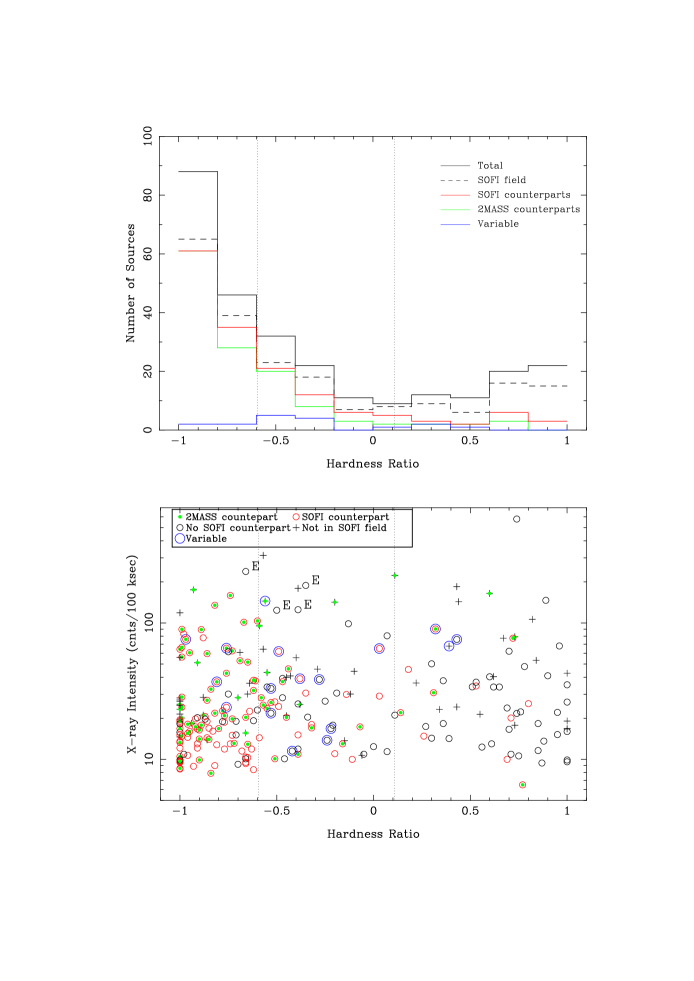
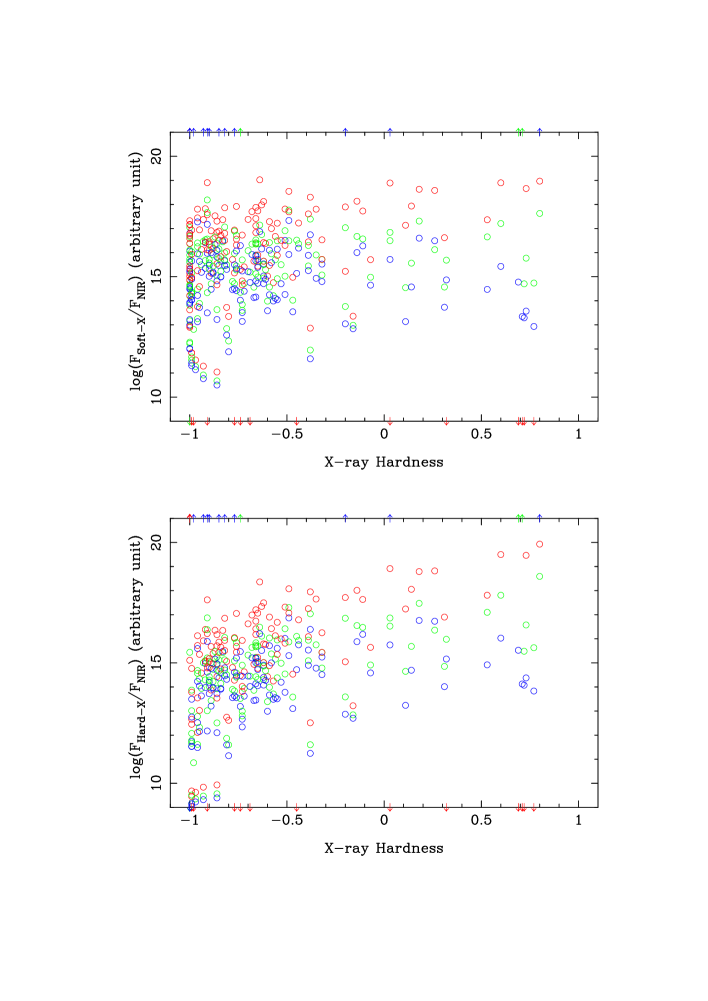
In Fig. 12 (top), we show histograms of the number of sources as a function of . It is curious to see that the softest sources are most numerous, and that the number of sources first decreases with till and then increases again. On the other hand, number of the sources having NIR counterparts decreases monotonically with increasing . This also suggests that our source population is composed of the two distinct spectral classes, the most numerous Galactic soft sources and the less numerous extragalactic hard sources.
The bottom panel of Fig. 12 shows the normalized X-ray counting rates (Section 3.2) versus , as well as presence or absence of the NIR counterpart for each source. We see that almost all the soft sources have NIR counterparts except several dimmest ones. On the other hand for the hard sources, presence or absence of the NIR counterparts is not related to the X-ray brightness. Those identified soft X-ray sources are presumably nearby stars, and the small number of unidentified soft sources are considered to be farther NIR dim stars (see also Section 3.5.2). The hard X-ray sources without NIR counterparts are mostly likely to be background AGNs, whose fluxes are distributed in a wide range. In particular, the brightest hard source (Source 200) is not identified in NIR, thus considered to be a strong AGN candidate.
3.5 X-ray Characteristics of the Point Sources
3.5.1 X-ray Spectra/Hardness
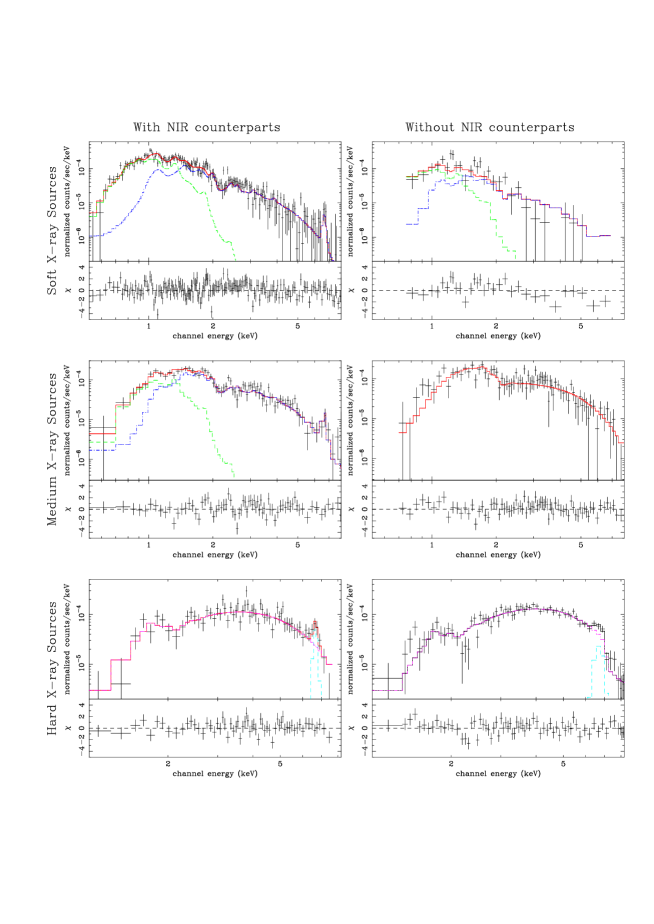
Since most X-ray sources are too dim (as low as 10 counts) to make individual spectra, we combined the sources having similar spectral hardness and made average energy spectra to investigate their spectral characteristics as a class. We categorized all the point sources into six groups, three ranges of the X-ray spectral hardness (Section 3.4), and further grouped according to the presence or absence of the NIR counterparts. We made an averaged energy spectrum for each group.
In Table 4, we show the spectral parameters of the six spectra fitted with a simple absorbed power-law model to quantify spectral characteristics. For a given spectral hardness, the photon index was determined for the group having more sources, either with or without NIR counterpart, and fixed for the other group. This helps to clarify the difference of the hydrogen column densities and normalizations between the two groups in the same spectral hardness.
Since the hydrogen column density can be a measure of the distance to the sources, the gradual increase of the column density from soft to hard suggests that the medium and the hard sources are more likely to be located further than the soft sources. Also, the medium and hard sources without NIR counterparts show clear excess of the hydrogen column densities compared to those with the counterparts, which implies that the the sources without NIR counterparts tends to locate further (presumably extragalactic) than those with NIR counterparts (likely to be Galactic). Interestingly, in spite that the sources without NIR counterparts are presumably further, they are brighter in both the observed fluxes and the intrinsic fluxes than the sources with NIR counterparts (Table 4). This will make sense that most hard and medium sources are background AGNs which are bright in X-rays but not seen NIR.
On the other hand, if we compare the soft sources without NIR counterparts and those with counterparts, the average X-ray energy flux of the formers is 40 % smaller than the latter (Table 4). This suggests that the soft X-ray sources without NIR counterparts are further than and/or intrinsically dimmer than those with NIR counterparts. This makes sense considering that almost all the soft sources are X-ray active stars in the Galaxy.
3.5.2 Spectral Fitting
In the previous section, we used a simple absorbed power-law model to study the difference of the six average spectra (Table 4). Here, we fit the average source spectra with more physically meaningful models, and also study the iron line feature more carefully.
The X-ray energy spectrum of an active stars is characterized by a two temperature plasma model. Therefore, we used a two temperature MEKAL model in XSPEC (version 11.3.1) for the soft spectrum with NIR counterparts. The spectrum is well fitted with a two temperature plasma at 0.2 keV and 2.0 keV (Table 5). An ionized iron emission line is expected from the high temperature plasma, and indeed there is an evidence of iron emission line though not very strong (Fig. 13, top left). Assuming that the soft sources without NIR counterpart have the same X-ray spectral properties, we tried exactly the same spectral model (including ) and allowed only the overall normalization to be a free parameter. We found the fit is reasonably well, with 52 % of the normalization of the soft sources with NIR counterpart (Fig. 13, top right). So, soft X-ray sources without NIR counterparts are dimmer in X-rays than those with NIR counterparts due to intrinsic low X-ray and NIR luminosity and/or due to large distances.
Average energy spectrum of the hard sources with NIR counterparts exhibits a conspicuous narrow iron emission line (Fig. 13, bottom left). The line center energy is 6.67 keV and the equivalent width is 540 eV (Table 5). These iron line parameters and the flat spectrum (photon-index = 1.47) correspond to a plasma temperature of 8 keV. Such a high temperature thermal spectrum is a characteristic of quiescent cataclysmic variables (e.g., Ezuka and Ishida 1999). In fact, cataclysmic variables have been considered prime candidates for faint Galactic hard X-ray sources (e.g., Mukai and Shiokawa 1993; Verbant et al. 1997; Watson 1999). On the other hand, the hard sources without NIR counterparts do not show a narrow iron emission line, but have a broad line and an edge feature which may be modeled with a neutral iron edge (at 7.11 keV) and a broad emission line (at 6.67 keV, EW = 340 eV). These iron features as well as the flat spectrum (photon-index = 0.77) are reminiscent of the disk reflection spectrum often seen in Type II AGN.
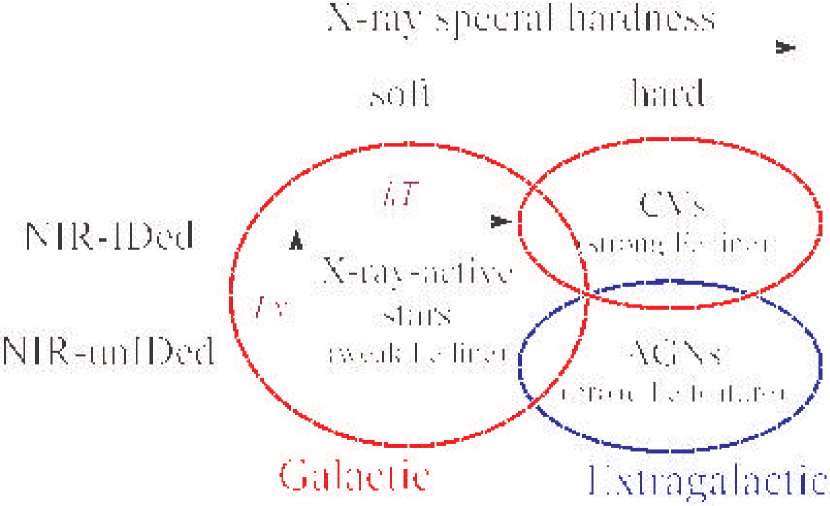
The average spectrum of medium sources with NIR counterpart can be fitted with two temperature plasma model, in which the soft component temperature (0.2 keV) is similar to that of the soft spectrum but the hard component temperature is higher (2.9 keV), suggesting a mixture of the relatively hot stars and soft cataclysmic variables. The average spectrum of medium sources without NIR counterpart can be fitted with a power-law which is steeper and less absorbed than the hard sources, presumably indicating a composite of faint hot stars and soft AGNs. A schematic view is shown in Fig. 14 for classification of the X-ray sources based on X-ray spectral hardness ratio and presence or absence of the NIR counterparts.
3.5.3 Time Variation
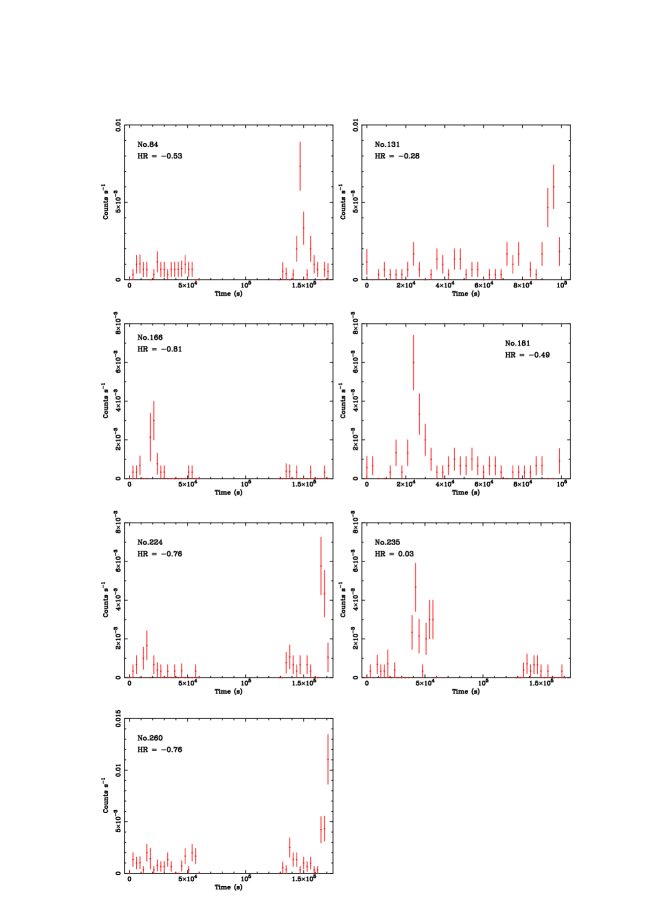
We study time variation of the point sources. For each source, we have made two light curves with bin-widths of 3,000 sec and 10,000 sec. We performed the Kolmogorov-Smirnov test, and if both light curves show variations above 99.9 % significance level, we consider the source to be significantly variable. In our sample, 17 sources are found to be variable, which are marked in Table 1 (“” in the first column). The distribution of the hardness ratio for these variable sources is shown in Fig. 12 (blue circles). Flare-like variation of “rapid-rise and slow-decay”, which is distinctive to X-ray active stars, has been found from seven sources (Fig. 15). The average of these seven sources is , which reinforces our idea that nature of these sources is X-ray active stars.
3.6 Spectral Study of the Diffuse X-ray Emission
3.6.1 Line Emission
First, we concentrate on the iron and other emission lines of the diffuse emission. We fit the iron energy band (5.5 – 7.2 keV) and soft energy band (0.8 – 3.5 keV) separately with a simple power-law plus gaussian model, and determine the line parameters.
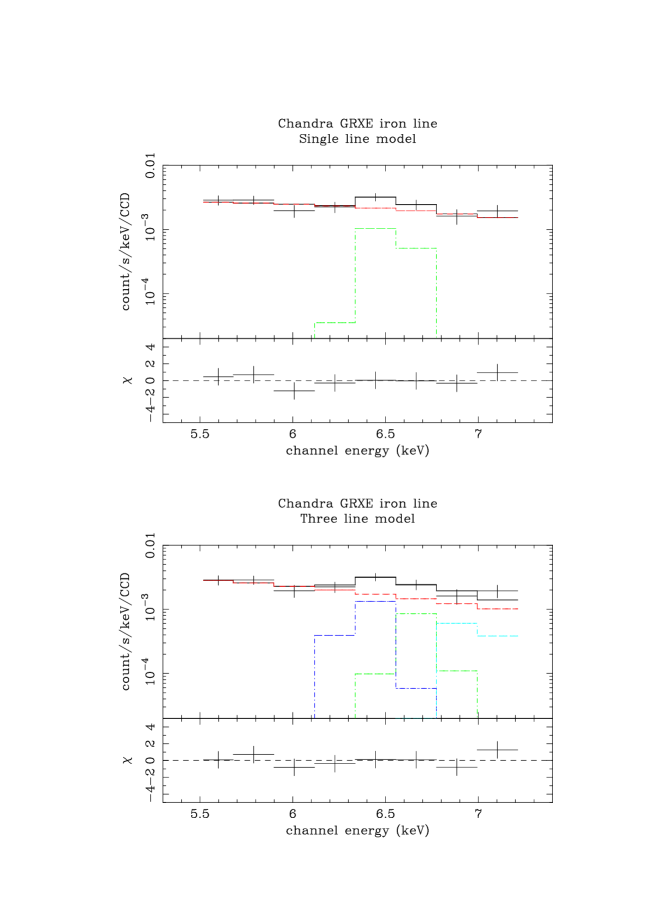
We point out that ACIS-I iron line measurement has a significant merit in that contaminating instrumental iron line, which was problematic in ASCA and XMM-Newton diffuse spectral study, is almost fully negligible. In the iron energy band, a single narrow gaussian model is successful (Table 6; Fig. 16, top). The central line energy is keV (90 % error), which is consistent with Kaneda et al. (1997; keV), and significantly lower than what expected from He-like iron in a thermally equilibrium plasma (6.67 keV). A possible explanation of the line energy shift is that the plasma is in non-equilibrium ionization (NEI) state (Yamauchi and Koyama 1993; Kaneda et al. 1997), or the line is composed of a fluorescent 6.4 keV line and a thermal 6.67 keV line (Valinia et al. 2000b). Considering the latter possibility, we fit the same spectrum with a multiple line model. In addition to these two lines, if the charge exchange takes place between the cosmic-ray iron nuclei and interstellar hydrogen atoms (Tanaka, Miyaji, & Hasinger 1999; Tanaka 2002), a hydrogenic iron line at 6.97 keV is expected. Thus, we fit the observed spectrum with the three lines with fixed energies (Table 6; Fig. 16, bottom). The fit is acceptable, though slightly worse than with the single line model. The cosmic-ray charge exchange model predicts significantly broadened emission lines due to the energetic cosmic-ray bulk motion (Tanaka, Miyaji, & Hasinger 1999; Tanaka 2002), but from our statistics we could not constrain the intrinsic iron line width.
We found that the iron line equivalent width in GRXE is significantly dependent on the spectral model, and difficult to be determined uniquely. With a single narrow line model we obtained eV, which is smaller than the ASCA value with the same model and same sky region, eV (Kaneda et al. 1997). Contamination of the point sources with strong iron emission in the ASCA spectrum might explain the different at least to some extent. On the other hand, with the three line model, our equivalent width values are eV, , and eV, which are consistent with the ASCA result using the same three line model on the same sky, eV, and eV (Tanaka 2002), though errors are large.
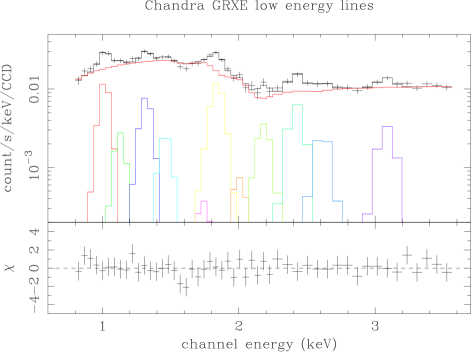
Similarly, the soft band energy spectrum was fitted with a power-law continuum and eleven gaussians (Table 7; Fig. 17). These are the same lines detected in ASCA (Kaneda et al. 1997), with an additional line at 2.19 keV which probably originates in the instrumental Au M complex (Fig. 7). Equivalent width values are consistent with those in Table 4 in Kaneda et al. (1997), except that we find weaker 1.74 keV (low ionized Si) and 2.00 keV (Si XIV,Ly) lines.
3.6.2 Fit with Non-Equilibrium Ionization Plasma Model
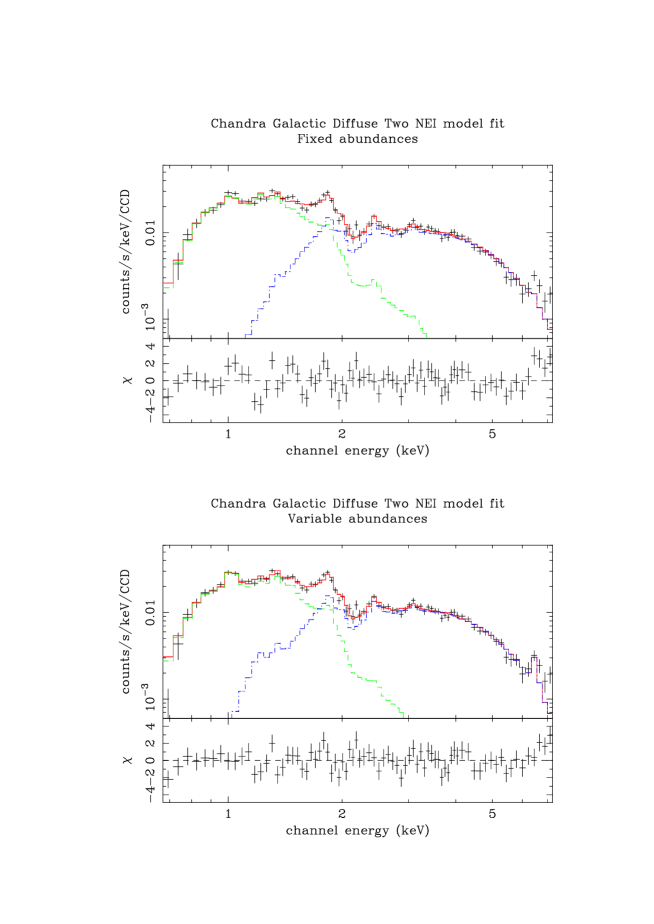
We now try to fit the observed diffuse spectrum with a more physically reasonable model. As a working hypothesis, we adopt the same spectral model used by Kaneda et al. (1997), which is a two temperature NEI model (Masai 1984), such that there are soft and hard NEI components which have different temperatures, normalizations, ionization parameters and are affected by different amounts of interstellar absorption.
First, we fix the element abundances for the soft component and hard component, respectively (Table 8 left; Fig. 18 top). The fit is not satisfactory (reduced ), and in particular, the observed iron and neon emission lines are not explained. Next, we adjust abundances of Ne, Mg, and Si in the soft component, and Fe abundance in the hard component (Table 8 right; Fig. 18 bottom). Now the fit is better (reduced ), though artificial adjustment of the abundances is unexplained. Still, we notice a hint of high energy excess above iron line energy, which may be related to the non-thermal component reported above 10 keV (Yamasaki et al. 1997; Valinia et al. 2000b).
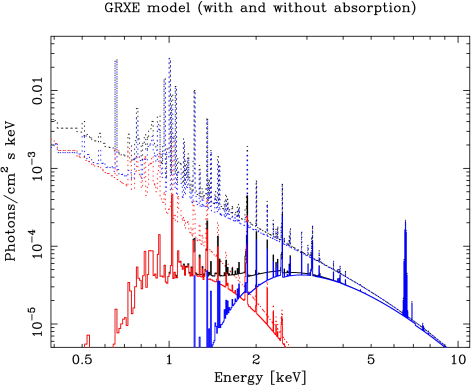
With the two component model fit, we have determined the observed flux from the soft and hard component as and erg cm-2 s-1 str-1 (0.7 – 10 keV), respectively. Note that the observed flux and spectral shape are significantly affected by the heavy interstellar absorption (Fig. 19). Although the soft component is dominant in the observed flux below 2 keV, the hard component is more dominant over the entire energy band if absorption is removed. If the absorption is removed, the intrinsic fluxes are and erg cm-2 s-1 str-1 (0.7 – 10 keV) from the soft and hard component, respectively444Using the same two component model, Kaneda et al. (1997) gave the intrinsic (= absorption removed) soft and hard component fluxes and erg cm-2 s-1 str-1 (0.5 – 10 keV), respectively. We remark that, in the NEI models we assume, strong oxygen lines are expected between 0.5 keV and 0.7 keV (Fig. 19), which are hardly observable below the low energy thresholds of both ASCA and Chandra. Therefore, it will be more reasonable to compare the fluxes in 0.7 – 10 keV, not in 0.5 – 10 keV. Calculated from the NEI model parameters by Kaneda et al. (1997), the observed soft and hard component fluxes with ASCA are and erg cm-2 s-1 str-1 (0.7 – 10 keV), respectively, and the intrinsic soft and hard component fluxes are and erg cm-2 s-1 str-1 (0.7 – 10 keV), respectively. Note that excluding the 0.5 – 0.7 keV energy range makes the intrinsic soft component flux 10 times less. Flux difference between ASCA and Chandra is discussed in Section 4.3..
4 Discussion
4.1 Origin of the Faint X-ray Point Sources on the Galactic Plane
We have detected 270 point X-ray sources (above 4 significance) on a typical Galactic plane field at around within 250 arcmin2, down to the flux limits erg s-1 cm-2 (2 – 10 keV) or erg s-1 cm-2 (0.5 – 2 keV). Thereby we extended the X-ray curves on the Galactic plane to much dimmer levels than previous observations. In the brightest ends, our curves match well with those by XMM-Newton (Hands et al. 2004) and ASCA (Sugizaki et al. 2001) carried out on larger Galactic plane regions.
Based on the X-ray spectral properties and presence or absence of the NIR counterparts, we have proposed a schematic view for origin of the point X-ray sources on the Galactic plane; soft X-ray sources are nearby active stars, whereas hard X-ray sources without NIR counterpart are extragalactic and hard sources with NIR counterpart are Galactic cataclysmic variables (Fig. 14). In the following, we are going to confirm this simple picture through more detailed analysis.
Considering background AGNs, assuming typical X-ray fluxes (Table 4) and a broad-band photon-index of 2 (flat energy spectrum in the plot), we estimate the expected , and magnitudes as 21 mag to 23 mag. Taking into account the further reddening (Section 2.3), there is no hope to detect those background AGNs in NIR through the Galactic plane. Therefore, we may assume that all the sources with NIR identification are Galactic.
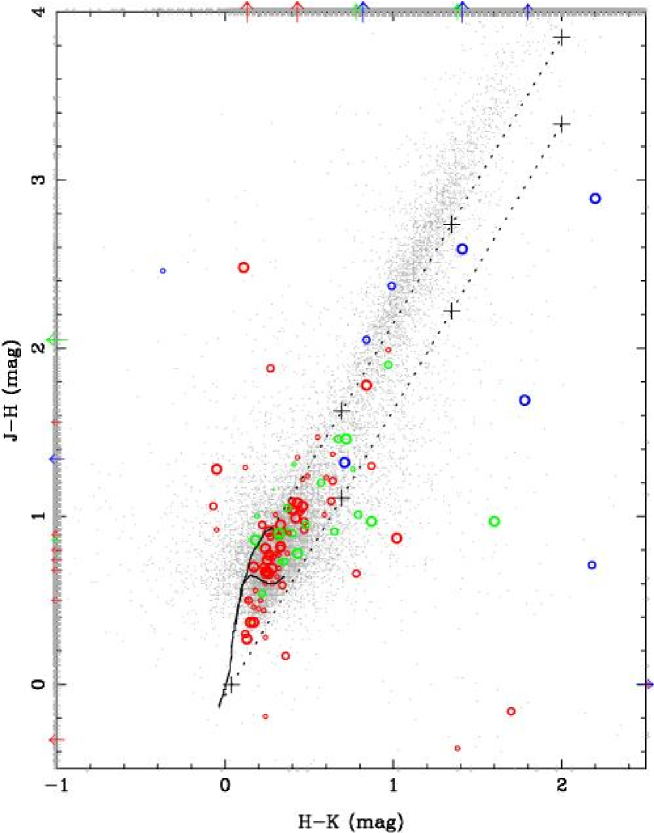
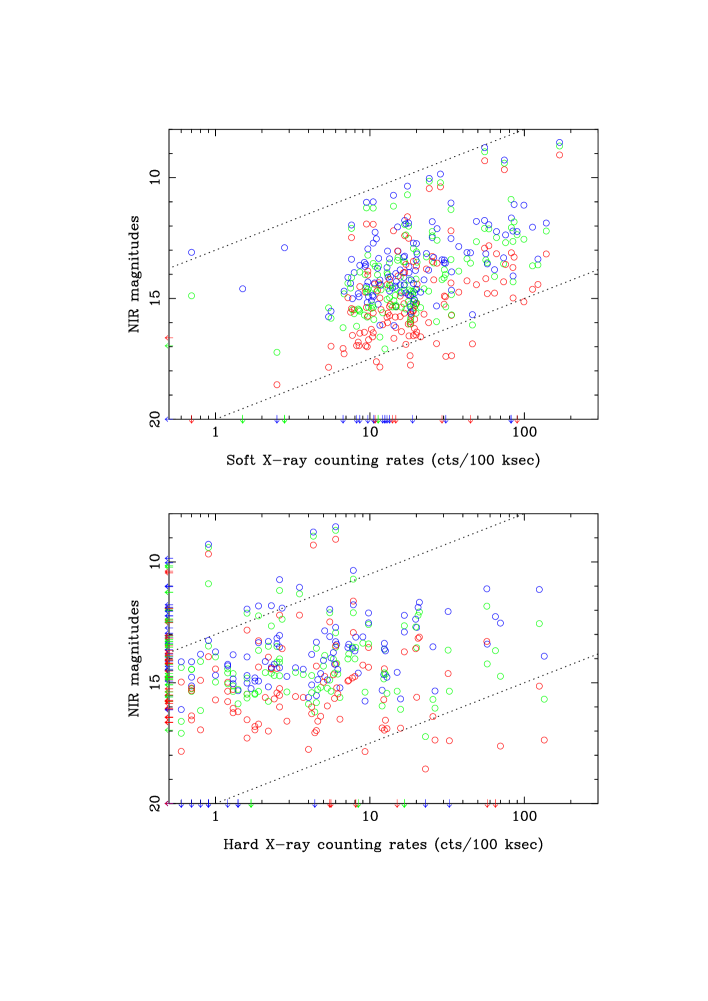
To better understand properties of the Galactic point sources with NIR counterpart, we have made a NIR color-color diagram (Fig. 20). Also, we investigate correlation between the X-ray fluxes and the NIR magnitudes (Fig. 21), and correlation between the X-ray spectral hardness and the X-ray to NIR flux ratios (Fig. 22). From Fig. 20 to 22, we notice the following X-ray and NIR characteristics of these sources:
-
1.
On the NIR color-color diagram, soft X-ray sources are mostly on the main-sequence track (Fig. 20), while medium and hard sources are more scattered.
- 2.
- 3.
The fact (1), together with the thin thermal X-ray spectra (Fig. 13), confirms stellar origin of the soft X-ray sources. The above fact (2) suggests that the observed soft X-ray and NIR flux distributions are both explained primarily due to various source distances.
The above fact (3) suggests that cataclysmic variables, hard X-ray sources, can emit hard X-rays more efficiently than X-ray active stars at a given NIR flux. Also, the wide distribution of the hard X-ray sources on the NIR color-color diagram (Fig. 20) looks similar to that of the known cataclysmic variables (Hoard et al. 2002; Cutri et al. 2005).
What about origin of the sources without NIR counterpart? Let’s first consider the soft X-ray sources. Background AGNs are unlikely, since they are almost completely absorbed in the soft X-ray band (Fig. 9 bottom). It is suggested that isolated neutron stars may be dim soft X-ray sources without optical/NIR counterparts (e.g., Popov et al. 2000). However, there is hardly an isolated neutron star among our 38 soft X-ray sources without NIR counterparts, since expected surface number density of such isolated neutron star is one per square degree (Popov et al. 2000), namely, in our Chandra field. Consequently it will be more natural to assume that those soft X-ray sources without NIR counterpart are X-ray active stars whose NIR fluxes are below our sensitivity, because of the intrinsic low NIR luminosities and/or large distances.
Regarding the hard X-ray sources without NIR counterpart (55 among the total 69 hard sources), most of them are considered to be background AGNs. In fact, the Galactic flux attenuation is minor (Fig. 9 top), thus we must be observing almost all the background AGNs on the Galactic plane. In fact, our 2 – 10 keV curve is successfully modeled by assuming that all the hard X-ray sources without NIR counterpart are extragalactic, and those with NIR counterpart are Galactic (Section 4.2).
4.2 Modeling the 2– 10 keV Curve on the Galactic Plane
We are going to model the observed 2– 10 keV curves on the Galactic plane by Chandra, XMM-Newton and ASCA, following earlier attempts by, e.g., Grimm, Gilfanov & Sunyaev (2002) and Hands et al. (2004). We assume three populations, high population (neutron star binaries), low population (white dwarf binaries) and extragalactic sources. We adopt the same Galactic disk model by Hands et al. (2004), namely, the Galactic source population depends on the Galactic radius and hight as,
| (1) |
where is the Galactocentric radius 8.5 kpc, and is determined from the differential luminosity function, as
| (2) |
The maximum diameter of the Galactic disk is assumed 20 kpc, and the hydrogen density of 0.55 cm-3 (Hands et al. 2004). We integrate the sources in the line of sight () until the edge of the Galactic plane (distance will be 27 kpc). Note that in the small Chandra field of view (), the vertical distance from the Galactic plane is pc even at the edge of the Galaxy, smaller than the 200 pc Galactic scale height. Therefore, if we assume the constant luminosity sources, the curve is expected to have the slope only determined by observing volume increase. For the extragalactic sources attenuated by Galactic extinction ( cm-2), we assumed the following functional shape (Ueda et al. 1999; Giacconi et al. 2001):
| (3) |
Now we are free to choose four parameters in equation (2) for high population and low population each. For the high population, we took , erg s-1 and erg s-1 (Fig. 23). These values are similar to those used by Grimm, Gilfanov & Sunyaev (2002) and Hands et al. (2004). Integrating the luminosity function over the Galactic plane, there will be such neutron star binaries, which is reasonable (Fig. 23). In any case, our Chandra observation is not sensitive to the choice of high population parameters, since they affect only bright sources above erg s-1 cm-2.
On the other hand, Chandra curve below erg s-1 cm-2 is significantly dependent on the low population. In particular, we are sensitive to and the normalization there. We found the choice of and erg s-1 (Fig. 23) can explain the observed Chandra, XMM-Newton and ASCA curves reasonably well (Fig. 24). In particular, the low population model curve can approximate the Chandra curve of the hard X-ray sources with NIR counterpart (line in cyan in Fig. 9 and 24), which is reasonable since these sources are considered to be Galactic (see also Section 4.1). We tried three very different = and erg s-1 (Fig. 23), but resultant differences in are hardly noticeable (Fig. 24). If integrated over the Galactic plane, we need at least such dim X-ray sources below erg s-1 (Fig. 23). There may be orders of magnitude more such dim Galactic sources depending on , but we may not constrain from the Chandra analysis above erg s-1 cm-2.
In summary, from Chandra and XMM-Newton analysis, it is no doubt that there is a low population of Galactic sources below erg s-1 and greater than in number, in addition to the well-established bright neutron star population. From our X-ray and NIR study, these dim Galactic sources are most likely to be cataclysmic variables (Section 4.1). Presence of such dim and numerous cataclysmic variables had been in fact expected (e.g., Mukai & Shiokawa 1993; Verbant et al. 1997; Watson 1999), but with Chandra and XMM-Newton we are for the first time able to measure their population and X-ray characteristics accurately.
4.3 Absolute GRXE Flux and Comparison with Other Measurements
Excluding the point sources in our field of view brighter than erg s-1 cm-2 (2 – 10 keV) or erg s-1 cm-2 (0.5 – 2 keV), we have extracted and studied the Galactic diffuse emission spectra. Using the best-fit spectral model (Section 3.6), we determine the observed diffuse emission flux as erg s-1 cm-2 deg-2 (2 – 10 keV) and erg s-1 cm-2 deg-2 (0.5 – 2 keV). The soft X-ray flux we measured might be affected by uncertainty of the background subtraction (Section 3.1). On the other hand, our measurement in the hard X-ray band is considered to be most precise to date with accurate background subtraction, well-determined mirror response and, most of all, hardly contamination from point sources.
Let’s compare our measurement in the 2 – 10 keV band with those by ASCA or XMM-Newton. In Table 9, we show the 2 – 10 keV GRXE fluxes measured by ASCA (Kaneda et al. 1997; Sugizaki et al. 2001), XMM-Newton (Hands et al. 2004) and Chandra (present paper). We should be careful that point source sensitivities in these measurements are very different, and the GRXE fluxes thus obtained necessarily contain contributions from both diffuse emission and point sources below the thresholds. If all the resolved point sources are included, our Chandra observation gives the GRXE flux erg s-1 cm-2 deg-2 in 2 – 10 keV, where the brightest point source (Source 200 in Table 1) has the flux erg s-1 cm-2. In the XMM-Newton survey (Hands et al. 2004) where point sources between to erg s-1 cm-2 deg-2 are detected, if we exclude the point sources above erg s-1 cm-2 (brightest Chandra source flux), the GRXE flux is erg s-1 cm-2 deg-2. The XMM-Newton GRXE flux is higher than our Chandra flux, but considering the lower Galactic longitudes of the XMM-Newton survey, which should result in higher GRXE fluxes, we consider the Chandra and XMM-Newton flux agreement pretty well.
On the other hand, the two independent ASCA surveys (Kaneda et al. 1997; Sugizaki et al. 2001) report much smaller GRXE fluxes than Chandra and XMM-Newton (Table 9). We suspect this might be due to systematic effects of the ASCA X-ray telescope; when largely extended sources are observed with ASCA, stray-lights from outside of the field of view ( arcmin radius) are significant. This effect is taken into account in both Kaneda et al. (1997) and Sugizaki et al. (2001) to calculate the GRXE flux, such that the diffuse flux per sky area is derived assuming the diffuse emission is uniformly distributed over the radius. In reality, the GRXE scale height may not be as large as , in that case ASCA measurements underestimate the GRXE surface flux per sky area.
4.4 Ultimate Point Source Contribution to GRXE
Let’s consider if the Galactic “diffuse” emission we obtained by removing resolved Chandra point sources may be accounted for by superposition of still dimmer point sources below our detection limits. The total energy flux observed in our Chandra field, , may be expressed as follows:
| (4) |
where the first term in the right hand side includes the diffuse emission and the contribution of the point sources equal to or dimmer than the threshold flux . The second term is the contribution from the point sources brighter than . We may define the hypothetical point source number density,
| (5) |
whose meaning is as follows: if point source detection above flux is complete, in addition to the sources brighter than , the hypothetical sources having the same flux would account for the total X-ray flux observed in the field of view. In the present case, we have set the threshold flux erg s-1 cm-2 (2 – 10 keV) and erg s-1 cm-2 (0.5 – 2 keV), then the first term in equation (4) is the “diffuse” flux we determined earlier. The second term in Eq. 4 can be obtained by integrating the detected point source fluxes above ; for the same threshold fluxes, they are erg s-1 cm-2 deg-2 (2 – 10 keV) and erg s-1 cm-2 deg-2 (0.5 – 2 keV), respectively. Therefore, the total observed flux in the field view is erg s-1 cm-2 deg-2 (2 – 10 keV) and erg s-1 cm-2 deg-2 (0.5 – 2 keV), respectively.
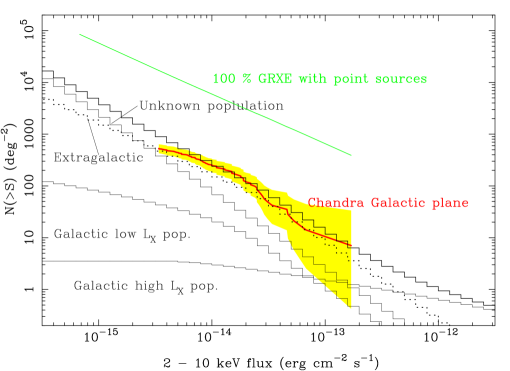
In Fig. 9 and 24, we show defined in Eq. 5 for different values of . In order to account for the total X-ray fluxes in the field of view with 100 % of point sources, it is required that the curves rapidly steepen by an order of magnitude somewhere below our sensitivity limits, which is extremely unlikely. In particular, even if we significantly extrapolate the low luminosity function to the dimmer side (Fig. 23), increase of curve is very tiny (Fig. 24).
Furthermore, we examine if introducing another unknown, still dimmer Galactic source population might explain the 100 % of the GRXE flux in 2 – 10 keV. Now we consider luminosity functions as shown in Fig. 25. There is a hypothetical source population below erg s-1, and the total number of such sources in the Galaxy is , in addition to neutron star (high ) and white dwarf (low ) populations. Although combination of these populations can more or less explain the observed Chandra curve above erg s-1 cm-2 (Fig. 26), it is not sufficient at all to explain the 100 % of GRXE. The point is that any curves of Galactic source populations, whatever the luminosity function is, cannot have a slope steeper than . Hence, no Galactic source population can explain both the observed Chandra curve and the 100 % of the GRXE flux sinultaneously. Consequently, we conclude GRXE is primarily diffuse emission.
4.5 Origin of the Galactic Diffuse X-ray Emission
We found that GRXE has a truly diffuse origin, then the question is how to produce and maintain such high energetic plasma. There are obvious problems in interpreting GRXE in terms of simple equilibrium thermal plasma, such that the plasma temperature needed to explain the observed spectra, 5 – 10 keV, is much higher than can be bound by Galactic gravity (Warwick et al. 1985). Also, the energy density of GRXE, 10 eV/cm3, is one or two orders of magnitude higher than those of other constituents in the interstellar space, such as cosmic rays, Galactic magnetic fields, or ordinary interstellar medium (Koyama et al. 1986; Kaneda et al. 1997). Currently there are no accepted theoretical models that can explain the origin of GRXE. Some argue that the interstellar magnetic field is playing a significant role to heat and confine the hot plasma (Tanuma et al. 1999). Others propose that the interstellar medium is mainly responsible for GRXE and gamma-ray emission, via interactions with, for instance, low energy cosmic-ray electrons (Valinia et al. 2000b), in situ accelerated quasi-thermal electrons (Dogiel et al. 2002; Masai et al. 2002), or heavy ions (Tanaka, Miyaji, & Hasinger 1999). Galactic particle acceleration is considered to be taking place in supernova remnants. In fact, serendipitous discovery of the hard X-ray emitting supernova remnant AXJ 1843.8–0352 in our field (Bamba et al. 2001; Ueno et al. 2003) strongly suggests a close tie between GRXE and supernova remnants.
Various theoretical models of GRXE have to be tested through observations. Different heating or acceleration mechanism of the plasma will result in different plasma conditions, which are reflected in the emission lines. Therefore, from precise measurements of the GRXE emission lines, we may in principle diagnose the plasma conditions and constrain the theoretical models. In particular, iron line spectroscopy is essential. We have shown that the GRXE iron line central energy is keV (Section 3.6), significantly lower than what expected from thermally equilibrium plasma (6.67 keV). Although from our data we could not distinguish if this iron line is really a single line or composite of two or three lines, the Chandra Galactic center diffuse spectrum clearly indicates the three emission lines from low ionized iron, He-like iron and H-like iron (Muno et al. 2004). If we assume similar origins of Galactic center and plane diffuse emission (see Section 4.6), then the three line interpretation of GRXE iron line emission seems plausible (see also Tanaka 2002). If this is the case, the 6.4 keV line is considered from fluorescence in cool interstellar medium, which may be induced, for instance, by low energy cosmic-ray electrons (Valinia et al. 2000b). The He-like and H-like lines may be from hot thermal equilibrium plasma (Valinia et al. 2000b), charge exchange process of iron ions (Tanaka, Miyaji, & Hasinger 1999; Tanaka 2002), or recombination cascades of quasi-thermal electrons (Masai et al. 2002). In the second case, the lines are expected to be significantly broadened by the iron nucleus bulk motion (Tanaka et al. 2000). In the last case, the emission lines are accompanied by recombination continuum above He-like and H-like iron K-edges (Masai et al. 2002). These three cases may be distinguished from precise spectral observation in the iron line/edge energy range.
We emphasize that the precise iron line diagnostic (including line intrinsic width measurement) is a key to resolve origin of the Galactic center and Galactic plane diffuse emission. In this context, planned Galactic center observations with Astro-E2 XRS, the first X-ray microcalorimeter in space with eV resolution, will be an enormous help. GRXE may be too dim for Astro-E2 XRS (our simulation suggests that a million second exposure is required), but we believe that the long standing mystery of GRXE will be certainly solved by future calorimeter observations with much higher throughputs and better spectral resolution, expected to be made by Con-X, NEXT and/orXEUS.
4.6 Comparison with the Galactic Center
It will be interesting to compare our point source populations in the Galactic plane () with those at Sgr A () and Sgr B2 (). We have analyzed the Chandra Galactic center Sgr B2 region data (observed in 2000 March 29 for 100 ksec, obsID=944; Murakami, Koyama and Maeda 2001) in a similar manner to our Galactic plane data analysis, and made curves for both energy bands in Fig. 9. The curves in the Sgr A region are also plotted (from Muno et al. 2003). In the hard energy band, the source number density increases dramatically toward the Galactic center, significantly exceeding that on the Galactic plane and extragalactic one. This indicates that there are much more Galactic hard point sources in the Galactic center region than in the Galactic plane. In the soft band, on the other hand, the source number density at the lowest flux level is not so different on the Galactic plane and at the Galactic center regions. This is probably because the faintest observable soft sources are mostly located in our neighborhood, so that the direction toward the Galactic center or Galactic plane will not make a big difference. In fact, such dim soft sources at the Galactic center will be more significantly absorbed ( cm-2) than those extragalactic sources in our Galactic plane field ( cm-2) , and thus hardly detected.
We also compare diffuse emission from the Galactic plane and Galactic center. Considering the diffuse spectral similarity on the Galactic plane (Section 3.6) and Galactic center (Muno et al. 2004), we are tempted to conclude that they have similar origins (see also Tanaka 2002). Recent INTEGRAL observations have detected hard X-ray emission above 20 keV in the Galactic center region whose centroid is slightly offset of Sgr A∗ (Bélanger et al. 2004). This suggests that a non-thermal hard-tail of the Galactic center diffuse spectrum is extended above 20 keV. GRXE also has a power-law hard-tail component which extends above 20 keV (Yamasaki et al. 1997; Valinia and Marshall 1998). On the other hand, strong diffuse gamma-ray ( 100 keV – 1 MeV) emission is observed from the Galactic center and plane region (e.g., Gehrels and Tueller 1993; Skibo et al. 1997; Valinia et al. 2000a; Strong et al. 2003), which is suggested to have a non-thermal origin. Intriguingly, the Galactic center and plane diffuse hard X-ray components seem to be smoothly connected to the gamma-ray components. We suspect there is a common physical mechanism in the Galactic center and plane diffuse emission to produce hard X-ray and gamma-ray emission from several keV to MeV.
5 Conclusion
Using Chandra ACIS-I, we have carried out a deep X-ray observation (0.5 – 10 keV) on a typical Galactic region at within 250 arcmin2 to study characteristics of Galactic Ridge X-ray Emission (GRXE), followed by a NIR identification observation with NTT/SOFI at ESO. Our main results are summarized below:
-
1.
We have detected 274 new X-ray sources (4 confidence) down to erg s-1 cm-2 in 2 – 10 keV or erg s-1 cm-2 in 0.5 – 2 keV. Only 26 sources are detected both in the soft and hard bands. In the SOFI field, 83 % of the soft sources are identified in NIR, while only 22 % of the hard sources have NIR conterparts. Most of the soft X-ray sources are considered to be X-ray active stars, while most of the unidentified hard X-ray sources are extragalactic.
-
2.
Only 10 % of the observed X-ray flux in the Chandra field is accounted for by the sum of point source fluxes. Even if we assume an unknown population of much dimmer and numerous Galactic sources, the observed GRXE flux is not explained. Therefore, we conclude that GRXE has truly diffuse origin, confirming our early report using half of the current Chandra data (Ebisawa et al. 2001) and in agreement with the XMM-Newton Galactic survey with a larger sky coverage (Hands et al. 2004).
-
3.
Soft X-ray sources exhibit thin thermal spectra, characteristics of active stars. In fact, they follow the track of main-sequence stars on the NIR color-color diagram. Small number of the hard X-ray sources with NIR counterpart exhibit a narrow iron emission line at 6.67 keV as a signature of the Galactic cataclysmic variables. To explain the observed 2 – 10 keV curve, we suppose there are at least cataclysmic variables in the Galactic plane dimmer than erg s-1.
-
4.
Removing contamination of point X-ray sources brighter than erg s-1 cm-2 (2 – 10 keV), we have precisely measured the Galactic diffuse X-ray emission flux as erg cm-2 s-1 deg-2 in 2 – 10 keV. The energy spectrum of the diffuse emission can be modeled with a two temperature non-equilibrium ionization model, such that the soft, less absorbed component is more highly ionized than the hard, more absorbed component.
-
5.
We have measured the diffuse iron emission line energy as keV (90 % error). This is significantly lower than what is expected from thermally equilibrium plasma (6.67 keV). This shift of the iron line energy may be explained either by non-equilibrium ionization of the plasma, or hybrid of the 6.4 keV fluorescent line and the 6.67 keV line from equilibrium plasma.
References
- (1) Bamba, A., Ueno, M., Koyama, K. , & Yamauchi, S. 2001, PASJ, 63, L21
- (2) Bélanger, G. et al. 2004, ApJ, 601, L163
- (3) Bertin, E. & Arnouts, S. 1996, A&AS, 117, 393
- (4) Cox, A. N. 1999, “Allen’s Astrophysical Quantities”, fourth edition, Springer
- (5) Cutri, R. et al. 2005, in preparation
- (6) Dame, T. M., Hartmann, D. & Thaddeus, P. 2001, ApJ, 547, 792
- (7) Dickey, J. M. & Lockman, F. J. 1990, ARAA, 28, 215
- (8) Dogiel, V.A., Inoue, H., Masai, K., Schönfelder, V. & Strong, A. W. 2002, ApJ, 581, 1061
- (9) Ebisawa, K., Maeda, K., Kaneda, H. & Yamauchi, S. 2001, Science, 293, 1633
- (10) Ebisawa, K., Yamauchi, S., Bamba, A., Ueno, M. & Senda, A. 2003, Astron. Nachr. 324, 52
- (11) Ezuka, H. & Ishida, M. 1999, ApJS, 120, 277
- (12) Forman, W., Jones, C., Cominsky, L., Julien, P., Murray, S., Peters, G., Tananbaum, H. & Giacconi, R. 1978, ApJS, 38 357
- (13) Garmire, G. et al. 2003, SPIE, 4851, 28
- (14) Gehrels, N. & Tueller, J. 1993, ApJ, 407, 597
- (15) Giacconi, R. et al. 2001, ApJ, 551, 624
- (16) Grimm, H.-J., Gilfanov, M. & Sunyaev, R. 2002, A&A, 391, 923
- (17) Hands, A. D. P., Warwick, R. S., Watson, M. G. & Helfand, D. J. 2004, MNRAS, 351, 31
- (18) Harjunpaeae, P. & Mattila, K. 1996, A&A, 305, 920
- (19) Hertz, P. & Grindlay, J. E. 1984, ApJ, 278, 137
- (20) Hoard, D. W., Wachter, S. Clark, L. L. & Bowers, T. P. 2002, ApJ, 565,511
- (21) Kaneda, H., Makishima, K., Yamauchi, S., Koyama, K., Matsuzaki, K. & Yamasaki, N. Y. 1997, ApJ, 491, 638
- (22) Koyama, K., Makishima, K., Tanaka, Y. , & Tsunemi, H. 1986, PASJ, 38, 121
- (23) Masai, K. 1984, Ap&SS, 98, 367
- (24) Masai, K., Dogiel, V.A., Inoue, H., Schönfelder, V. & Strong, A. W. 2002, ApJ, 581, 1071
- (25) Minter, A.H., Lockman, F. J., Langston, G. I. & Lockman, J. A. 2001, ApJ, 555, 868
- (26) Motch, C., Belloni, T., Buckley, D. et al. 1991, A&A, 246, L24
- (27) Mukai, K. & Shiokawa, K. 1993, ApJ, 418, 863
- (28) Muno, M. P. et al. 2003, ApJ, 589, 225
- (29) Muno, M. P. et al. 2004, ApJ, 613, 326
- (30) Murakami, H., Koyama, K. , & Maeda, Y. 2001, ApJ, 558, 687
- (31) Popov, S. B., Colpi, M. Prokhorov, M. E., Treves, A. & Turolla, R. 2000, ApJ, 544, L53
- (32) Predehl, P. & Schmitt, J. 1995, A&A, 293, 889
- (33) Sakano, M., Koyama, K., Murakami, H., Maeda, Y. & Yamauchi, S. 2002, ApJS, 138, 19
- (34) Skibo, J. G. et al. 1997, ApJ, 483, L95
- (35) Strong, A. W., Bouchet, L., Diehl, R., Mandrou, P., Schönfelder, V. & Teegarden, B. J. 2003, A&A, 411, L447
- (36) Sugizaki, M., Mitsuda, K., Kaneda, H., Matsuzaki, K., Yamauchi, S. & Koyama, K. 2001, ApJS, 134, 77
- (37) Tanaka, Y., Inoue, H. & Holt, S. S. 1994, PASJ, 46, L37
- (38) Tanaka, Y., Miyaji, T. & Hasinger G. 1999, Astron. Nachr., 320, 181
- (39) Tanaka, Y. 2002, A&A, 382, 1052
- (40) Tanaka, Y., Koyama, K., Maeda, Y. & Sonobe, T. 2000, PASJ, 52, L25
- (41) Tanuma, S., Yokoyama, T., Kudoh, T., Matsumoto, R., Shibata, K. & Makishima, K. 1999, PASJ, 51, 161
- (42) Tarenghi, M. & Wilson, R. N.; 1989, SPIE, 1114, 302
- (43) Townsley, L. K., Broos, P. S.,Chartas, G., Moskalenko, E., Nousek, J. A., & Pavlov, G. G. 2002a, Nuc. Instru. & Meth. 486, 716
- (44) Townsley, L. K., Broos, P. S., Nousek, J. A. & Garmire, G. P. 2002b, Nuc. Instru. & Meth., 486, 751
- (45) Ueda, Y. et al. 1999, ApJ, 518, 656
- (46) Ueno, M., Bamba, A., Koyama, K. & Ebisawa, K. 2003, ApJ, 588, 338
- (47) Valinia, A. & Marshall, F. E. 1998, ApJ, 505, 134
- (48) Valinia, A., Kinzer, R. L. & Marshall, F. E. 2000a, ApJ, 534, 277
- (49) Valinia, A. et al. 2000b, ApJ, 543, 733
- (50) Verbunt, F., Bunk, W. H., Ritter, H. & Pfeffermann, E. 1997, A&A, 327, 602
- (51) Vuong, M. H., Montmerle, T., Grosso, N., Feigelson, E. D., Verstraete, L. & Ozawa, H. 2003, A&A, 408, 581
- (52) Watson, M. G. 1999, in “Annapolis Workshop on Magnetic Cataclysmic Variables”, ASP conference series, vol. 157, p. 291
- (53) Warwick, R. S., Turner, M. J. L., Watson, M. G. & Willingale, R. 1985, Nature, 317, 218
- (54) Weisskopf, M. C., Brinkman, B., Canizares, C., Garmire, G., Murray, S. & Van Speybroeck, L. P. 2002, PASP, 114, 1
- (55) Worrall, D. M., Marshall, F. E., Boldt, E. A. & Swank, J. H. 1982, ApJ, 255, 111
- (56) Yamasaki, N. et al. 1997, ApJ, 481, 821
- (57) Yamauchi, S. & Koyama, K. 1993, ApJ, 404, 620
- (58) Yamauchi, S., Kaneda, H. Koyama, K., Makishima, K., Matsuzaki, K., Sonobe, T. Tanaka, Y. & Yamasaki, N. 1996, PASJ, 48, L15
- (59) Yamauchi, S. et al. 2002, in the Proceedings of the IAU 8th Asian-Pacific Regional Meeting, Volume II, Edited by S. Ikeuchi, J. Hearnshaw, & T. Hanawa, the Astronomical Society of Japan, p.81


| IDaaSources with in the ID column show significant time variations, and those with are extended. | AO | R.A. | Dec. | Error | Significance | Normalized counts | Hardness | Flux | NIR conterpart | ||||
|---|---|---|---|---|---|---|---|---|---|---|---|---|---|
| (hh:mm:ss.ss) | (d:mm:ss.s) | (arcsec) | () | (cnts/100ks) | (H-S)/(H+S) | (ergs s-1 cm-2) | IDbbSOFI ID in Table 1 (starts with S) and/or 2MASS ID (starts with J) of the NIR source within from the Chandra position. “No” means that the source is in the SOFI field of view, but there are no SOFI counterparts. “OoF” means that the source is out of the SOFI field, and no 2MASS counterparts. | seperation | cc2MASS magnitudes are taken for stars brighter than 10 mag, since SOFI starts to saturate for mag (see Fig. 5). | cc2MASS magnitudes are taken for stars brighter than 10 mag, since SOFI starts to saturate for mag (see Fig. 5). | cc2MASS magnitudes are taken for stars brighter than 10 mag, since SOFI starts to saturate for mag (see Fig. 5). | ||
| (J2000) | Total/Soft/Hard | Total/Soft/Hard | 0.5-2keV/2-10keV | (arcsec) | (mag) | (mag) | (mag) | ||||||
| 1 | 2 | 18:42:51.77 | 3 51 11.2 | 0.86 | 5.5/5.1/0.0 | 27.3/27.1/0.0 | -1.00 0.09 | 4.0E-16/1.6E-16 | OoF | ||||
| 2T | 2 | 18:42:53.53 | 49 19.6 | 0.93 | 6.9/3.6/6.3 | 67.7/21.3/48.8 | 0.39 0.12 | 3.5E-16/1.0E-14 | OoF | ||||
| 3 | 2 | 18:42:58.30 | 53 28.1 | 0.49 | 11.3/0.0/11.4 | 79.2/11.0/70.0 | 0.73 0.08 | 4.2E-17/3.1E-14 | J18425832-0353271 | 1.00 | 17.62 | 14.73 | 12.53 |
| 4T | 2 | 18:43:00.41 | 53 48.9 | 0.36 | 19.0/18.5/6.0 | 144.7/112.9/32.1 | -0.56 0.07 | 2.5E-15/1.0E-14 | J18430043-0353486 | 0.36 | 14.62 | 13.65 | 12.05 |
| 5 | 2 | 18:43:01.50 | 50 47.3 | 0.69 | 5.0/0.0/5.5 | 17.8/2.5/15.8 | 0.73 0.20 | 8.8E-18/6.4E-15 | OoF | ||||
| 6 | 2 | 18:43:01.83 | 54 42.4 | 0.48 | 7.4/6.7/2.0 | 45.9/29.8/16.3 | -0.29 0.15 | 9.5E-16/3.9E-15 | OoF | ||||
| 7 | 2 | 18:43:06.14 | 54 54.8 | 0.43 | 4.1/4.6/0.0 | 20.9/15.2/5.8 | -0.45 0.21 | 4.3E-16/1.8E-15 | OoF | ||||
| 8 | 2 | 18:43:06.88 | 55 37.0 | 0.35 | 8.1/6.0/4.0 | 30.1/17.0/13.2 | -0.12 0.19 | 2.1E-16/6.2E-15 | OoF | ||||
| 9 | 2 | 18:43:07.25 | 49 55.2 | 0.55 | 5.2/8.2/0.0 | 28.2/28.1/0.0 | -1.00 0.08 | 8.3E-16/3.4E-16 | OoF | ||||
| 10 | 2 | 18:43:07.27 | 48 58.4 | 0.75 | 4.1/0.0/4.0 | 16.8/0.0/17.2 | 1.00 0.13 | 1.1E-17/8.0E-15 | OoF | ||||
| 11 | 2 | 18:43:07.98 | 53 17.1 | 0.40 | 8.1/7.2/0.0 | 30.6/18.3/12.4 | -0.19 0.19 | 2.3E-16/6.8E-15 | No | ||||
| 12 | 2 | 18:43:08.73 | 50 01.8 | 0.53 | 4.6/3.5/2.4 | 10.7/6.3/5.7 | -0.06 0.32 | 4.0E-17/1.2E-15 | OoF | ||||
| 13 | 2 | 18:43:10.86 | 55 35.5 | 0.38 | 4.3/6.3/0.0 | 20.2/19.3/0.9 | -0.91 0.10 | 5.0E-16/2.0E-16 | No | ||||
| 14 | 2 | 18:43:11.41 | 59 50.1 | 0.46 | 8.1/7.6/1.8 | 39.9/28.9/10.9 | -0.45 0.15 | 7.2E-16/3.0E-15 | OoF | ||||
| 15 | 2 | 18:43:11.81 | 58 23.7 | 0.27 | 7.2/8.8/0.0 | 26.7/26.7/0.0 | -1.00 0.08 | 7.0E-16/2.8E-16 | OoF | ||||
| 16 | 2 | 18:43:12.15 | 48 16.2 | 0.72 | 3.6/6.0/0.0 | 21.1/19.7/1.3 | -0.88 0.15 | 7.2E-16/2.9E-16 | J18431219-0348167 | 0.93 | 15.28 | 14.62 | 13.84 |
| 17 | 2 | 18:43:12.42 | 57 36.8 | 0.49 | 4.3/4.0/0.0 | 15.6/13.0/2.6 | -0.66 0.22 | 3.8E-16/1.6E-15 | J18431239-0357363 | 0.61 | 16.00 | 14.01 | 13.04 |
| 18 | 2 | 18:43:12.87 | 50 42.0 | 0.55 | 4.6/4.9/0.0 | 14.8/14.8/0.0 | -1.00 0.15 | 4.8E-16/1.9E-16 | OoF | ||||
| 19 | 2 | 18:43:12.92 | 49 36.8 | 0.49 | 5.9/6.8/0.0 | 25.4/25.3/0.0 | -1.00 0.09 | 7.9E-16/3.2E-16 | J18431289-0349369 | 0.36 | 13.47 | 12.41 | 12.48 |
| 20 | 2 | 18:43:13.36 | 02 36.1 | 0.80 | 5.2/5.5/0.0 | 29.5/25.3/4.3 | -0.71 0.15 | 8.2E-16/3.4E-15 | OoF | ||||
| 21 | 2 | 18:43:13.77 | 57 07.4 | 0.35 | 6.4/6.9/0.0 | 20.1/20.0/0.1 | -0.99 0.11 | 5.9E-16/2.4E-16 | J18431378-0357073 | 0.28 | 13.66 | 13.07 | 12.73 |
| 22 | 2 | 18:43:14.45 | 52 11.5 | 0.32 | 4.2/4.3/0.0 | 12.7/12.7/0.0 | -1.00 0.17 | 2.6E-16/1.1E-16 | No | ||||
| 23 | 2 | 18:43:14.97 | 58 12.8 | 0.45 | 4.9/3.8/0.0 | 16.3/10.5/5.8 | -0.29 0.26 | 4.1E-16/1.7E-15 | OoF | ||||
| 24 | 2 | 18:43:15.29 | 54 19.5 | 0.17 | 9.1/9.7/0.0 | 24.1/24.2/0.1 | -0.99 0.08 | 6.9E-16/2.8E-16 | S687/J18431530-0354190 | 0.38 | 10.45 | 10.15 | 10.03 |
| 25 | 2 | 18:43:15.29 | 56 17.2 | 0.22 | 10.6/10.7/0.0 | 30.1/26.3/3.8 | -0.75 0.13 | 8.6E-16/3.6E-15 | No | ||||
| 26 | 2 | 18:43:15.40 | 50 49.1 | 0.34 | 4.5/5.0/0.0 | 13.9/12.9/1.0 | -0.86 0.15 | 6.1E-16/2.5E-16 | J18431539-0350483 | 0.74 | 14.43 | 13.93 | 13.72 |
| 27 | 2 | 18:43:15.54 | 47 58.5 | 0.67 | 4.7/0.0/4.9 | 21.4/4.7/15.9 | 0.55 0.21 | 1.3E-16/4.0E-15 | OoF | ||||
| 28 | 2 | 18:43:15.81 | 56 40.4 | 0.42 | 4.3/0.0/2.9 | 13.7/8.5/6.3 | -0.15 0.28 | 7.3E-17/2.2E-15 | OoF | ||||
| 29 | 2 | 18:43:17.43 | 56 00.2 | 0.22 | 5.9/3.9/2.8 | 13.0/7.6/5.5 | -0.16 0.30 | 1.3E-16/3.9E-15 | S1031/J18431748-0355597 | 0.90 | 12.48 | 12.10 | 11.96 |
| 30 | 2 | 18:43:17.43 | 57 32.7 | 0.23 | 7.0/7.4/0.0 | 19.8/19.1/0.7 | -0.92 0.11 | 5.5E-16/2.2E-16 | S1018 | 0.13 | 16.54 | 15.25 | 15.13 |
| 31 | 2 | 18:43:17.47 | 48 52.6 | 0.40 | 5.3/5.9/0.0 | 18.4/18.4/0.0 | -1.00 0.12 | 4.9E-16/2.0E-16 | S1038 | 0.63 | 16.06 | 15.78 | 15.54 |
| 32 | 2 | 18:43:17.97 | 47 14.9 | 0.82 | 3.6/4.5/0.0 | 19.6/19.5/0.0 | -1.00 0.12 | 4.5E-16/1.8E-16 | OoF | ||||
| 33 | 2 | 18:43:18.18 | 47 32.4 | 0.89 | 3.0/4.0/0.0 | 14.6/14.5/0.0 | -1.00 0.16 | 4.1E-16/1.7E-16 | OoF | ||||
| 34 | 2 | 18:43:18.41 | 00 54.9 | 0.77 | 3.6/4.1/0.0 | 9.7/9.7/0.0 | -1.00 0.23 | 4.2E-16/1.7E-16 | OoF | ||||
| 35 | 2 | 18:43:18.59 | 58 52.1 | 0.35 | 5.8/6.8/0.0 | 19.5/19.5/0.0 | -1.00 0.11 | 4.6E-16/1.9E-16 | S1360 | 0.36 | 15.86 | 15.08 | 14.77 |
| 36 | 2 | 18:43:18.73 | 54 25.2 | 0.20 | 5.1/3.3/0.0 | 11.0/6.7/4.4 | -0.20 0.31 | 7.3E-17/2.2E-15 | S1398 | 0.22 | 17.07 | 16.21 | |
| 37 | 2 | 18:43:18.95 | 53 27.3 | 0.24 | 4.4/4.2/0.0 | 12.8/11.6/1.2 | -0.81 0.21 | 4.3E-16/1.7E-16 | S1479 | 0.74 | 14.98 | 14.42 | 14.24 |
| 38 | 2 | 18:43:19.01 | 59 33.4 | 0.38 | 8.8/0.0/8.6 | 33.9/6.4/27.4 | 0.62 0.14 | 1.8E-17/1.3E-14 | No | ||||
| 39 | 2 | 18:43:19.22 | 57 31.9 | 0.28 | 4.7/4.8/0.0 | 13.0/11.3/1.7 | -0.74 0.21 | 3.4E-16/1.4E-15 | S1544 | 0.73 | 15.24 | ||
| 40 | 2 | 18:43:19.47 | 01 36.9 | 0.73 | 3.3/5.1/0.0 | 19.1/19.1/0.0 | -1.00 0.12 | 5.5E-16/2.2E-16 | OoF | ||||
| 41 | 2 | 18:43:19.61 | 55 02.1 | 0.25 | 3.8/4.2/0.0 | 8.9/8.6/0.3 | -0.93 0.22 | 2.3E-16/9.2E-17 | S1652 | 0.81 | 16.44 | 15.53 | |
| 42 | 2 | 18:43:20.55 | 48 59.9 | 0.24 | 8.1/0.0/8.7 | 26.3/0.0/26.3 | 1.00 0.08 | 2.1E-17/1.5E-14 | No | ||||
| 43 | 2 | 18:43:20.56 | 49 03.3 | 0.31 | 9.1/0.0/10.1 | 35.2/0.0/35.3 | 1.00 0.06 | 2.0E-17/1.5E-14 | No | ||||
| 44 | 2 | 18:43:20.86 | 52 46.5 | 0.11 | 20.6/8.3/14.9 | 50.2/17.6/32.7 | 0.30 0.14 | 3.5E-16/1.1E-14 | No | ||||
| 45 | 2 | 18:43:21.10 | 52 15.0 | 0.16 | 4.7/0.0/4.7 | 9.4/0.6/8.6 | 0.87 0.21 | 4.7E-18/3.4E-15 | No | ||||
| 46 | 2 | 18:43:21.11 | 54 30.0 | 0.20 | 5.0/0.0/4.2 | 10.0/1.5/8.4 | 0.69 0.26 | 6.4E-18/4.6E-15 | S2107 | 0.21 | 14.60 | ||
| 47 | 2 | 18:43:21.22 | 49 31.2 | 0.37 | 9.0/11.5/0.0 | 42.8/37.6/5.1 | -0.76 0.10 | 9.6E-16/4.0E-15 | S2159/J18432128-0349314 | 0.97 | 14.74 | 13.87 | 12.85 |
| 48 | 2 | 18:43:21.37 | 01 02.9 | 0.27 | 26.1/12.0/22.0 | 184.7/52.7/131.9 | 0.43 0.07 | 1.1E-15/3.4E-14 | OoF | ||||
| 49 | 2 | 18:43:21.62 | 55 28.0 | 0.23 | 4.5/4.8/0.0 | 9.8/9.7/0.0 | -1.00 0.22 | 5.0E-16/2.0E-16 | S2284 | 0.24 | 14.03 | 14.62 | |
| 50 | 2 | 18:43:21.76 | 00 39.6 | 0.53 | 4.9/5.7/0.0 | 18.4/17.9/0.5 | -0.94 0.12 | 6.1E-16/2.5E-16 | J18432180-0400395 | 0.73 | 14.88 | 14.24 | 13.93 |
| 51 | 2 | 18:43:21.81 | 53 03.3 | 0.19 | 8.3/8.0/0.0 | 18.7/16.5/2.2 | -0.77 0.17 | 4.0E-16/1.7E-15 | S2354/18432182-0353031 | 0.24 | 13.94 | 13.49 | 13.29 |
| 52 | 2 | 18:43:22.09 | 54 26.4 | 0.17 | 7.4/7.5/0.0 | 16.1/14.7/1.4 | -0.83 0.17 | 6.1E-16/2.5E-16 | S2458 | 0.34 | 16.20 | 15.28 | 15.33 |
| 53 | 2 | 18:43:22.82 | 52 28.6 | 0.24 | 4.4/0.0/2.8 | 10.6/1.3/9.1 | 0.75 0.25 | 6.2E-18/4.5E-15 | No | ||||
| 54 | 2 | 18:43:22.98 | 57 53.0 | 0.19 | 7.5/7.7/0.0 | 17.8/16.8/0.9 | -0.89 0.11 | 6.0E-16/2.4E-16 | S2739/J18432299-0357526 | 0.47 | 13.92 | 13.48 | 13.25 |
| 55 | 2 | 18:43:23.03 | 57 25.3 | 0.26 | 5.2/5.0/0.0 | 11.9/9.6/2.2 | -0.63 0.27 | 3.0E-16/1.2E-15 | S2749 | 0.66 | 17.00 | 15.77 | 15.17 |
| 56 | 2 | 18:43:23.30 | 48 51.7 | 0.31 | 15.3/17.2/0.0 | 64.1/64.1/0.0 | -1.00 0.03 | 2.9E-15/1.2E-15 | S2844/J18432331-0348521 | 0.47 | 14.78 | 14.09 | 13.81 |
| 57 | 2 | 18:43:23.39 | 58 05.1 | 0.21 | 9.6/10.9/0.0 | 27.1/25.3/1.9 | -0.86 0.11 | 8.1E-16/3.3E-16 | S2871/J18432340-0358050 | 0.19 | 13.26 | 12.23 | 11.82 |
| 58 | 2 | 18:43:23.62 | 53 14.1 | 0.21 | 4.6/3.4/0.0 | 10.9/7.5/3.3 | -0.39 0.30 | 2.5E-16/1.0E-15 | S2932/J18432360-0353138 | 0.13 | 15.57 | 14.57 | 14.38 |
| 59 | 2 | 18:43:23.68 | 51 40.6 | 0.23 | 6.6/6.0/0.0 | 14.4/13.4/1.0 | -0.86 0.19 | 5.2E-16/2.1E-16 | S2956 | 0.09 | 15.71 | 14.97 | 14.69 |
| 60 | 2 | 18:43:23.72 | 00 26.0 | 0.42 | 8.5/5.4/3.1 | 40.9/28.4/11.4 | -0.43 0.15 | 7.5E-16/3.1E-15 | OoF | ||||
| 61 | 2 | 18:43:23.89 | 53 31.4 | 0.18 | 5.4/2.8/4.6 | 17.4/6.2/10.8 | 0.27 0.25 | 1.1E-16/3.4E-15 | No | ||||
| 62T | 2 | 18:43:23.96 | 57 58.9 | 0.18 | 13.2/10.7/5.2 | 39.0/27.0/12.0 | -0.38 0.15 | 8.7E-16/3.6E-15 | S3040 | 0.65 | 16.87 | 15.96 | 15.31 |
| 63 | 2 | 18:43:24.33 | 03 38.5 | 1.09 | 0.0/4.3/0.0 | 21.5/21.5/0.0 | -1.00 0.11 | 2.2E-16/8.7E-17 | OoF | ||||
| 64 | 2 | 18:43:24.47 | 53 49.8 | 0.06 | 42.1/39.3/9.0 | 101.2/84.3/16.7 | -0.67 0.07 | 2.2E-15/9.1E-15 | S3203/J18432446-0353495 | 0.05 | 13.72 | 12.64 | 12.21 |
| 65 | 2 | 18:43:24.81 | 59 16.2 | 0.34 | 5.6/5.6/0.0 | 16.7/16.0/0.7 | -0.91 0.12 | 5.8E-16/2.4E-16 | S3312 | 0.47 | 16.37 | 15.36 | 14.77 |
| 66 | 2 | 18:43:25.04 | 57 51.0 | 0.22 | 6.5/6.9/0.0 | 17.3/16.6/0.7 | -0.92 0.12 | 6.2E-16/2.5E-16 | S3394/J18432504-0357511 | 0.17 | 15.22 | 14.45 | 14.13 |
| 67 | 2 | 18:43:25.25 | 59 15.3 | 0.30 | 6.6/6.4/0.0 | 23.6/18.3/5.3 | -0.55 0.19 | 6.1E-16/2.5E-15 | S3450/J18432523-0359150 | 0.55 | 15.96 | 15.23 | 14.88 |
| 68 | 2 | 18:43:26.14 | 56 49.7 | 0.14 | 11.2/9.4/2.3 | 26.4/19.9/6.4 | -0.51 0.18 | 7.1E-16/2.9E-15 | S3833 | 0.42 | 16.51 | 15.61 | 15.21 |
| 69 | 2 | 18:43:26.41 | 57 05.9 | 0.17 | 4.0/0.0/4.2 | 9.9/0.0/9.8 | 1.00 0.21 | 6.5E-18/4.7E-15 | No | ||||
| 70 | 1 | 18:43:28.34 | 07 33.2 | 0.31 | 21.3/25.4/0.0 | 175.1/169.0/6.0 | -0.93 0.03 | 4.2E-15/1.7E-15 | J18432835-0407331 | 0.26 | 9.06 | 8.69 | 8.54 |
| 71 | 2 | 18:43:28.35 | 46 18.2 | 0.76 | 4.0/3.8/0.0 | 17.4/17.4/0.0 | -1.00 0.13 | 6.6E-16/2.7E-16 | OoF | ||||
| 72 | 2 | 18:43:28.67 | 56 22.8 | 0.15 | 4.0/3.4/0.0 | 8.4/6.8/1.6 | -0.62 0.30 | 1.8E-16/7.2E-16 | S4885 | 0.27 | 17.29 | 14.81 | 14.70 |
| 73 | 2 | 18:43:28.91 | 57 33.3 | 0.12 | 10.8/10.6/0.0 | 22.7/20.2/2.5 | -0.78 0.14 | 5.1E-16/2.1E-15 | S4992/J18432891-0357332 | 0.04 | 14.41 | 13.50 | 13.16 |
| 74 | 2 | 18:43:29.11 | 59 42.3 | 0.39 | 4.3/0.0/2.5 | 14.8/5.4/9.3 | 0.26 0.27 | 8.2E-17/2.5E-15 | S5111 | 0.69 | 17.85 | 15.39 | 15.76 |
| 75 | 2 | 18:43:29.26 | 50 50.9 | 0.25 | 6.7/7.1/0.0 | 16.4/15.7/0.8 | -0.90 0.12 | 4.7E-16/1.9E-16 | S5148/J18432926-0350504 | 0.16 | 14.90 | 14.12 | 13.82 |
| 76 | 2 | 18:43:29.32 | 56 48.7 | 0.15 | 8.9/0.0/9.3 | 22.1/0.5/21.5 | 0.95 0.09 | 1.5E-17/1.1E-14 | No | ||||
| 77 | 1 | 18:43:29.33 | 05 19.4 | 0.48 | 3.9/5.3/0.0 | 23.3/23.2/0.0 | -1.00 0.11 | 9.2E-16/3.7E-16 | J18432934-0405185 | 0.84 | 13.78 | 13.28 | 13.14 |
| 78 | 2 | 18:43:29.55 | 46 56.5 | 0.52 | 3.8/0.0/4.0 | 18.4/0.7/17.7 | 0.93 0.12 | 1.1E-17/7.7E-15 | OoF | ||||
| 79 | 2 | 18:43:29.70 | 50 15.1 | 0.31 | 5.5/0.0/2.6 | 20.1/2.8/16.7 | 0.71 0.17 | 1.2E-17/8.4E-15 | S5359 | 0.30 | 12.90 | ||
| 80 | 2 | 18:43:30.20 | 51 18.2 | 0.21 | 4.5/4.0/0.0 | 9.2/7.8/1.4 | -0.70 0.28 | 2.8E-16/1.1E-15 | No | ||||
| 81 | 2 | 18:43:30.21 | 53 44.3 | 0.17 | 4.2/4.7/0.0 | 9.9/9.5/0.5 | -0.90 0.19 | 3.4E-16/1.4E-16 | S5569/J18433019-0353440 | 0.33 | 15.37 | 14.73 | 14.50 |
| 82 | 2 | 18:43:30.27 | 54 11.4 | 0.05 | 49.2/42.1/10.7 | 103.5/82.4/20.9 | -0.60 0.08 | 3.7E-15/1.5E-14 | S5602/J18433026-0354110 | 0.39 | 13.11 | 12.07 | 11.67 |
| 83 | 1/2 | 18:43:30.35 | 59 43.3 | 0.43 | 0.0/5.0/0.0 | 15.8/15.8/0.0 | -1.00 0.11 | 3.5E-16/1.4E-16 | No | ||||
| 84T | 1 | 18:43:30.52 | 03 50.3 | 0.48 | 6.4/6.0/0.0 | 33.1/25.5/7.8 | -0.53 0.17 | 7.3E-16/3.0E-15 | No | ||||
| 85 | 2 | 18:43:30.63 | 53 52.0 | 0.14 | 5.4/5.8/0.0 | 10.5/10.5/0.0 | -1.00 0.18 | 3.5E-16/1.4E-16 | S5758/J18433062-0353515 | 0.29 | 11.93 | 11.26 | 11.00 |
| 86T | 1/2 | 18:43:30.75 | 01 02.5 | 0.26 | 16.5/20.5/0.0 | 75.8/74.2/0.9 | -0.970.03 | 2.2E-15/9.0E-16 | S5825/J18433077-0401025 | 0.41 | 9.67bbSOFI ID in Table 1 (starts with S) and/or 2MASS ID (starts with J) of the NIR source within from the Chandra position. “No” means that the source is in the SOFI field of view, but there are no SOFI counterparts. “OoF” means that the source is out of the SOFI field, and no 2MASS counterparts. | 9.40bbSOFI ID in Table 1 (starts with S) and/or 2MASS ID (starts with J) of the NIR source within from the Chandra position. “No” means that the source is in the SOFI field of view, but there are no SOFI counterparts. “OoF” means that the source is out of the SOFI field, and no 2MASS counterparts. | 9.27bbSOFI ID in Table 1 (starts with S) and/or 2MASS ID (starts with J) of the NIR source within from the Chandra position. “No” means that the source is in the SOFI field of view, but there are no SOFI counterparts. “OoF” means that the source is out of the SOFI field, and no 2MASS counterparts. |
| 87 | 1 | 18:43:30.80 | 00 45.9 | 0.65 | 4.3/4.5/0.0 | 19.0/18.9/0.0 | -1.00 0.13 | 5.6E-16/2.3E-16 | S5840/J18433081-0400459 | 0.35 | 15.51 | 14.83 | |
| 88 | 2 | 18:43:31.28 | 50 29.1 | 0.23 | 12.6/2.8/9.3 | 37.7/11.8/25.1 | 0.36 0.16 | 2.4E-16/7.2E-15 | No | ||||
| 89 | 2 | 18:43:31.30 | 46 18.0 | 0.70 | 6.4/7.6/0.0 | 34.6/34.8/-0.0 | -1.00 0.07 | 9.5E-16/3.8E-16 | OoF | ||||
| 90 | 2 | 18:43:31.47 | 55 15.8 | 0.23 | 4.9/2.9/0.0 | 10.0/5.6/4.5 | -0.11 0.33 | 2.2E-17/6.7E-16 | S6146 | 0.48 | 16.98 | 15.82 | 15.53 |
| 91 | 1/2 | 18:43:31.59 | 56 49.4 | 0.11 | 14.9/14.0/2.4 | 32.0/25.9/6.0 | -0.62 0.11 | 5.5E-16/2.3E-15 | S6217/J18433157-0356492 | 0.18 | 14.23 | 13.53 | 13.30 |
| 92 | 2 | 18:43:31.68 | 48 39.3 | 0.45 | 4.3/4.5/0.0 | 16.8/16.8/0.0 | -1.00 0.13 | 5.3E-16/2.1E-16 | S6289/J18433170-0348390 | 0.56 | 12.40 | 11.94 | 11.77 |
| 93 | 2 | 18:43:31.72 | 59 56.1 | 0.48 | 4.0/0.0/2.7 | 10.9/5.7/5.2 | -0.05 0.32 | 5.0E-17/1.5E-15 | No | ||||
| 94 | 2 | 18:43:31.75 | 51 26.7 | 0.15 | 10.7/9.3/1.9 | 26.1/19.9/6.1 | -0.53 0.17 | 5.7E-16/2.4E-15 | S6293/J18433170-0351268 | 0.55 | 15.21 | 14.20 | 13.41 |
| 95 | 2 | 18:43:31.76 | 57 39.3 | 0.15 | 13.2/3.7/11.0 | 34.0/8.3/25.7 | 0.51 0.16 | 2.4E-16/7.1E-15 | No | ||||
| 96 | 2 | 18:43:31.78 | 57 17.2 | 0.20 | 4.3/3.8/0.0 | 9.5/7.9/1.6 | -0.66 0.27 | 1.7E-16/6.9E-16 | S6318 | 0.07 | 15.47 | 15.63 | 13.93 |
| 97 | 2 | 18:43:32.27 | 54 44.7 | 0.16 | 6.9/6.2/0.0 | 16.0/14.6/1.5 | -0.81 0.17 | 4.5E-16/1.8E-16 | No | ||||
| 98 | 1/2 | 18:43:32.41 | 00 50.4 | 0.39 | 5.2/5.7/0.0 | 14.0/12.9/1.2 | -0.85 0.18 | 3.9E-16/1.6E-16 | S6584/J18433236-0400507 | 0.70 | 15.78 | 15.04 | |
| 99 | 1 | 18:43:32.47 | 08 49.7 | 0.51 | 9.9/0.0/10.1 | 77.3/13.0/64.7 | 0.67 0.10 | 3.4E-17/2.5E-14 | OoF | ||||
| 100 | 1 | 18:43:32.58 | 04 18.7 | 0.21 | 31.3/19.7/23.9 | 222.8/99.3/125.0 | 0.11 0.07 | 1.6E-15/4.7E-14 | J18433257-0404190 | 0.32 | 15.14 | 12.55 | 11.14 |
| 101 | 2 | 18:43:32.67 | 49 07.6 | 0.37 | 4.5/0.0/5.1 | 16.0/0.0/15.7 | 1.00 0.14 | 8.1E-18/5.9E-15 | No | ||||
| 102 | 2 | 18:43:33.36 | 54 36.0 | 0.17 | 4.6/3.9/0.0 | 9.3/7.7/1.6 | -0.66 0.27 | 2.4E-16/9.8E-16 | S7035 | 0.05 | 16.53 | 15.47 | 15.01 |
| 103 | 2 | 18:43:33.41 | 50 19.5 | 0.20 | 11.2/11.6/1.8 | 32.7/30.2/2.6 | -0.840.10 | 7.0E-16/2.8E-16 | S7055/J18433338-0350200 | 0.58 | 15.24 | 14.15 | 13.52 |
| 104 | 1 | 18:43:33.47 | 03 54.3 | 0.51 | 3.6/4.5/0.0 | 25.2/17.5/7.8 | -0.38 0.21 | 6.3E-16/2.6E-15 | J18433350-0403541 | 0.52 | 11.62 | 10.71 | 10.35 |
| 105 | 2 | 18:43:33.94 | 52 53.0 | 0.12 | 4.7/0.0/3.9 | 6.5/0.7/5.5 | 0.77 0.30 | 4.5E-18/3.3E-15 | S7294/J18433392-0352529 | 0.08 | 14.89 | 13.09 | |
| 106 | 2 | 18:43:34.12 | 55 23.8 | 0.15 | 7.0/7.2/0.0 | 13.6/13.6/0.0 | -1.00 0.15 | 2.8E-16/1.1E-16 | S7436 | 0.45 | 15.25 | 14.47 | 14.10 |
| 107 | 2 | 18:43:34.13 | 50 47.5 | 0.32 | 3.7/4.3/0.0 | 9.0/8.2/0.8 | -0.82 0.21 | 2.3E-16/9.3E-17 | S7413 | 0.24 | 16.95 | 16.15 | |
| 108 | 1 | 18:43:34.63 | 10 32.2 | 0.92 | 3.8/0.0/5.0 | 24.2/7.0/17.3 | 0.43 0.21 | 1.3E-16/3.8E-15 | OoF | ||||
| 109 | 2 | 18:43:34.79 | 46 04.2 | 0.70 | 4.4/4.5/0.0 | 28.5/26.8/1.7 | -0.88 0.11 | 8.6E-16/3.5E-16 | OoF | ||||
| 110 | 1/2 | 18:43:35.33 | 00 44.7 | 0.35 | 7.1/7.4/0.0 | 20.3/16.7/3.7 | -0.66 0.13 | 5.0E-16/2.1E-15 | S8090/J18433529-0400448 | 0.48 | 15.61 | 14.66 | 14.44 |
| 111 | 2 | 18:43:35.38 | 55 56.6 | 0.13 | 4.1/4.4/0.0 | 8.5/8.7/-0.3 | -1.00 0.03 | 2.4E-16/9.6E-17 | S8139 | 0.32 | 16.63 | 16.96 | |
| 112 | 2 | 18:43:35.41 | 57 14.8 | 0.25 | 4.9/5.0/0.0 | 10.7/10.5/0.2 | -0.96 0.19 | 2.5E-16/1.0E-16 | S8164 | 0.08 | 16.42 | 15.38 | 14.93 |
| 113 | 1/2 | 18:43:35.45 | 01 12.7 | 0.34 | 10.1/1.9/7.9 | 34.5/9.2/25.6 | 0.53 0.10 | 1.8E-16/5.4E-15 | S8192 | 0.35 | 16.40 | 15.69 | 13.51 |
| 114 | 2 | 18:43:35.48 | 58 46.1 | 0.29 | 4.6/3.1/3.3 | 17.3/9.3/8.0 | -0.07 0.25 | 6.4E-17/1.9E-15 | S8194/J18433545-0358456 | 0.27 | 14.74 | 14.01 | 13.68 |
| 115 | 2 | 18:43:35.59 | 46 00.8 | 0.58 | 6.2/6.0/0.0 | 60.7/51.5/9.3 | -0.69 0.10 | 1.2E-15/5.0E-15 | OoF | ||||
| 116 | 2 | 18:43:35.82 | 58 54.4 | 0.29 | 4.9/4.6/0.0 | 13.1/11.4/1.9 | -0.72 0.20 | 1.5E-16/6.1E-16 | S8433/J18433584-0358539 | 0.68 | 14.35 | 13.66 | 13.34 |
| 117 | 2 | 18:43:35.84 | 46 52.7 | 0.33 | 20.1/9.5/17.5 | 143.1/39.9/103.1 | 0.44 0.08 | 8.9E-16/2.7E-14 | OoF | ||||
| 118 | 2 | 18:43:35.89 | 57 58.7 | 0.24 | 6.1/6.5/0.0 | 14.8/14.6/0.1 | -0.99 0.14 | 2.5E-16/1.0E-16 | S8454/J18433588-0357587 | 0.10 | 15.77 | 14.87 | 14.49 |
| 119 | 1/2 | 18:43:36.18 | 01 54.2 | 0.38 | 5.6/6.3/0.0 | 12.1/12.1/0.0 | -1.00 0.16 | 4.2E-16/1.7E-16 | S8621 | 0.94 | 16.09 | 15.59 | |
| 120 | 2 | 18:43:36.39 | 55 50.1 | 0.13 | 5.1/0.0/6.0 | 9.6/0.0/9.5 | 1.00 0.21 | 5.9E-18/4.3E-15 | No | ||||
| 121 | 2 | 18:43:36.43 | 55 53.7 | 0.15 | 5.5/1.5/4.8 | 12.3/2.7/9.5 | 0.56 0.25 | 1.6E-16/4.8E-15 | No | ||||
| 122 | 1/2 | 18:43:36.74 | 57 47.9 | 0.21 | 7.6/7.8/0.0 | 21.8/19.1/2.6 | -0.82 0.11 | 5.2E-16/2.1E-16 | S8957/J18433676-0357478 | 0.32 | 15.52 | 14.71 | 14.38 |
| 123 | 2 | 18:43:36.85 | 54 29.4 | 0.19 | 6.6/6.9/0.0 | 14.5/14.3/0.3 | -0.96 0.13 | 4.1E-16/1.7E-16 | S9010 | 0.27 | 16.65 | 15.09 | 16.12 |
| 124 | 1 | 18:43:37.01 | 02 34.5 | 0.45 | 4.3/2.9/0.0 | 15.1/13.0/2.2 | -0.71 0.21 | 1.9E-16/7.7E-16 | No | ||||
| 125 | 2 | 18:43:37.67 | 57 44.4 | 0.28 | 3.8/4.4/0.0 | 9.5/9.5/0.0 | -1.00 0.21 | 3.1E-16/1.2E-16 | S9480/J18433767-0357442 | 0.29 | 11.92 | 11.25 | 11.02 |
| 126T | 1 | 18:43:37.87 | 03 53.2 | 0.25 | 16.6/4.7/14.6 | 75.7/21.8/55.1 | 0.43 0.11 | 5.8E-16/1.8E-14 | No | ||||
| 127 | 1 | 18:43:38.17 | 09 46.9 | 0.37 | 10.8/12.6/0.0 | 51.1/48.9/2.3 | -0.910.07 | 1.8E-15/7.1E-16 | J18433817-0409465 | 0.39 | 14.43 | 12.65 | 11.81 |
| 128 | 2 | 18:43:38.28 | 52 01.1 | 0.18 | 4.8/5.6/0.0 | 9.6/9.7/0.0 | -1.00 0.20 | 4.2E-16/1.7E-16 | S9809/J18433826-0352012 | 0.30 | 15.73 | 14.74 | 14.32 |
| 129 | 1 | 18:43:38.59 | 05 58.7 | 0.37 | 4.8/5.1/0.0 | 19.2/15.6/3.7 | -0.62 0.22 | 5.5E-16/2.3E-15 | No | ||||
| 130 | 2 | 18:43:38.63 | 57 32.7 | 0.19 | 7.9/7.9/0.0 | 19.0/17.7/1.3 | -0.86 0.14 | 3.0E-16/1.2E-16 | S10021 | 0.38 | 16.06 | 15.13 | 14.84 |
| 131T | 2 | 18:43:38.73 | 48 34.4 | 0.35 | 6.1/3.4/4.9 | 38.5/24.5/13.9 | -0.28 0.16 | 5.7E-16/2.4E-15 | No | ||||
| 132 | 2 | 18:43:39.02 | 54 44.0 | 0.14 | 6.3/6.6/0.0 | 13.0/12.5/0.6 | -0.91 0.14 | 3.6E-16/1.4E-16 | S10269 | 0.19 | 17.09 | ||
| 133 | 2 | 18:43:39.04 | 52 45.9 | 0.06 | 57.2/56.8/5.8 | 159.0/138.6/20.5 | -0.74 0.05 | 2.9E-15/1.2E-14 | S10275/J18433902-0352459 | 0.25 | 13.16 | 12.21 | 11.88 |
| 134 | 2 | 18:43:39.04 | 52 13.6 | 0.16 | 7.7/8.5/0.0 | 18.1/17.8/0.4 | -0.96 0.11 | 6.9E-16/2.8E-16 | S10271/J18433901-0352138 | 0.45 | 12.51 | 12.01 | 11.88 |
| 135 | 2 | 18:43:39.26 | 52 52.5 | 0.14 | 12.0/13.1/0.0 | 28.6/28.6/0.2 | -0.99 0.07 | 9.7E-16/3.9E-16 | S10406/J18433923-0352523 | 0.41 | 10.38 | 10.21 | 9.85bbSOFI ID in Table 1 (starts with S) and/or 2MASS ID (starts with J) of the NIR source within from the Chandra position. “No” means that the source is in the SOFI field of view, but there are no SOFI counterparts. “OoF” means that the source is out of the SOFI field, and no 2MASS counterparts. |
| 136 | 1 | 18:43:39.26 | 07 02.5 | 0.46 | 4.7/0.0/3.8 | 16.6/2.5/14.1 | 0.70 0.22 | 1.0E-17/7.5E-15 | No | ||||
| 137 | 2 | 18:43:39.38 | 49 53.7 | 0.17 | 30.1/2.1/34.0 | 146.5/7.8/135.7 | 0.89 0.04 | 7.3E-17/5.3E-14 | No | ||||
| 138 | 1 | 18:43:39.51 | 05 14.2 | 0.22 | 15.8/2.0/15.7 | 62.0/9.4/52.8 | 0.70 0.10 | 3.5E-17/2.6E-14 | No | ||||
| 139 | 2 | 18:43:39.76 | 54 08.8 | 0.15 | 8.2/8.8/0.0 | 20.6/19.4/1.3 | -0.87 0.12 | 6.3E-16/2.5E-16 | S10699 | 0.42 | 16.24 | 15.36 | 15.04 |
| 140 | 2 | 18:43:40.34 | 51 54.3 | 0.22 | 4.7/4.6/0.0 | 12.9/10.7/2.3 | -0.65 0.24 | 2.8E-16/1.1E-15 | S11045/J18434031-0351544 | 0.11 | 14.41 | 14.60 | 14.36 |
| 141 | 1 | 18:43:40.60 | 03 42.1 | 0.36 | 6.8/5.2/1.3 | 20.4/13.8/6.8 | -0.34 0.23 | 3.2E-16/1.3E-15 | No | ||||
| 142 | 2 | 18:43:40.95 | 49 54.9 | 0.42 | 2.7/4.1/0.0 | 10.9/10.9/0.1 | -0.98 0.19 | 2.8E-16/1.2E-16 | No | ||||
| 143 | 1/2 | 18:43:41.02 | 58 02.3 | 0.32 | 3.9/4.3/0.0 | 16.8/14.2/2.6 | -0.80 0.18 | 3.7E-16/1.5E-15 | S11475/J18434103-0358024 | 0.27 | 12.20 | 11.18 | 10.73 |
| 144 | 1/2 | 18:43:41.13 | 57 40.6 | 0.11 | 36.9/32.7/9.4 | 62.4/55.2/7.8 | -0.73 0.08 | 1.6E-15/6.6E-15 | S11523/J18434111-0357404 | 0.19 | 12.92 | 12.10 | 11.77 |
| 145 | 2 | 18:43:41.51 | 50 55.0 | 0.27 | 4.5/0.0/2.5 | 11.4/5.3/6.1 | 0.07 0.32 | 9.7E-17/2.9E-15 | No | ||||
| 146 | 1 | 18:43:41.81 | 11 18.6 | 0.53 | 4.0/0.0/5.1 | 16.7/0.0/16.9 | 1.00 0.15 | 1.1E-17/7.9E-15 | OoF | ||||
| 147 | 2 | 18:43:42.17 | 57 59.0 | 0.22 | 6.3/6.2/0.0 | 16.9/14.8/1.2 | -0.85 0.17 | 2.7E-16/1.1E-16 | S12123 | 0.40 | 15.35 | 14.59 | 14.30 |
| 148 | 2 | 18:43:42.37 | 55 07.4 | 0.15 | 6.0/5.9/0.0 | 12.1/11.6/0.6 | -0.91 0.15 | 3.4E-16/1.4E-16 | S12222 | 0.24 | 17.84 | 16.60 | 16.11 |
| 149 | 1/2 | 18:43:42.57 | 59 41.1 | 0.26 | 6.0/5.8/0.0 | 18.0/11.8/6.2 | -0.32 0.17 | 4.0E-16/1.6E-15 | S12331 | 0.70 | 15.46 | 14.64 | 14.45 |
| 150 | 2 | 18:43:42.73 | 54 24.7 | 0.16 | 9.3/8.7/0.0 | 22.5/18.3/4.0 | -0.64 0.17 | 5.1E-16/2.1E-15 | S12469 | 0.21 | 17.76 | 15.88 | 15.61 |
| 151 | 2 | 18:43:43.26 | 51 56.9 | 0.22 | 12.6/0.0/13.3 | 47.9/5.1/41.7 | 0.78 0.10 | 2.6E-17/1.9E-14 | No | ||||
| 152 | 1 | 18:43:43.42 | 04 51.1 | 0.27 | 3.7/4.1/0.0 | 9.9/9.9/0.0 | -1.00 0.23 | 3.6E-16/1.5E-16 | No | ||||
| 153 | 2 | 18:43:43.80 | 47 33.2 | 0.48 | 6.7/7.1/0.0 | 44.6/36.6/6.9 | -0.68 0.12 | 1.0E-15/4.2E-15 | OoF | ||||
| 154 | 1 | 18:43:45.01 | 03 34.5 | 0.26 | 4.8/4.6/0.0 | 11.9/10.6/1.4 | -0.77 0.25 | 4.8E-16/2.0E-15 | S14192 | 0.65 | 15.87 | ||
| 155 | 1 | 18:43:45.04 | 05 01.6 | 0.16 | 17.2/17.6/2.7 | 52.9/44.8/8.1 | -0.69 0.11 | 1.1E-15/4.5E-15 | S14243/J18434503-0405015 | 0.17 | 13.54 | 13.11 | |
| 156 | 2 | 18:43:45.35 | 53 16.7 | 0.25 | 4.6/3.8/0.0 | 17.0/11.2/5.8 | -0.32 0.24 | 3.9E-16/1.6E-15 | S14512/J18434537-0353163 | 0.60 | 14.67 | 14.02 | 13.75 |
| 157 | 1 | 18:43:45.87 | 07 39.6 | 0.32 | 4.5/5.1/0.0 | 14.1/13.4/0.7 | -0.90 0.16 | 2.2E-16/8.7E-17 | S14852/J18434586-0407387 | 0.83 | 15.33 | 14.44 | |
| 158 | 2 | 18:43:46.06 | 53 51.8 | 0.17 | 5.7/6.6/0.0 | 16.0/15.7/0.4 | -0.950.12 | 4.5E-16/1.8E-16 | S15011/J18434607-0353521 | 0.12 | 15.75 | 14.74 | 14.44 |
| 159 | 1 | 18:43:46.08 | 03 24.6 | 0.21 | 4.0/4.6/0.0 | 8.6/8.6/0.0 | -1.00 0.26 | 2.2E-16/9.0E-17 | S15029/J18434610-0403248 | 0.38 | 14.51 | 13.91 | 13.63 |
| 160 | 1 | 18:43:46.08 | 05 48.7 | 0.23 | 5.8/6.2/0.0 | 15.5/15.2/0.3 | -0.96 0.14 | 4.7E-16/1.9E-16 | S15003/J18434605-0405488 | 0.49 | 14.07 | 13.30 | 13.04 |
| 161 | 2 | 18:43:46.43 | 54 11.6 | 0.23 | 5.1/6.2/0.0 | 13.3/13.4/0.0 | -1.00 0.15 | 4.9E-16/2.0E-16 | S15282/J18434644-0354117 | 0.33 | 14.21 | 13.53 | 13.36 |
| 162 | 1 | 18:43:46.62 | 04 30.1 | 0.11 | 22.9/0.0/25.3 | 67.8/1.4/66.4 | 0.96 0.05 | 3.8E-17/2.8E-14 | No | ||||
| 163 | 2 | 18:43:46.66 | 46 23.8 | 0.78 | 3.8/5.6/0.0 | 24.8/24.7/0.0 | -1.00 0.09 | 8.8E-16/3.6E-16 | OoF | ||||
| 164 | 2 | 18:43:46.72 | 54 43.5 | 0.21 | 4.5/3.7/0.0 | 10.1/7.6/2.5 | -0.51 0.29 | 2.0E-16/8.1E-16 | S15492/J18434671-0354434 | 0.06 | 15.42 | 14.14 | 13.38 |
| 165T | 1 | 18:43:46.79 | 07 06.3 | 0.29 | 7.9/6.9/0.0 | 21.8/16.7/5.1 | -0.530.20 | 4.6E-16/1.9E-15 | No | ||||
| 166T | 1 | 18:43:46.81 | 01 25.7 | 0.18 | 12.2/12.8/0.0 | 37.0/33.5/3.5 | -0.810.12 | 6.5E-16/2.7E-16 | S15573/J18434683-0401264 | 0.83 | 12.20 | 11.32 | 11.05 |
| 167 | 1 | 18:43:46.96 | 10 32.7 | 0.31 | 9.3/8.8/3.0 | 37.6/30.3/7.3 | -0.61 0.15 | 8.9E-16/3.7E-15 | S15657/J18434694-0410326 | 0.36 | 14.90 | 13.81 | 13.41 |
| 168 | 1 | 18:43:47.10 | 08 40.6 | 0.37 | 5.8/4.2/0.0 | 17.8/10.7/7.0 | -0.21 0.26 | 1.9E-16/7.7E-16 | No | ||||
| 169 | 2 | 18:43:47.11 | 53 18.3 | 0.18 | 10.3/9.8/0.0 | 28.3/22.4/5.9 | -0.58 0.15 | 7.0E-16/2.9E-15 | S15778/J18434709-0353182 | 0.11 | 15.65 | 14.60 | 14.23 |
| 170 | 1 | 18:43:47.37 | 08 30.4 | 0.17 | 23.7/27.2/0.0 | 89.8/89.7/0.2 | -0.99 0.03 | 2.3E-15/9.5E-16 | S15972/J18434736-0408301 | 0.32 | 12.36 | 12.23 | |
| 171T | 1 | 18:43:47.55 | 04 06.1 | 0.19 | 5.2/3.8/1.5 | 13.8/8.5/5.2 | -0.24 0.29 | 2.9E-16/1.2E-15 | No | ||||
| 172 | 1/2 | 18:43:47.63 | 56 10.3 | 0.18 | 13.5/14.4/0.0 | 46.1/33.7/12.3 | -0.44 0.12 | 9.6E-16/3.9E-15 | S16177/J18434762-0356105 | 0.20 | 15.70 | 14.84 | 14.66 |
| 173 | 1/2 | 18:43:47.79 | 59 19.0 | 0.29 | 6.1/0.0/6.5 | 18.3/1.3/16.4 | 0.85 0.12 | 1.1E-17/8.2E-15 | No | ||||
| 174 | 2 | 18:43:48.04 | 53 57.5 | 0.26 | 6.0/0.0/6.8 | 22.3/2.7/19.3 | 0.76 0.15 | 1.3E-17/9.3E-15 | No | ||||
| 175 | 1 | 18:43:48.08 | 03 03.4 | 0.28 | 4.4/0.0/4.2 | 10.9/1.6/9.2 | 0.71 0.27 | 5.5E-18/4.0E-15 | No | ||||
| 176 | 1 | 18:43:48.67 | 01 36.1 | 0.10 | 37.6/40.3/4.7 | 134.8/122.4/12.4 | -0.82 0.05 | 1.7E-15/6.8E-16 | S16952/J18434867-0401362 | 0.13 | 14.42 | 13.61 | 13.37 |
| 177T | 1 | 18:43:48.72 | 01 17.6 | 0.32 | 4.5/3.1/0.0 | 16.8/10.2/6.5 | -0.22 0.26 | 1.2E-16/5.0E-16 | No | ||||
| 178 | 1/2 | 18:43:49.03 | 59 57.1 | 0.24 | 7.4/7.1/4.7 | 30.6/17.9/12.6 | -0.35 0.12 | 4.4E-16/1.8E-15 | S17276 | 0.92 | 16.55 | 14.65 | 13.68 |
| 179 | 1 | 18:43:49.11 | 02 56.4 | 0.18 | 4.3/4.2/0.0 | 10.4/8.5/1.8 | -0.66 0.27 | 3.5E-16/1.4E-15 | S17301 | 0.22 | 16.95 | 15.48 | 14.93 |
| 180 | 1 | 18:43:49.21 | 00 54.1 | 0.30 | 5.4/2.5/3.8 | 14.2/4.4/9.8 | 0.39 0.27 | 5.0E-17/1.5E-15 | No | ||||
| 181T | 2 | 18:43:49.22 | 52 38.3 | 0.22 | 15.2/14.2/3.7 | 61.8/46.1/15.8 | -0.49 0.11 | 1.2E-15/4.9E-15 | S17370 | 0.46 | 16.88 | 16.10 | 15.67 |
| 182 | 1 | 18:43:49.39 | 04 13.7 | 0.18 | 8.5/4.2/5.1 | 21.1/9.5/11.7 | 0.11 0.24 | 1.7E-16/5.1E-15 | No | ||||
| 183 | 1 | 18:43:50.42 | 02 29.5 | 0.17 | 4.0/4.3/0.0 | 9.7/9.7/0.0 | -1.00 0.22 | 2.5E-16/1.0E-16 | S18344/J18435042-0402294 | 0.11 | 13.87 | 13.21 | 12.95 |
| 184 | 1 | 18:43:50.51 | 02 07.2 | 0.17 | 4.7/4.1/0.0 | 11.5/9.8/1.9 | -0.68 0.24 | 3.1E-16/1.3E-15 | S18402 | 0.19 | 16.71 | 15.36 | 14.93 |
| 185 | 1/2 | 18:43:50.67 | 58 52.1 | 0.31 | 2.7/4.0/0.0 | 7.9/7.2/0.6 | -0.84 0.24 | 2.6E-16/1.1E-16 | S18522/J18435067-0358526 | 0.62 | 14.97 | 14.37 | 14.13 |
| 186 | 1/2 | 18:43:50.71 | 57 38.8 | 0.33 | 7.0/0.0/7.3 | 33.9/6.9/27.0 | 0.65 0.10 | 1.9E-17/1.4E-14 | No | ||||
| 187 | 2 | 18:43:51.09 | 52 39.1 | 0.18 | 21.4/25.0/0.0 | 82.9/82.0/0.9 | -0.98 0.02 | 2.4E-15/9.8E-16 | S18799 | 0.29 | 10.90 | ||
| 188 | 1/2 | 18:43:51.81 | 59 22.3 | 0.21 | 13.6/12.6/2.2 | 38.0/30.8/7.2 | -0.62 0.10 | 9.2E-16/3.8E-15 | S19355/J18435181-0359222 | 0.03 | 14.93 | 14.01 | 13.54 |
| 189 | 1 | 18:43:52.37 | 07 29.9 | 0.20 | 7.4/6.8/0.0 | 19.0/16.3/2.7 | -0.71 0.19 | 5.1E-16/2.1E-15 | No | ||||
| 190 | 2 | 18:43:52.78 | 53 59.3 | 0.35 | 5.8/4.0/0.0 | 23.0/18.4/4.6 | -0.60 0.18 | 4.4E-16/1.8E-15 | No | ||||
| 191 | 1/2 | 18:43:52.78 | 00 50.1 | 0.24 | 7.9/8.6/0.0 | 24.4/20.1/4.8 | -0.49 0.13 | 5.0E-16/2.0E-15 | S20105 | 0.67 | 16.39 | 15.19 | 14.62 |
| 192 | 1 | 18:43:52.85 | 04 11.4 | 0.21 | 4.4/2.4/0.0 | 10.1/8.4/1.7 | -0.66 0.28 | 3.1E-16/1.3E-15 | No | ||||
| 193 | 1/2 | 18:43:53.11 | 57 59.8 | 0.30 | 5.5/7.2/0.0 | 25.0/19.1/6.0 | -0.57 0.14 | 5.3E-16/2.2E-15 | S20390/J18435312-0357594 | 0.48 | 13.47 | 12.93 | 12.71 |
| 194 | 2 | 18:43:53.58 | 51 16.3 | 0.42 | 5.0/6.8/0.0 | 33.9/26.4/7.6 | -0.55 0.16 | 8.9E-16/3.7E-15 | No | ||||
| 195 | 1/2 | 18:43:54.18 | 58 44.0 | 0.43 | 0.0/4.9/0.0 | 14.4/10.2/4.2 | -0.59 0.18 | 2.8E-16/1.2E-15 | S21144 | 0.37 | 16.28 | 15.41 | 15.09 |
| 196 | 1/2 | 18:43:54.56 | 58 06.3 | 0.34 | 6.2/6.2/0.0 | 39.7/28.0/11.7 | -0.41 0.11 | 6.4E-16/2.7E-15 | No | ||||
| 197 | 1/2 | 18:43:54.61 | 56 41.5 | 0.27 | 14.0/9.9/5.7 | 80.5/37.6/42.3 | 0.07 0.08 | 5.2E-16/1.6E-14 | No | ||||
| 198 | 2 | 18:43:54.65 | 53 36.5 | 0.43 | 5.3/5.6/0.0 | 20.9/18.5/2.4 | -0.77 0.16 | 6.0E-16/2.5E-15 | S21470/J18435466-0353364 | 0.34 | 15.67 | 14.70 | 14.23 |
| 199 | 1 | 18:43:54.83 | 07 42.0 | 0.14 | 22.0/24.4/0.0 | 77.8/73.4/4.5 | -0.88 0.06 | 1.9E-15/7.6E-16 | S21566 | 0.42 | 14.31 | 13.57 | 13.32 |
| 200 | 1/2 | 18:43:55.10 | 58 29.6 | 0.11 | 90.8/23.3/91.4 | 577.7/73.8/501.4 | 0.74 0.02 | 2.3E-16/1.7E-13 | No | ||||
| 201 | 1 | 18:43:55.15 | 04 20.1 | 0.15 | 7.2/7.6/0.0 | 15.1/15.1/0.0 | -1.00 0.15 | 5.0E-16/2.0E-16 | S21808 | 0.36 | 13.04 | 13.42 | 12.04 |
| 202 | 2 | 18:43:55.42 | 52 52.9 | 0.21 | 21.7/18.8/11.8 | 98.7/55.3/42.4 | -0.13 0.10 | 8.0E-16/2.4E-14 | No | ||||
| 203 | 2 | 18:43:55.69 | 57 04.3 | 0.49 | 4.3/0.0/5.0 | 25.6/2.5/22.9 | 0.80 0.14 | 1.2E-17/8.7E-15 | S22226 | 0.39 | 18.57 | 17.23 | |
| 204 | 2 | 18:43:55.70 | 52 50.2 | 0.30 | 10.1/0.0/8.0 | 45.6/18.2/26.4 | 0.18 0.15 | 3.7E-16/1.1E-14 | S22272 | 0.93 | 17.37 | 16.05 | 15.34 |
| 205 | 1 | 18:43:55.78 | 08 25.8 | 0.29 | 5.2/6.7/0.0 | 18.9/16.8/2.0 | -0.78 0.16 | 4.0E-16/1.6E-15 | No | ||||
| 206 | 2 | 18:43:55.90 | 55 03.9 | 0.40 | 4.4/3.4/0.0 | 39.2/28.8/10.4 | -0.47 0.15 | 5.8E-16/2.4E-15 | No | ||||
| 207 | 1 | 18:43:56.59 | 06 08.0 | 0.13 | 7.2/0.0/6.3 | 11.6/0.9/10.7 | 0.85 0.18 | 7.5E-18/5.4E-15 | No | ||||
| 208E | 2 | 18:43:56.68 | 54 47.8 | 0.25 | 16.8/17.4/3.1 | 238.3/197.9/40.6 | -0.66 0.05 | 2.7E-15/1.1E-14 | No | ||||
| 209 | 1/2 | 18:43:56.90 | 57 33.5 | 0.37 | 5.6/7.4/0.0 | 18.2/18.2/0.0 | -1.00 0.10 | 5.5E-16/2.2E-16 | No | ||||
| 210E | 2 | 18:43:56.90 | 54 37.0 | 0.30 | 8.4/0.0/0.0 | 125.1/86.8/38.4 | -0.39 0.09 | 1.6E-15/6.5E-15 | No | ||||
| 211 | 1 | 18:43:57.35 | 01 23.3 | 0.21 | 5.5/2.4/2.8 | 14.3/4.9/9.2 | 0.30 0.28 | 1.2E-16/3.5E-15 | No | ||||
| 212 | 2 | 18:43:57.68 | 51 57.1 | 0.53 | 5.3/4.1/0.0 | 29.9/17.1/12.9 | -0.14 0.19 | 2.0E-16/6.0E-15 | S23609 | 0.90 | 16.90 | 15.44 | 14.77 |
| 213E | 2 | 18:43:57.87 | 54 45.9 | 0.31 | 6.4/0.0/4.2 | 188.3/126.2/61.1 | -0.35 0.07 | 1.8E-15/7.4E-15 | No | ||||
| 214 | 1 | 18:43:57.87 | 07 37.7 | 0.10 | 23.3/24.6/0.0 | 60.5/58.9/1.6 | -0.95 0.05 | 2.7E-15/1.1E-15 | S23783/J18435787-0407379 | 0.37 | 12.82 | 12.12 | 11.95 |
| 215 | 1/2 | 18:43:57.91 | 59 19.8 | 0.34 | 7.4/3.0/4.9 | 12.4/6.3/6.2 | 0.00 0.23 | 1.2E-16/3.7E-15 | No | ||||
| 216E | 2 | 18:43:57.92 | 54 37.5 | 0.34 | 8.5/5.4/0.0 | 123.9/93.1/30.7 | -0.50 0.08 | 1.4E-15/5.9E-15 | No | ||||
| 217 | 1 | 18:43:58.30 | 03 21.2 | 0.16 | 4.5/3.9/0.0 | 10.3/8.4/1.8 | -0.65 0.26 | 2.6E-16/1.1E-15 | S24066 | 0.35 | 16.81 | 15.44 | 14.80 |
| 218 | 1/2 | 18:43:58.53 | 56 21.6 | 0.31 | 9.4/2.1/9.0 | 36.8/8.6/28.3 | 0.53 0.12 | 2.4E-16/7.3E-15 | No | ||||
| 219 | 2 | 18:43:59.02 | 51 15.7 | 0.55 | 6.7/7.2/1.7 | 26.5/26.2/0.2 | -0.98 0.08 | 1.0E-15/4.1E-16 | No | ||||
| 220 | 2 | 18:43:59.28 | 50 26.2 | 0.81 | 4.4/5.1/0.0 | 36.2/30.7/6.7 | -0.64 0.13 | 8.7E-16/3.6E-15 | OoF | ||||
| 221 | 2 | 18:43:59.67 | 55 18.3 | 0.41 | 10.0/10.5/0.0 | 59.6/55.4/4.3 | -0.86 0.08 | 1.7E-15/6.8E-16 | S25062/J18435965-0355183 | 0.21 | 9.30bbSOFI ID in Table 1 (starts with S) and/or 2MASS ID (starts with J) of the NIR source within from the Chandra position. “No” means that the source is in the SOFI field of view, but there are no SOFI counterparts. “OoF” means that the source is out of the SOFI field, and no 2MASS counterparts. | 8.93bbSOFI ID in Table 1 (starts with S) and/or 2MASS ID (starts with J) of the NIR source within from the Chandra position. “No” means that the source is in the SOFI field of view, but there are no SOFI counterparts. “OoF” means that the source is out of the SOFI field, and no 2MASS counterparts. | 8.76bbSOFI ID in Table 1 (starts with S) and/or 2MASS ID (starts with J) of the NIR source within from the Chandra position. “No” means that the source is in the SOFI field of view, but there are no SOFI counterparts. “OoF” means that the source is out of the SOFI field, and no 2MASS counterparts. |
| 222 | 1 | 18:43:59.92 | 07 21.5 | 0.23 | 5.2/2.4/0.0 | 11.9/8.2/3.6 | -0.39 0.30 | 2.4E-16/1.0E-15 | No | ||||
| 223 | 1 | 18:44:00.31 | 05 59.2 | 0.13 | 8.4/7.6/0.0 | 19.8/17.1/2.7 | -0.73 0.17 | 5.0E-16/2.0E-15 | S25554/J18440036-0405594 | 0.81 | 13.59 | 12.37 | 11.91 |
| 224T | 1 | 18:44:01.13 | 57 40.7 | 0.55 | 5.8/5.4/0.0 | 24.1/21.3/2.9 | -0.76 0.16 | 2.7E-16/1.1E-15 | S26066 | 0.61 | 16.59 | 15.38 | 14.74 |
| 225 | 1 | 18:44:01.93 | 05 11.7 | 0.19 | 4.4/3.4/0.0 | 10.1/7.2/2.7 | -0.46 0.31 | 2.1E-16/8.5E-16 | No | ||||
| 226 | 1 | 18:44:02.16 | 05 23.7 | 0.11 | 20.8/22.4/0.0 | 56.2/56.3/0.4 | -0.99 0.04 | 1.7E-15/6.8E-16 | S26833/J18440213-0405243 | 0.93 | 14.18 | 13.41 | 13.15 |
| 227 | 1 | 18:44:02.44 | 12 44.8 | 0.89 | 4.7/0.0/4.8 | 19.1/0.0/19.3 | 1.00 0.13 | 5.6E-18/4.0E-15 | OoF | ||||
| 228 | 2 | 18:44:02.45 | 51 51.7 | 0.68 | 4.0/3.5/0.0 | 26.7/16.8/10.0 | -0.25 0.20 | 4.5E-16/1.8E-15 | No | ||||
| 229 | 1 | 18:44:02.54 | 09 22.3 | 0.19 | 18.5/2.0/19.3 | 77.2/10.8/65.0 | 0.72 0.09 | 4.0E-17/2.9E-14 | S27070/J18440256-0409228 | 0.38 | 13.67 | 12.26 | |
| 230 | 1/2 | 18:44:03.27 | 58 19.0 | 0.27 | 21.0/23.4/0.0 | 66.3/66.0/0.2 | -0.99 0.03 | 1.9E-15/7.8E-16 | S27370/J18440331-0358188 | 0.63 | 13.15 | 12.48 | 12.23 |
| 231 | 1 | 18:44:03.47 | 10 41.8 | 0.50 | 5.8/2.4/3.2 | 25.5/17.6/7.8 | -0.39 0.20 | 2.8E-16/1.2E-15 | No | ||||
| 232 | 1 | 18:44:03.84 | 11 23.6 | 0.70 | 4.2/0.0/4.4 | 23.2/7.6/15.5 | 0.34 0.22 | 1.8E-16/5.4E-15 | OoF | ||||
| 233T | 1 | 18:44:03.95 | 02 57.6 | 0.10 | 31.2/11.8/24.4 | 90.3/29.3/57.5 | 0.320.11 | 6.3E-16/1.9E-14 | S27641/J18440392-0402577 | 0.43 | 14.22 | 13.40 | |
| 234 | 2 | 18:44:03.97 | 54 06.6 | 0.73 | 5.8/6.1/4.7 | 44.2/24.3/19.9 | -0.10 0.16 | 2.8E-16/8.3E-15 | OoF | ||||
| 235T | 1 | 18:44:05.05 | 04 36.9 | 0.10 | 25.2/13.1/15.0 | 64.9/31.0/32.7 | 0.03 0.13 | 6.7E-16/2.0E-14 | S28081 | 0.80 | 17.40 | 15.35 | |
| 236 | 1 | 18:44:05.41 | 08 32.4 | 0.14 | 24.5/25.4/0.0 | 89.4/84.5/5.0 | -0.89 0.05 | 2.3E-15/9.3E-16 | S28203/J18440540-0408325 | 0.17 | 14.98 | 14.31 | 14.07 |
| 237 | 1 | 18:44:05.56 | 05 39.1 | 0.19 | 6.4/4.8/0.0 | 15.1/10.4/4.6 | -0.39 0.26 | 3.8E-16/1.6E-15 | S28248 | 0.52 | 16.59 | 15.28 | 14.87 |
| 238 | 1 | 18:44:05.91 | 06 12.2 | 0.10 | 21.0/18.8/3.9 | 51.6/42.5/9.0 | -0.65 0.11 | 1.1E-15/4.6E-15 | S28382/J18440589-0406124 | 0.53 | 14.27 | 13.36 | 13.10 |
| 239 | 1 | 18:44:06.10 | 08 43.5 | 0.22 | 5.7/6.3/0.0 | 19.7/18.4/1.3 | -0.87 0.15 | 5.2E-16/2.1E-16 | No | ||||
| 240 | 1 | 18:44:06.35 | 07 04.0 | 0.20 | 5.6/0.0/5.6 | 13.6/0.8/12.5 | 0.88 0.16 | 8.4E-18/6.1E-15 | No | ||||
| 241 | 1 | 18:44:07.60 | 05 14.1 | 0.17 | 8.5/0.0/6.7 | 21.7/2.8/18.3 | 0.74 0.17 | 1.2E-17/8.4E-15 | No | ||||
| 242 | 2 | 18:44:08.59 | 53 55.8 | 0.68 | 6.2/0.0/6.8 | 53.2/4.5/49.7 | 0.84 0.09 | 3.0E-17/2.2E-14 | OoF | ||||
| 243 | 1 | 18:44:09.49 | 07 31.6 | 0.17 | 12.8/0.0/11.8 | 41.0/2.0/37.0 | 0.90 0.08 | 2.4E-17/1.8E-14 | No | ||||
| 244 | 1 | 18:44:10.98 | 05 16.8 | 0.14 | 12.6/4.3/9.3 | 30.8/10.5/20.1 | 0.31 0.19 | 2.4E-16/7.1E-15 | S30315/J18441095-0405170 | 0.51 | 15.60 | 13.55 | 12.71 |
| 245 | 1 | 18:44:11.89 | 05 12.6 | 0.18 | 14.1/0.9/13.1 | 40.3/7.9/31.9 | 0.60 0.14 | 2.3E-17/1.7E-14 | No | ||||
| 246 | 1 | 18:44:11.90 | 06 30.7 | 0.23 | 7.3/4.7/2.3 | 20.3/14.7/5.6 | -0.45 0.22 | 5.9E-16/2.4E-15 | S30539/J18441188-0406311 | 0.55 | 15.35 | 13.97 | |
| 247 | 1 | 18:44:12.17 | 08 08.2 | 0.32 | 2.3/0.0/4.1 | 13.0/2.5/10.2 | 0.61 0.27 | 8.7E-18/6.3E-15 | No | ||||
| 248 | 1 | 18:44:13.16 | 06 20.2 | 0.25 | 5.4/0.0/4.1 | 15.2/0.3/13.5 | 0.95 0.16 | 9.1E-18/6.6E-15 | No | ||||
| 249T | 1 | 18:44:13.72 | 02 32.8 | 0.29 | 4.0/2.6/0.0 | 11.5/8.2/3.3 | -0.42 0.32 | 2.8E-16/1.1E-15 | No | ||||
| 250 | 1 | 18:44:13.77 | 12 17.4 | 0.53 | 12.9/0.0/14.9 | 106.2/9.5/97.9 | 0.82 0.06 | 6.3E-17/4.6E-14 | OoF | ||||
| 251 | 1 | 18:44:14.75 | 11 34.7 | 0.44 | 11.0/11.0/2.0 | 64.3/50.6/13.7 | -0.57 0.12 | 1.4E-15/5.9E-15 | OoF | ||||
| 252 | 1 | 18:44:15.62 | 03 56.9 | 0.31 | 6.5/2.8/4.0 | 22.0/9.4/12.4 | 0.14 0.24 | 1.6E-16/4.9E-15 | S31107/J18441558-0403569 | 0.55 | 16.96 | 14.59 | 13.60 |
| 253 | 1 | 18:44:15.73 | 08 58.0 | 0.49 | 4.6/0.0/4.2 | 18.3/5.8/12.4 | 0.36 0.25 | 1.7E-16/5.1E-15 | No | ||||
| 254 | 1 | 18:44:16.25 | 12 57.0 | 0.82 | 5.7/0.0/3.5 | 40.4/7.7/33.4 | 0.62 0.14 | 2.4E-17/1.7E-14 | OoF | ||||
| 255 | 1 | 18:44:18.54 | 06 02.5 | 0.29 | 8.3/6.2/3.9 | 37.1/27.2/9.8 | -0.47 0.16 | 8.8E-16/3.6E-15 | S31539/J18441855-0406027 | 0.35 | 13.54 | 12.59 | 12.11 |
| 256 | 1 | 18:44:21.13 | 57 06.3 | 0.33 | 26.1/25.6/10.6 | 312.3/244.1/66.3 | -0.57 0.05 | 5.4E-15/2.2E-14 | OoF | ||||
| 257 | 1 | 18:44:21.60 | 04 53.2 | 0.40 | 5.5/3.7/3.3 | 29.1/14.0/15.0 | 0.03 0.21 | 3.3E-16/1.0E-14 | S31826 | 0.25 | 15.35 | 14.57 | |
| 258 | 1 | 18:44:21.77 | 12 30.1 | 0.48 | 14.5/12.7/6.7 | 179.3/124.8/55.4 | -0.39 0.08 | 3.1E-15/1.3E-14 | OoF | ||||
| 259 | 1 | 18:44:22.57 | 59 39.8 | 0.57 | 6.1/7.2/0.0 | 55.6/39.1/16.5 | -0.40 0.14 | 9.8E-16/4.0E-15 | OoF | ||||
| 260T | 1 | 18:44:22.61 | 03 51.0 | 0.35 | 11.8/12.4/0.0 | 65.3/57.5/7.7 | -0.760.09 | 1.5E-15/6.2E-15 | S31912/J18442259-0403518 | 0.85 | 14.80 | 13.52 | 13.57 |
| 261 | 1 | 18:44:22.63 | 00 40.0 | 0.50 | 6.7/0.0/8.2 | 42.8/0.0/42.9 | 1.00 0.06 | 2.7E-17/1.9E-14 | OoF | ||||
| 262 | 1 | 18:44:22.67 | 00 17.4 | 0.50 | 6.7/6.5/0.0 | 43.3/33.5/9.8 | -0.55 0.15 | 7.0E-16/2.9E-15 | J18442265-0400176 | 0.30 | 14.36 | 13.39 | 12.52 |
| 263 | 1 | 18:44:23.45 | 03 08.5 | 0.50 | 5.1/0.0/3.3 | 23.8/3.7/20.0 | 0.69 0.18 | 1.1E-17/8.2E-15 | No | ||||
| 264 | 1 | 18:44:24.09 | 59 11.9 | 0.57 | 11.6/11.7/3.6 | 95.2/75.6/19.8 | -0.59 0.09 | 1.8E-15/7.5E-15 | J18442406-0359111 | 0.86 | 13.59 | 12.69 | 12.37 |
| 265 | 1 | 18:44:24.24 | 01 35.1 | 0.52 | 5.4/5.2/0.0 | 28.3/24.0/4.2 | -0.70 0.16 | 7.7E-16/3.2E-15 | J18442423-0401343 | 0.72 | 16.00 | 14.70 | 13.83 |
| 266 | 1 | 18:44:26.23 | 57 48.8 | 0.54 | 11.8/13.9/0.0 | 118.7/118.4/0.0 | -1.00 0.02 | 2.7E-15/1.1E-15 | OoF | ||||
| 267 | 1 | 18:44:26.45 | 06 35.5 | 0.47 | 5.7/4.7/0.0 | 28.3/20.8/7.6 | -0.47 0.19 | 5.1E-16/2.1E-15 | No | ||||
| 268 | 1 | 18:44:26.66 | 04 50.1 | 0.53 | 4.1/3.5/0.0 | 15.0/13.1/2.1 | -0.73 0.21 | 3.0E-16/1.2E-15 | S32241 | 0.80 | 15.61 | 14.58 | 14.12 |
| 269 | 1 | 18:44:26.71 | 03 27.3 | 0.46 | 9.8/10.5/0.0 | 61.5/53.8/7.6 | -0.75 0.10 | 1.2E-15/4.8E-15 | No | ||||
| 270 | 1 | 18:44:27.75 | 07 49.3 | 0.55 | 4.3/4.0/0.0 | 30.1/24.8/5.2 | -0.65 0.16 | 8.2E-16/3.4E-15 | OoF | ||||
| 271 | 1 | 18:44:28.51 | 08 15.3 | 0.63 | 6.2/3.8/4.1 | 36.3/14.3/22.2 | 0.22 0.18 | 2.9E-16/8.8E-15 | OoF | ||||
| 272 | 1 | 18:44:28.87 | 01 03.9 | 0.48 | 14.3/12.1/8.3 | 142.0/85.8/57.2 | -0.20 0.09 | 8.2E-16/2.5E-14 | J18442884-0401033 | 0.60 | 13.29 | 11.83 | 11.11 |
| 273 | 1 | 18:44:30.35 | 10 44.5 | 0.50 | 16.6/7.9/15.6 | 164.6/33.8/134.5 | 0.60 0.07 | 9.4E-17/6.8E-14 | J18443035-0410445 | 0.12 | 17.37 | 15.68 | 13.90 |
| 274 | 1 | 18:44:32.73 | 07 04.4 | 0.58 | 9.2/9.8/0.0 | 55.9/55.7/0.0 | -1.00 0.05 | 1.9E-15/7.6E-16 | OoF | ||||
| ID | R.A. (J2000) | Decl. (J2000) | 2MASS ID | Chandra ID | |||
|---|---|---|---|---|---|---|---|
| (mag) | (mag) | (mag) | |||||
| 1 | 18:43:08.380 | 03:54:34.12 | -999 | 17.64 | 15.58 | … | … |
| 2 | 18:43:08.382 | 03:52:29.29 | 16.69 | 15.33 | 15.09 | … | … |
| 3 | 18:43:08.382 | 03:53:46.51 | 17.37 | 16.56 | 16.40 | … | … |
| … | |||||||
| 8 | 18:43:08.451 | 03:54:07.29 | -999 | 16.04 | 14.56 | 184308450354075 | … |
| … | |||||||
| 687 | 18:43:15.299 | 03:54:19.16 | 10.45 | 10.15 | 10.03 | 184315300354190 | 24 |
| … | |||||||
| 1018 | 18:43:17.438 | 03:57:32.71 | 16.54 | 15.25 | 15.13 | … | 30 |
| … | |||||||
| 32397 | 18:44:28.474 | 04:06:50.97 | 15.72 | 13.80 | 12.64 | … | … |
| 32398 | 18:44:28.477 | 04:04:33.27 | -999 | -999 | 15.18 | … | … |
Note. — We have detected 32,398 sources from our SOFI fields (Fig. 3). For each source, the position, , and magnitudes, and the 2MASS and/or Chandra counterparts are given. When not detected, is put for the magnitude. The Chandra source identification number is defined in Table 1. The complete version of this table is in the electronic edition of the Journal. The printed edition contains only a sample.
| soft | Medium | Hard | Total | |
|---|---|---|---|---|
| hardness ratio | to | |||
| All | 137 | 68 | 69 | 274 |
| ExtendedaaSources associated with the thermal blob-like feature CXOU J184357-035441 (Ueno et al. 2003). | 1 | 3 | 0 | 4 |
| Point Source | 136 | 65 | 69 | 270 |
| Time variationbbThe percentage gives the fraction among all the point sources, excluding the extended sources. Note that the 2MASS covers the entire Chandra field, but SOFI does not. | 4 | 10 | 3 | 17 |
| (3 %) | (15 %) | (4 %) | (6 %) | |
| 2MASS counterpartbbThe percentage gives the fraction among all the point sources, excluding the extended sources. Note that the 2MASS covers the entire Chandra field, but SOFI does not. | 62 | 17 | 8 | 87 |
| (45 %) | (26 %) | (12 %) | (32 %) | |
| Covered by SOFIbbThe percentage gives the fraction among all the point sources, excluding the extended sources. Note that the 2MASS covers the entire Chandra field, but SOFI does not. | 106 | 47 | 49 | 202 |
| (78 %) | (72 %) | (71 %) | (75 %) | |
| SOFI counterpartccThe percentage gives the fraction among the point sources covered by SOFI. | 88 | 25 | 11 | 124 |
| (83 %) | (53 %) | (22 %) | (61 %) | |
| NIR counterpartddPresence of either 2MASS or SOFI counterparts. The percentage gives the fraction among all the point sources. | 98 | 30 | 14 | 142 |
| (72 %) | (46 %) | (20 %) | (53 %) |
| Soft | Medium | Hard | |
|---|---|---|---|
| hardness ratio | to | ||
| Sources with NIR counterparts | |||
| ( cm-2) | |||
| photon-index | |||
| reduced (dof) | 1.7 (181) | 0.99 (137) | 1.2 (62) |
| observed fluxb (0.5 – 10 keV) | 2.1 | 4.7 | 17 |
| intrinsic fluxc (0.5 – 10 keV) | 4.8 | 7.8 | 23 |
| Sources without NIR counterparts | |||
| ( cm-2) | |||
| photon-index | 2.8d | ||
| reduced (dof) | 1.7 (29) | 1.1 (45) | 1.27 (170) |
| observed fluxb (0.5 – 10 keV) | 1.2 | 7.1 | 23 |
| intrinsic fluxc (0.5 – 10 keV) | 2.7 | 13 | 33 |
Note. — Errors correspond to 90 % confidence.
| With NIR | Without NIR | |
|---|---|---|
| counterparts | counterparts | |
| Soft spectra (two MEKAL model) | ||
| Overall normalizationaaPower-law normalization in photons s-1 keV-1 cm-2 at 1 keV. | 1.0 | 0.52 |
| ( cm-2) | ||
| (keV; soft) | ||
| bbAverage source flux in units of erg s-1 cm-2. (soft) | ||
| (keV; hard) | ||
| bbMEKAL model normalization, , where is distance (cm), and are electron and hydrogen densities (in cm-3), respectively. (hard) | ||
| reduced (dof) | 1.35 (179) | 1.85 (30) |
| Medium spectra (two MEKAL model) | ||
| ( cm-2) | ||
| (keV; soft) | ||
| bbMEKAL model normalization, , where is distance (cm), and are electron and hydrogen densities (in cm-3), respectively. (soft) | ||
| (keV; hard) | ||
| bbMEKAL model normalization, , where is distance (cm), and are electron and hydrogen densities (in cm-3), respectively. (hard) | ||
| reduced (dof) | 1.21 (89) | |
| Hard spectra (power-law with iron line and edge) | ||
| ( cm-2) | ||
| photon-index | ||
| ccIntrinsic source flux in units of erg s-1 cm-2 when hydrogen column density is set to null. | 3.26 | 1.57 |
| (keV) | ||
| Line intrinsic width (keV) | ||
| Line equivalent width (eV) | ||
| (keV) | 7.11 (frozen) | |
| Edge depth | ||
| reduced (dof) | 1.06 (59) | 1.28 (67) |
Note. — Errors correspond to 90 % confidence. The spectral model for the medium sources without NIR counterpart is given in Table 4.
| Energy | Line flux | Equivalent width | Identification | |
|---|---|---|---|---|
| (keV) | (photons s-1 cm-2 str-1) | (eV) | ||
| Single line modela | ||||
| NEI plasma? | ||||
| Three line modelb | ||||
| 6.40 (fixed) | Fluorescence from low-ionized iron | |||
| 6.67 (fixed) | He-like iron | |||
| 6.97 (fixed) | H-like iron |
Note. — Errors correspond to 90 % confidence. Intrinsic line width is fixed to zero, assuming that the lines are narrower than the instrumental width ( eV).
| Energy | Line flux | Equivalent width | Identification |
|---|---|---|---|
| (keV) | (photons/s/cm2/str) | (eV) | |
| Ne X,Ly (1.02 keV) | |||
| Fe L? | |||
| Mg XI, K (1.35 keV) | |||
| Mg XII, Ly (1.47 keV) | |||
| Low ionized Si? | |||
| Si XIII, K (1.86 keV) | |||
| 2.00 (fixed) | Si XIV, Ly (2.00 keV) | ||
| Instrumental Au M-complex | |||
| S XV, K (2.45 keV) | |||
| S XVI, Ly (2.62 keV) | |||
| Ar XVII, K (3.12 keV) |
Note. — Reduced = 1.03 with dof = 27. Errors correspond to 90 % confidence. Intrinsic line width is fixed to zero, assuming it is narrower than the instrumental width ( eV).
| Fixed abundance model | Free abundance model | |
|---|---|---|
| Soft Component | ||
| (keV) | 0.86 | |
| (cm-3 s) | 11.1 | |
| Abundance (except Ne, Mg, Si) | 0.11 | |
| Ne abundance | 0.11 | |
| Mg abundance | 0.11 | |
| Si abundance | 0.11 | |
| ( cm-2) | 0.75 | |
| Observed fluxa (erg cm-2 s-1 str-1) | ||
| Intrinsic fluxa (erg cm-2 s-1 str-1) | ||
| Hard Component | ||
| (keV) | 6.52 | |
| (cm-3 s) | 10.18 | |
| Abundance (except Fe) | 0.23 | |
| Fe abundance | 0.23 | |
| ( cm-2) | 4.00 | |
| Observed fluxa (erg cm-2 s-1 str-1) | ||
| Intrinsic fluxa (erg cm-2 s-1 str-1) | ||
| reduced (dof) | 1.97 (68) | 1.52 (64) |
Note. — Errors correspond to 90 % confidence.
| Satellite | GRXE fluxa | Threshold fluxa | Region | Area | Reference |
|---|---|---|---|---|---|
| (erg s-1 cm-2 deg-2) | (erg s-1 cm-2) | (deg2) | |||
| ASCA | b,c | d | 3.3 | Kaneda et al. (1997) | |
| ASCA | b | 63 | Sugizaki et al. (2001) | ||
| XMM | 3 | Hands et al. (2004) | |||
| XMM | 3 | Hands et al. (2004) | |||
| Chandra | 0.07 | This work | |||
| Chandra | 0.07 | This work |