11email: firstname.lastname@obspm.fr 22institutetext: European Southern Observatory (ESO), Alonso de Cordova 3107, Vitacura, Casilla 19001, Santiago 19, Chile
22email: nageorges@eso.org, omarco@eso.org
A dual emission mechanism in Sgr A*/L$^′$ ?††thanks: Based on observations collected at the ESO VLT Yepun telescope, proposal 073.B-0665
We have collected in 2004 adaptive optics corrected L′ images of the Galactic Center region with NAOS-CONICA at VLT. A strong variability was observed as well as a correlation between the photocenter positions and fluxes of the L′-band counterpart of Sgr~A*. It is interpreted as the combined emission of a point-like flaring source at the position of Sgr~A*/IR itself and an extended dust structure, 75 mas south west of Sgr~A*/IR, which we name Sgr~A*-f. We examine the different possible mechanisms to explain this dual Sgr~A* L′ emission and conclude it is likely a flaring emission associated to energetic events in the close environment of the black hole plus a quiescent emission resulting from the collision of Sgr~A*-f by a jet from Sgr~A*.
Key Words.:
Galaxy: center – Infrared: stars – Instrumentation : adaptive optics1 Introduction
Since the advent of adaptive optics (AO) at VLT and Keck, the infrared (IR) counterpart of Sgr~A* is routinely observed from the H- (1.65 m) to the M′-band (4.8 m) (Genzel et al., 2003; Ghez et al., 2004; Clénet et al., 2004a, b) and has demonstrated a high variability at different time scales:
– H-, Ks-, L′-band flares, with typically a 1 h duration and a 1.5 to 5 flux magnification (Genzel et al., 2003), similar in time scales to the X-ray flares (Baganoff et al., 2001; Porquet et al., 2003; Eckart et al., 2004);
– L′-, M′-band variations on daily time scales (Ghez et al., 2004; Clénet et al., 2004b), with a flux magnification up to 5;
– L′-band variations on yearly time scales (Clénet et al., 2004b), with a flux magnification between 3 and 5.
Even though the observed IR fluxes are much below the predictions for a 3106 M⊙ black hole radiating at the Eddington rate, they can be well fitted by a non thermal electron emission, whatever is the still unknown source accelerating these electrons: a jet (Markoff et al., 2001; Yuan et al., 2002) or the accretion flow (Yuan et al., 2003, 2004).
We report the detection of the L′-band counterpart of Sgr~A* (hereafter Sgr~A*/L$^′$) as a source whose intensity and position are time dependent. It results from the combined emission of Sgr~A*/IR itself and a nearby extended structure we name Sgr~A*-f. We first detail the observations and data reduction, next explain the photometry and astrometry methods, then examine the position-flux correlation of Sgr~A*/L$^′$ and finally explore different mechanisms for this Sgr~A*/L$^′$ emission.
2 Observations and data reduction
We have performed L′-band (3.8 m, 0.0271″/pixel) observations of the Galactic Center region during five 2004 nights (Apr 24, Apr 25, June 13, Aug 10 and Sept 20, hereafter Night 1, 2, 3, 4 and 5 respectively) with NACO (Lenzen et al., 1998; Rousset et al., 2000), the AO assisted imager installed at the 8m VLT UT4 telescope.
On-source (A) and on-sky (B) 10241024 frames, each one resulting from the mean of 60 subintegrations of 0.175 s, have been alternatively acquired following an ABBA cycle, with a random jitter within a box 6″ wide every other cycle. The sky position was 3′ away from the on-source position. The total on-source integration times were 27.3 min, 16.8 min, 49 min, 10.5 min and 9.8 min for Nights 1, 2, 3, 4, 5 respectively.
After sky subtraction, flat fielding and bad pixel correction, the recentering has been done in two steps: (1) the relative offsets between individual images have been estimated by computing their cross-correlation function, leading to an accuracy of 0.5 pixel; (2) a subpixel recentering has been performed with a maximum likelihood based algorithm (Gratadour et al., 2005), leading to a final accuracy of 0.01 pixel i.e. 0.3 mas.
For each night, to allow for a study of the time evolution of the Sgr~A*/L$^′$ flux with a sufficient signal to noise, we have averaged the recentered individual images into groups of four, leading to a cube of averaged images with a typical sampling of 265 s and a 42 s integration time for each averaged image.
3 Astrometry and photometry
The astrometry and the photometry of all averaged images have been obtained with StarFinder (Diolaiti et al., 2000), a PSF-fitting software designed for AO data.
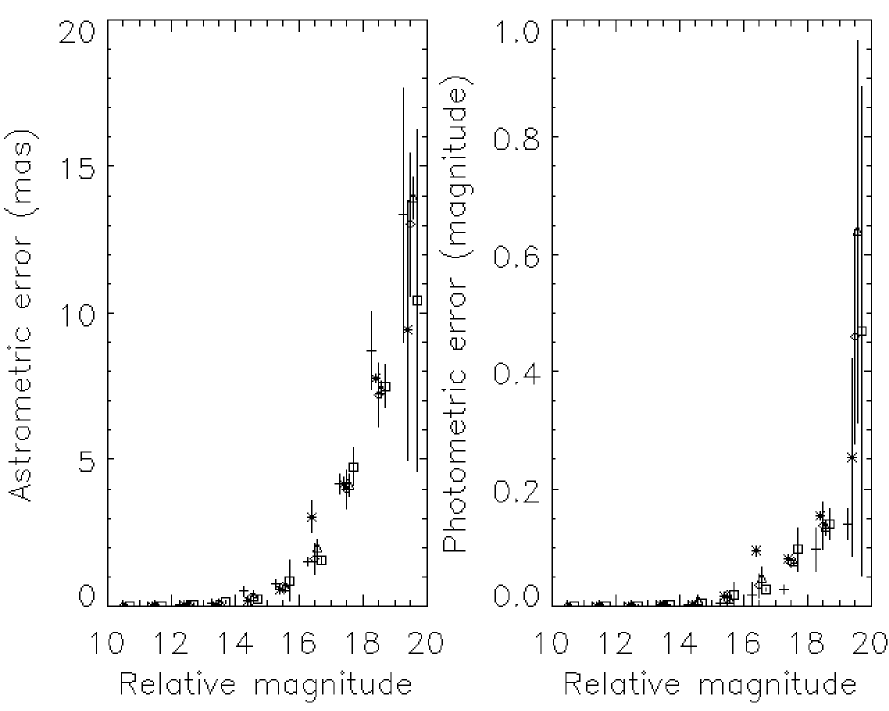
To estimate the StarFinder accuracy for a given averaged image, we have added, in each magnitude bin of the luminosity function computed by StarFinder, 20% of synthetic stars at random positions and with random magnitudes and re-analyzed this new image with StarFinder. For each night, this procedure has been applied to three different averaged images.
Up to the relative magnitude bin [18,19] (L′[13.5,14.5]), the error dispersion between the different nights is small, as well as the standard deviation associated to each night error value (Fig. 1). This is no longer the case for the last bin [19,20] (L′[14.5,15.5]), most probably because of the lower accuracy of StarFinder for these fainter stars.
The absolute photometry has been computed as in Clénet et al. (2004b), using the photometry of the non variable stars IRS~16C, IRS~29N and IRS~33SE published in Blum et al. (1996). Given the accuracy of this zero-point computation (0.08 mag) and the StarFinder accuracy (Fig. 1), we finally estimate the photometric error for the L′14 stars to be 0.18 mag for Night1, 0.17 mag for Night2, and 0.16 mag for Night3, Night4 and Night5.
Dereddened fluxes have been computed as in Clénet et al. (2004b) with an L′-band extinction A=1.30 and a zero magnitude value F0(L′)=248 Jy.
Following Clénet et al. (2004b), the astrometry has been calculated with respect to Sgr~A* taken as the dynamical center (DC) of the S2 star orbit. The offsets between S2 and DC are given in Table 1 and the final astrometric errors in Table 2.
| Date | Apr. 24 | Apr. 25 | Jun. 13 | Aug. 10 | Sep. 20 |
|---|---|---|---|---|---|
| (mas) | 315 | 315 | 305 | 295 | 285 |
| (mas) | 1119 | 1119 | 1158 | 1205 | 1234 |
| Date | Apr. 24 | Apr. 25 | Jun. 13 | Aug. 10 | Sep. 20 |
|---|---|---|---|---|---|
| (mas) | 8 | 8 | 8 | 8 | 8 |
| (mas) | 11 | 11 | 10 | 8 | 7 |
4 Results
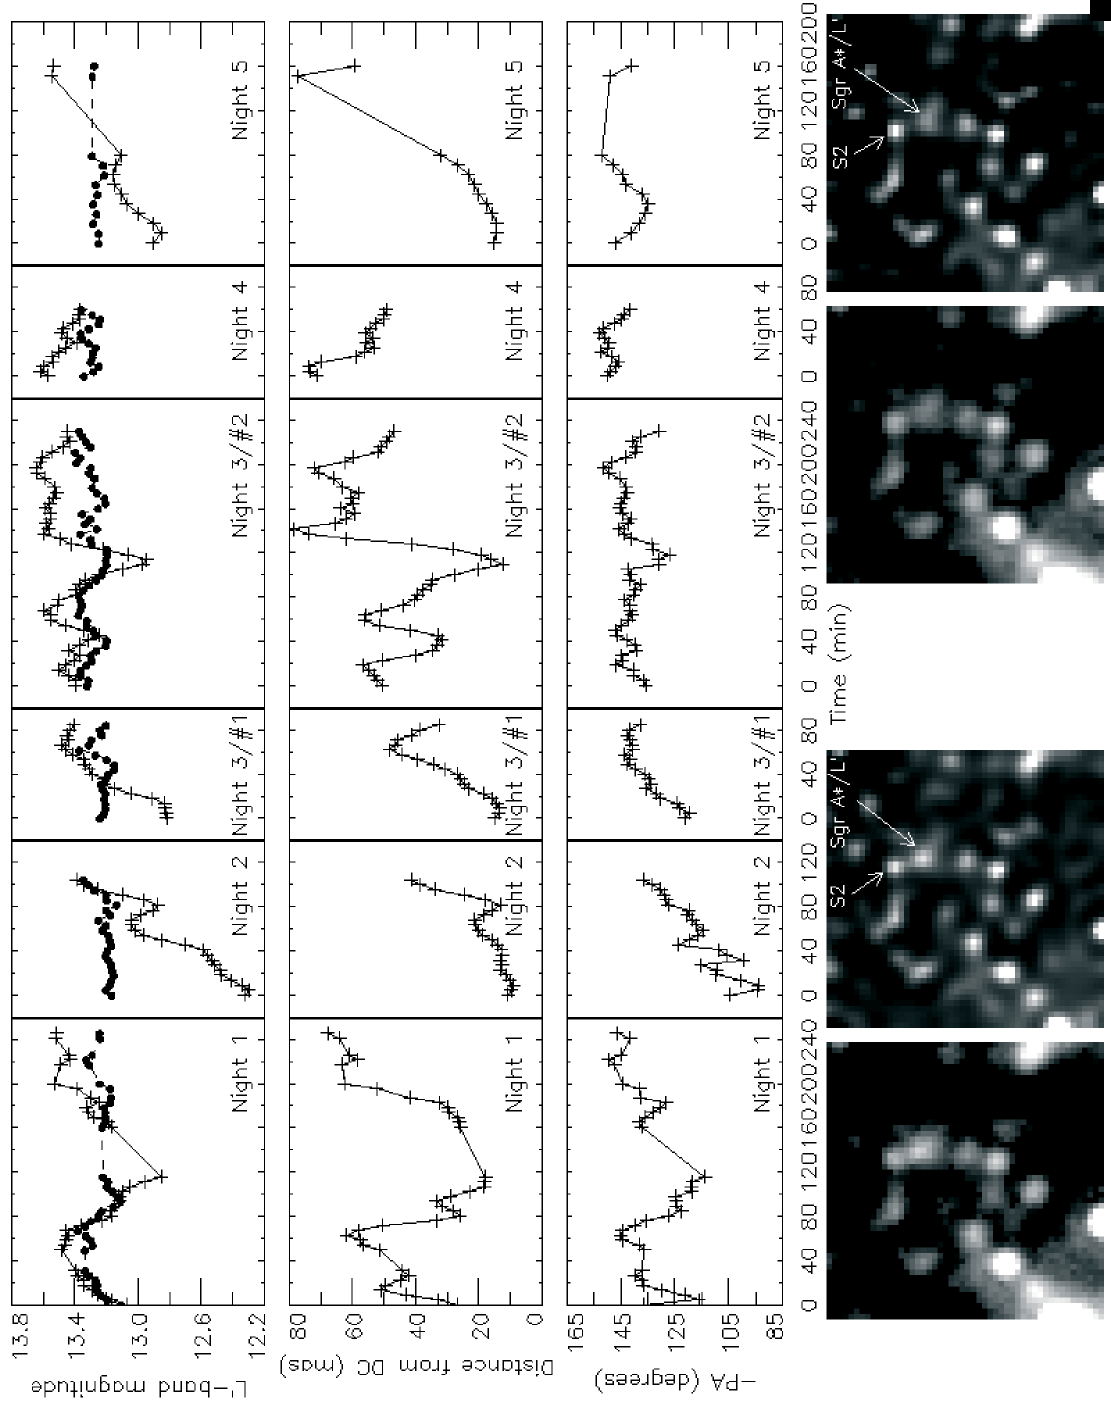
The photocenter positions and fluxes of Sgr~A*/L$^′$ were measured on each averaged image using StarFinder. Firstly, as described in Clénet et al. (2004b), Sgr~A*/L$^′$ has exhibited variability on time scales of about one hour: flares with an amplification factor 2 during Night 1 and Night 3/part2; only decays or rises, with an amplification factor 3, for the other nights.
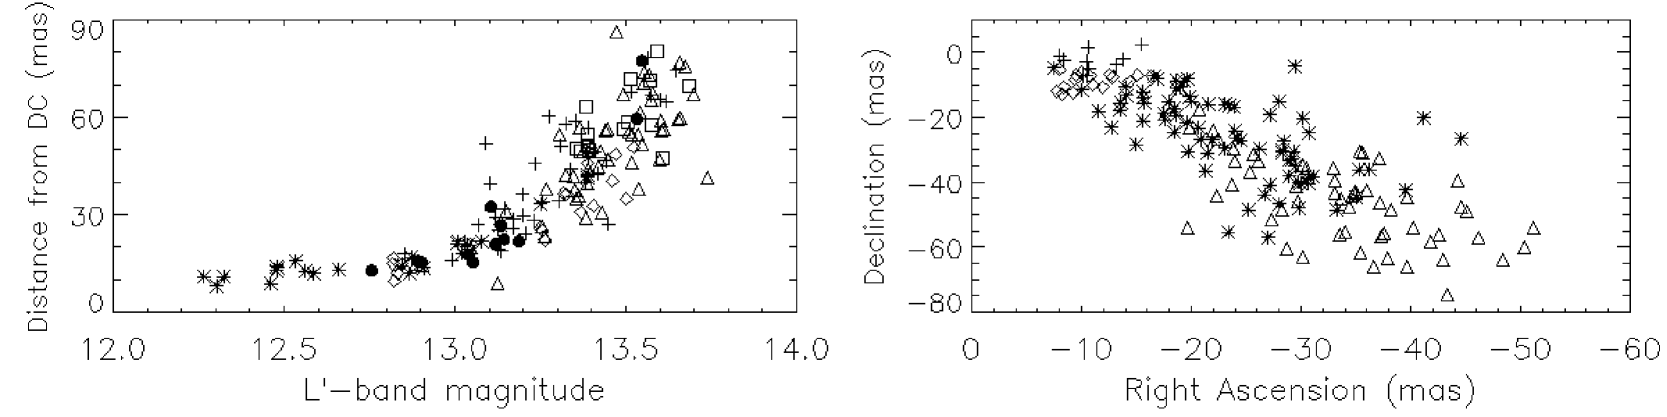
Secondly, we confirm the offset of Sgr~A*/L$^′$ in quiescence with respect to DC reported in Clénet et al. (2004b) at L′ and M′; we also observe a clear correlation between the Sgr~A*/L$^′$ flux and a) the DC-Sgr~A*/L$^′$ distance, b) the Sgr~A*/L$^′$ position angle (PA) with respect to DC. We show that these correlations are reproducible from one night to another: Sgr~A*/L$^′$ and DC are all the more distant and Sgr~A*/L$^′$ is all the more shifting toward DC than Sgr~A*/L$^′$ is bright (Fig. 2, 3).
Hence, our observations point at a dual mechanism responsible for the 3-5 m emission in Sgr~A*: one traced by the flaring state, unresolved and associated to Sgr~A*/IR itself; another one associated to the quiet state, clearly resolved with a typical extension of about 130 mas, occurring at the south-west of the dynamical centre (PA-130°) and at a distance of 75 mas typically (600 AU) from it. A simple argument on the light velocity limit comforts the likeliness of this dual mechanism from two distinct sources where the emission originates from two distinct sources that NACO has marginally separated spatially, thanks to the extension of its quiescent part.
5 Discussion
The flaring source compactness and the typical variation times measured at L′ do not conflict with the interpretation of Eckart et al. (2004): both near-IR and X- emissions would be related to synchrotron self-Compton emission of electrons. The flare could be mainly due to Doppler boosted emission from material moving toward the observer, either matter at the base of a jet, or matter bound to the black hole on one of the innermost stable orbits. No simultaneous observations at several IR wavelengths have yet been done to allow one to derive the IR spectral index and we can only guess that flares are rather reproducible phenomena, as indicated by the similar behaviour of rises and decays in the observed L′-band events.
Though, another process should be invoked to explain a quiescent emission as far as 600 AU, corresponding to about 104 Schwarzschild radius (). A stellar emission could hardly account for this quiescent emission since: a) no K-band source can be observed at this location in the images of Eckart et al. (2004) (see their Figure 2), b) the inferred K-L′ color (larger than 3) would be too large, c) the source appears extended.
An estimate of the IR color temperature corresponding to the Sgr~A*/L$^′$ quiescent emission can be computed by assuming the quiescent K-band dereddened flux density found by Eckart et al. (2004) ((K)=1.9 mJy), a quiescent L′-band dereddened flux density of 3.0 mJy and by resolving the optically thin case equation:
where is the absorption cross section coefficient and the Planck function at the temperature and the wavelength . From the dust grain properties of Laor & Draine (1993) for dust grain sizes ranging from 0.01 to 0.1 m, we obtain a color temperature between 1110 K and 1130 K for silicate grains, between 870 K and 930 K for graphite grains.
To estimate a maximum equilibrium temperature of dust grains heated by Sgr~A* itself, we equal the powers received and radiated by the grain:
where is the Sgr~A* flux density, the dust grain size and the distance we have found between the central black hole and Sgr~A*/L$^′$ in its quiescent state (=600 UA, ie about 75 mas). Since the smallest wavelengths dominate the first term, we approximate by the Sgr~A* quiescent state power law found by Baganoff et al. (2001) and usually adopted to constrain the Sgr~A* emission models:
For dust grain sizes ranging from 0.001 to 0.1 m, we obtain an equilibrium temperature between 70 K and 90 K for silicate grains, between 80 K and 110 K for graphite grains. About one order of magnitude is then found between the quiescent IR color temperature of Sgr~A*/L$^′$ and the temperature expected if the accretion disk emission was the dust heating source at the Sgr~A*/L$^′$ location. This latter process is therefore excluded to explain the L′ quiescent emission.
We have also explored the possibility that the quiescent extended L′ emission could be due to synchrotron emission from a jet. The absorption coefficient of the synchrotron emission is , where and describe the power-law dependence of the electrons energy distribution () and is the magnetic field. Using the jet model described in Falcke & Markoff (2000), completed by the analytical expression of the quantity established in Falcke (1996), we have set the parameters at the jet nozzle according to Yuan et al. (2002), i.e. so that to fit the millimetric observations. As expected, the resulting optical depth at a typical distance of 600 AU from the black hole is extremely low, so that the quiescent extended L′ emission cannot be explained by the high frequency wing of synchrotron radiation from a jet.
If we now consider the mass loss rate in the jet found by Yuan et al. (2002), =4.310-9 M⊙yr-1, and translate it in kinetic power delivered by the jet (assuming an equipartition between ions and electrons), we get =, where , , are the mass of electron, the mass of proton and the electron to light speed ratio, respectively. With =0.95 (Yuan et al., 2002), we obtain =1.21035 erg/s=32 L⊙.
On the other hand, the total luminosity, if due to grains, that would correspond to the observed L′-band luminosity is:
For silicate grains at =1120 K and graphite grains at =900 K, whatever the grain size from from 0.001 to 0.1 m, it comes =12 L⊙ and =6 L⊙ respectively, which are of the same magnitude order as the kinetic power delivered by the jet . Therefore, one could consider the energy transfer of this jet power to the dusty material surrounding Sgr A* through collisions as a possible mechanism to explain the Sgr~A*/L$^′$ quiescent emission.
In this description, the observed quiescent state extended source would be a small dust condensation, close to Sgr~A* and heated through a colliding jet. The observed position-magnitude correlation would then result from Starfinder measuring the position/magnitude of the combined emission of Sgr~A*/IR itself and this dust structure.
We note that the Sgr~A*/IR naming should be reserved to the flaring location since the role of the black hole is obvious for this state. We propose to name Sgr~A*-f (standing for Sgr~ A* ”flake”) the extended emission located south west of Sgr~A*/IR. Sgr~A*/L$^′$ is then the observed combined emission of Sgr~A*/IR and Sgr~A*-f.
We cannot totally exclude that Sgr~A*-f belongs to the mini-spiral and is then located at a fraction of parsec from Sgr~A* along the line of sight. Though, the physical association of Sgr~A*/IR and Sgr~A*-f is supported by the presence of a chain of gaseous clouds, probably associated to Sgr~A* through a ridge of emission, observed in the radio continuum between Sgr~A and the mini-cavity (Yusef-Zadeh et al., 1990). These clouds would be driven by fast winds towards the gas streamers orbiting Sgr~A* (the ”Minispiral”) and create by shocks the mini-cavity.
The origin of these radio features is still discussed: Wardle & Yusef-Zadeh (1992) and Melia et al. (1996) proposed they are formed by the gravitational collimation of the IRS~16 cluster stellar winds by Sgr~A*. Alternatively, Lutz et al. (1993) invoked a jet from Sgr~A*, similarly to our scenario, as the wind source.
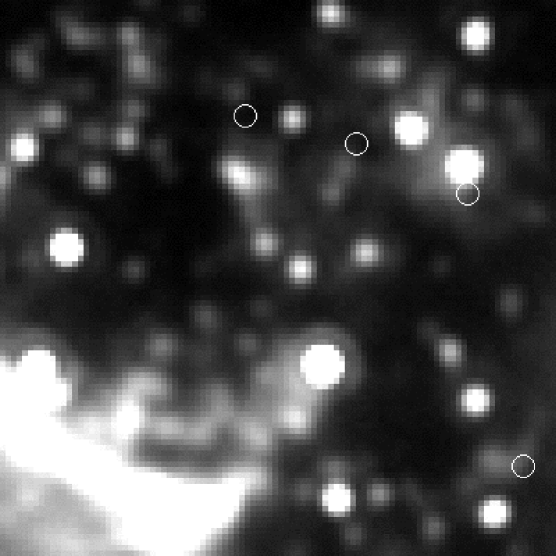
The position of these gaseous H ii components, taking into account their estimated proper motions and their fairly extended sizes (Yusef-Zadeh et al., 1998; Zhao & Goss, 1999), is very close to very red IR extended sources (Fig. 4), e.g. H ii 5D in Zhao & Goss (1999) and ID18 in Clénet et al. (2004a). This suggests a common origin, if not an identification, between the sources at the different wavelengths. Sgr~A*-f could then related to this chain of structures, possibly to the unnamed feature in Fig. 3 upper panel of Zhao & Goss (1999), located, in 1998, 0.35″ south west to Sgr~A*: a proper motion similar to the other H ii structures (25 mas yr-1) could have shifted this feature very close to the 2004 position of Sgr~A*-f.
In the future, to constrain the aforementioned physical model of a jet interacting with Sgr A*-f, simultaneous observations at different IR wavelengths of Sgr~A*/IR in both quiescent and flare states will be essential. An instrument such as the NACO prism disperser, which covers simultaneously the IR spectrum from J (1.3 m) to M (4.8 m), could be efficiently dedicated to this task.
References
- Baganoff et al. (2001) Baganoff, F., Bautz, M., Brandt, W., et al. 2001, Nature, 413, 45
- Blum et al. (1996) Blum, R., Sellgren, K., DePoy, D. 1996, ApJ, 470, 864
- Clénet et al. (2004a) Clénet, Y., Rouan, D., Gendron, E., et al. 2004a, A&A, 417, L15
- Clénet et al. (2004b) Clénet, Y., Rouan, D., Gendron, E., et al. 2004b, A&A, 424, L21
- Diolaiti et al. (2000) Diolaiti, E., Bendinelli, O., Bonaccini, D., et al. 2000, A&AS, 147, 335
- Eckart et al. (2004) Eckart, A., Baganoff, F., Morris, M., et al. 2004, A&A, 427, 1
- Eisenhauer et al. (2003) Eisenhauer, F., Schödel, R., Genzel, R., et al. 2003, ApJ, 597, 121
- Falcke (1996) Falcke, H. 1996, ApJ, 464, 67
- Falcke & Markoff (2000) Falcke, H., & Markoff, S. 2000, ApJ, 362,113
- Genzel et al. (2003) Genzel, R., Schödel, R., Ott, T., et al. 2003b, Nature, 425, 934
- Ghez et al. (2004) Ghez, A., Wright, S., Matthews, K., et al. 2004, ApJ, 601, 159
- Gratadour et al. (2005) Gratadour D., Mugnier, L., Rouan, D. 2005, A&A, submitted
- Laor & Draine (1993) Laor, A., & Draine, B.T. 1993, ApJ, 402,441
- Lenzen et al. (1998) Lenzen, R., Hofmann, R., Bizenberger, P., Tusche, A., et al. 1998, Proc. SPIE, 3354, 606
- Lutz et al. (1993) Lutz, D., Krabbe, A., Genzel, R. 1993, ApJ, 418, 244
- Markoff et al. (2001) Markoff, S., Falcke, H., Yuan, F., Biermann, P. 2001, A&A, 379, L13
- Melia et al. (1996) Melia, F., Coker, R., Yusef-Zadeh, F. 1996, ApJ, 460, 33
- Porquet et al. (2003) Porquet, D., Predehl, P., Aschenbach, B., et al. 2003, A&A, 407, L17
- Rousset et al. (2000) Rousset, G., Lacombe, F., Puget, P., et al. 2000, Proc. SPIE, 4007, 72
- Wardle & Yusef-Zadeh (1992) Wardle, M., & Yusef-Zadeh, F. 1992, Nature, 357, 308
- Yuan et al. (2002) Yuan, F., Markoff, S., Falcke, H. 2002, A&A, 383, 854
- Yuan et al. (2003) Yuan, F., Quataert, E., Narayan, R. 2003, ApJ, 598, 301
- Yuan et al. (2004) Yuan, F., Quataert, E., Narayan, R. 2004, ApJ, 606, 894
- Yusef-Zadeh et al. (1990) Yusef-Zadeh, F., Morris, M., Ekers, R. 1990, Nature, 348, 45
- Yusef-Zadeh et al. (1998) Yusef-Zadeh, F., Roberts, D., Biretta, J. 1998, ApJ, 499, 159
- Zhao & Goss (1999) Zhao, J., & Goss, W. 1999, in ASP Conf. Ser. 186, The Central Parsecs of the Galaxy, ed. H. Falcke et al., 224