A photometric study of V1193 Ori: detection of orbital and negative superhump periods
Abstract
We present the results obtained from unfiltered photometric CCD observations of V1193 Ori made during 24 nights between November 2002 and January 2003. We found periods of , and possibly in the data. The period is consistent with the alias of the proposed orbital period of = (Ringwald, Thorstensen Hamwey, 1994; Papadaki et al., 2004). Thus and using the known relation between the orbital and superhump periods, we interpret these periods as the orbital period of , the negative superhump period of and the precession period of . V1193 Ori can then be classified as a permanent superhump system.
keywords:
Accretion, accretion discs , Binaries : close , Novae, cataclysmic variablesPACS:
97.10.Gz , 97.80 , 97.30,
1 Introduction
V1193 Orionis (=, =-; Downes, Webbink Shara, 1997), also named Hamuy’s Blue Variable, was discovered by M. Hamuy while working on a photoelectric sequence around Seyfert 120 galaxy Arakelian 120 (Hamuy Maza, 1986; Hamuy, Maza Ruiz, 1986). They estimated a mean V magnitude of 14.08 and mean colours of U-B=-0.82, B-V=+0.05, V-R=+0.08 and R-I=+0.11. Hamuy Maza (1986) also reported a V magnitude variation with an amplitude of 0.33 mag and U-B colour variation with an amplitude of 0.23 mag.
Preliminary spectroscopic analysis of V1193 Ori (Filippenko Ebtener, 1986) revealed the presence of relatively strong and emissions superposed on broad absorption lines. In accordance with the earlier descriptions of the spectrum, a single spectroscopic observation made by Bond et al. (1987) showed that the star has a very blue continuum and a very broad and shallow absorption with a central emission peak. Bond et al. (1987) also found irregular flickering with a peak to peak amplitude of more than 0.15 mag in the light curve of V1193 Ori. They suggested that the star is a member of the UX UMa class of cataclysmic variables (nova-like systems). Nova like systems are cataclysmic variables whose light curves do not have dwarf nova outbursts. This is understood by high mass transfer rates and thermally stable accretion discs, probably as a result of a previous nova eruption (e.g., Warner, 1995; Retter, Naylor Leibowitz, 1999). Rapid flickering activity with an unusually high amplitude of 0.25 mag in the star’s high speed photometry was found by Warner and Nather (1988). Later on, Ringwald et al. (1994) verified the object’s classification as an UX UMa star and suggested an orbital period of from the radial velocity study of the emission lines. The most recent CCD photometry of V1193 Ori was reported by Papadaki et al. (2004), who confirmed the orbital period of and the rapid flickering dominating the light curves of all photometric observations of the star.
In this paper, we report on the most extensive photometric observations of V1193 Ori done so far, which suggest a refined orbital period, a negative superhump period and a precession period obtained from the periodogram analysis.
2 Observations
Photometric observations of V1193 Ori were made by one of us, Liu, with a 30 cm Meade LX200 telescope coupled to an Optec f3.3 focal reducer and an SBIG ST7E CCD camera. The telescope is located in Exmouth, Western Australia, and no filter was used. The quantum efficiency of the CCD camera is maximized near 620 nm and it is sensitive between 400 and 950 nm. Exposure times were 300 sec in the first run which occurred between November 30 to December 13, 2002 (HJD 2452609-2452622) and 180 sec in the second run which occurred between December 31 to January 12, 2003 (HJD 2452640-2452652). The observational log is given in Table 1. The observations span 24 nights (142.8 hours in total). We estimated differential magnitudes with respect to GSC4752-1133 (the comparison star), using GSC4752-1117 as the check star for which GSC magnitudes are and , respectively.
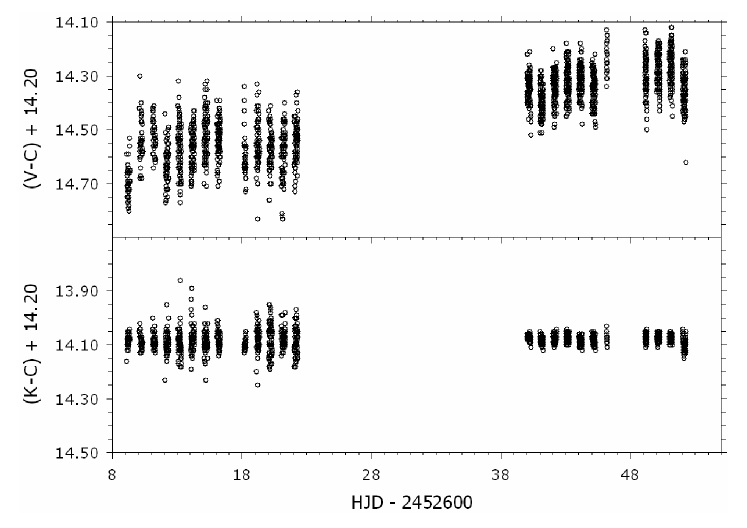
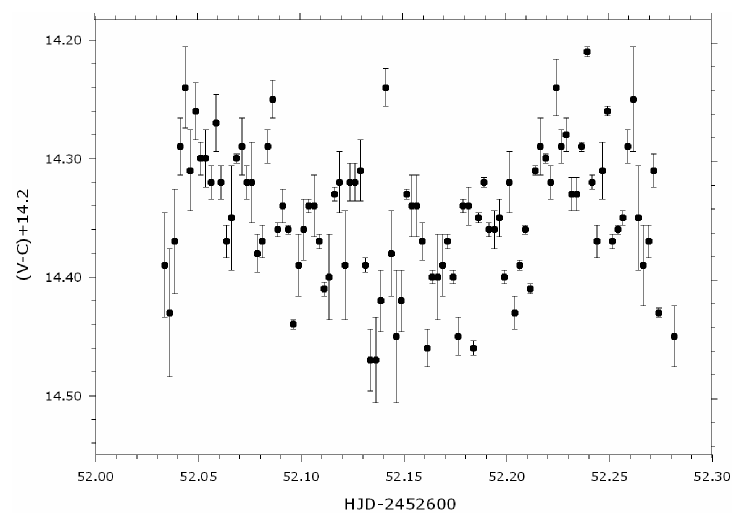
Differential magnitudes were calculated using aperture photometry. The mean GSC magnitude of the comparison star was added to the differential magnitudes to give a rough estimate of the visual magnitude. The light curve of V1193 Ori obtained during the observations is shown in Fig. 1. A part of the light curve of V1193 Ori observed on a typical night is presented in Fig. 2. Observational errors were estimated from the deviations of the K-C magnitudes from the nightly means and are typically about and for the first and second runs, respectively.
| Date | HJD Start | Duration | Expusure | N |
|---|---|---|---|---|
| (HJD-2452600) | (hours) | (Seconds) | ||
| Nov. 30, 2002 | 09.0918 | 6.4 | 300 | 37 |
| Dec. 01, 2002 | 10.0925 | 5.9 | 300 | 38 |
| Dec. 02, 2002 | 11.0934 | 5.9 | 300 | 38 |
| Dec. 03, 2002 | 12.0593 | 6.5 | 300 | 62 |
| Dec. 04, 2002 | 13.0488 | 6.6 | 300 | 71 |
| Dec. 05, 2002 | 14.0601 | 6.5 | 300 | 70 |
| Dec. 06, 2002 | 15.0591 | 7.2 | 300 | 76 |
| Dec. 07, 2002 | 16.0751 | 6.4 | 300 | 70 |
| Dec. 09, 2002 | 18.1664 | 3.8 | 300 | 41 |
| Dec. 10, 2002 | 19.1175 | 5.5 | 300 | 60 |
| Dec. 11, 2002 | 20.0835 | 6.0 | 300 | 65 |
| Dec. 12, 2002 | 21.0531 | 6.8 | 300 | 69 |
| Dec. 13, 2002 | 22.0550 | 6.6 | 300 | 72 |
| Dec. 31, 2002 | 40.0393 | 6.4 | 180 | 95 |
| Jan. 01, 2003 | 41.0207 | 6.0 | 180 | 100 |
| Jan. 02, 2003 | 42.0218 | 6.6 | 180 | 110 |
| Jan. 03, 2003 | 43.0243 | 6.6 | 180 | 109 |
| Jan. 04, 2003 | 44.0121 | 6.6 | 180 | 108 |
| Jan. 05, 2003 | 45.0285 | 6.6 | 180 | 106 |
| Jan. 06, 2003 | 46.1301 | 1.6 | 180 | 22 |
| Jan. 09, 2003 | 49.1029 | 4.3 | 180 | 69 |
| Jan. 10, 2003 | 50.0294 | 6.0 | 180 | 98 |
| Jan. 11, 2003 | 51.0067 | 6.0 | 180 | 100 |
| Jan. 12, 2003 | 52.0344 | 6.0 | 180 | 100 |
3 Analysis
The period analysis was performed using the Data Compensated Discrete Fourier Transform (DCDFT, Ferraz-Mello, 1981; Foster, 1995), including the CLEAN algoritm (Roberts, Lehar Dreher, 1987). The DCDFT method is based on a least-square regression on two trial functions, sin(ft) and cos(ft), and a constant. We note that the signal to noise ratio of the power spectra calculated by DCDFT are much higher than those of Scargle’s modified periodogram (see Figs.(1b) and (1c) of Foster, 1995). Here f denotes the frequency. In the period analysis, we assume that the frequency, say , that corresponds to the highest peak in the power spectrum is real and subtract its fit from tha data. Then, we find the highest peak, say , in the power spectrum of the residuals, subtract and simultaneously from the raw data and calculate a new power spectrum etc. until the strongest residual peak is below a given cutoff level. To select the peaks, we also quantitavely estimated the statistical significances of peaks in the periodograms (see, Scargle, 1982; Horne Baliunas, 1986) and considered only those peaks of the power spectrum whose height was above the confidence level. In order to calculate a confidence level, we followed a conservative approach which is similar to the method described by Breger et al. (1993) (see also, Kuschnig et al., 1997) who gave a good criterion for the significance of a peak in the power spectrum. In Breger’s method, the peaks in the power spectrum which are higher than the signal to noise ratio, S/N, of 4.0 for the amplitude are indicators of real signals. In order to assign a confidence level to the power spectra, we calculated the standard error () of the power values between the frequencies for which no strong peaks appear. We assumed 4 to be the confidence level for the power. Note that we also searched for periodic brightness modulations by Period98 (Sperl, 1998), which is based on a least-square regression on a trial function, sin(ft), along with a zero point. Period98 is a program to search for and fit sinusoidal patterns within a time series of data in which one suspects periodic behavior. It was developed to solve problems of large astronomical data sets containing huge gaps. Period98 uses the discrete Fourier transform algorithm to calculate the frequency spectra. We found very similar power spectra from both techniques. We calculated the error in a frequency from the half width at the half maximum of the peak in the raw spectrum which is a good rough estimator of the uncertainty in a frequency.
3.1 The raw data
The mean magnitudes of the system were estimated as 14.5660.003 and 14.3240.002 mag for the first (first 13 nights, HJD 2452609-2452622) and second (last 11 nights, HJD 2452640-2452652) runs, respectively. The error values represent one standard deviation of the mean values. The mean magnitude of V1193 Ori during the second run was 0.242 mag brighter than the first run. This magnitude difference between the two observing runs creates strong low frequency signals in the power spectrum. Therefore, we subtracted the mean magnitudes of each observing run from the observations of V1193 Ori in order to remove these low frequency peaks from the power spectra.
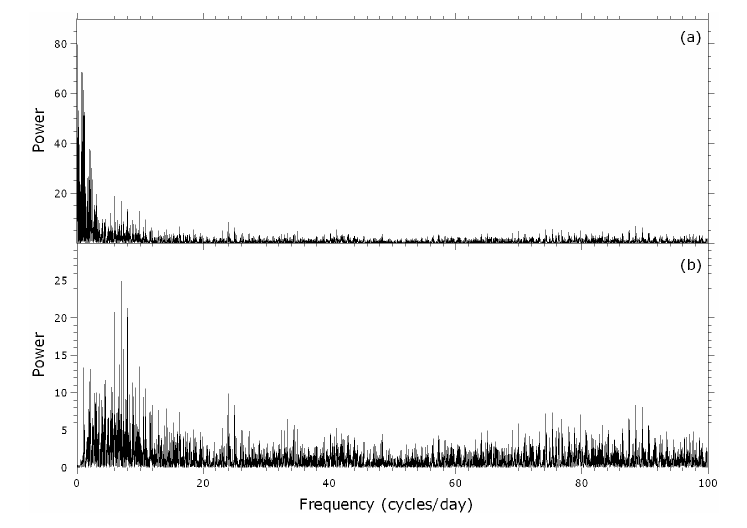
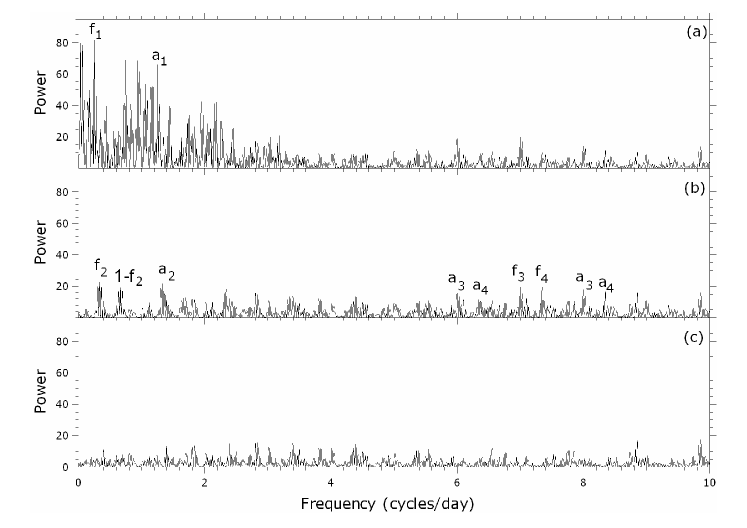
The power spectrum of the light curve of V1193 Ori is dominated by the aliases of a low frequency signal and the observational gaps of about 1 day as demonstrated in Fig. 3 and Fig. 4a. The strongest peak in the power spectrum is found at the frequency =0.2520.006 c/d (0.09). To search for additional signals, this signal and the signals originated from observational gaps were subtracted from the data. In the power spectrum of the residuals (Fig. 4b), the strongest peaks correspond to the frequencies of =0.3360.008 c/d (0.07), =6.9980.008 c/d (0.0002) and =7.3420.008 c/d (0.0002) which are statistically significant. In order to find a confidence level for the power, we calculated the standard error () of the power level to be 0.87 between 10-100 . By considering this standard error as the noise level, we calculated the limiting confidence level to be 4=3.48 for the power, as described above. The presence of the period is somewhat questionable since it is close to . However, the data contain successive nights and there are no clear gaps of . This fact supports the presence of this period.
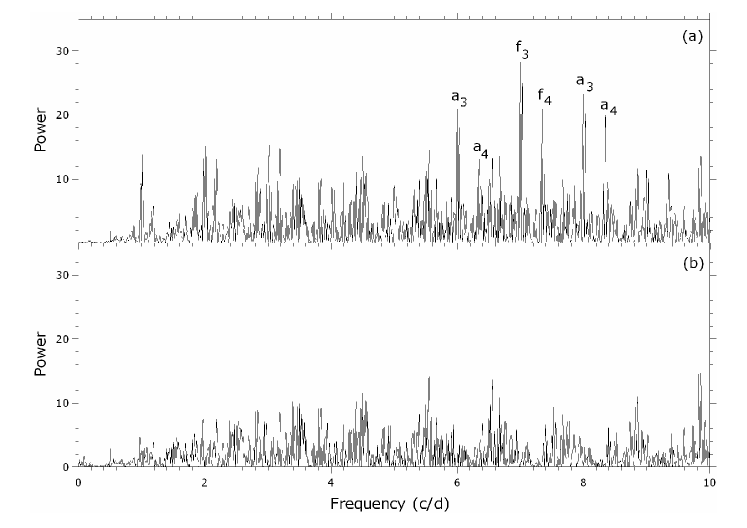
3.2 The frequencies near 7 c/d
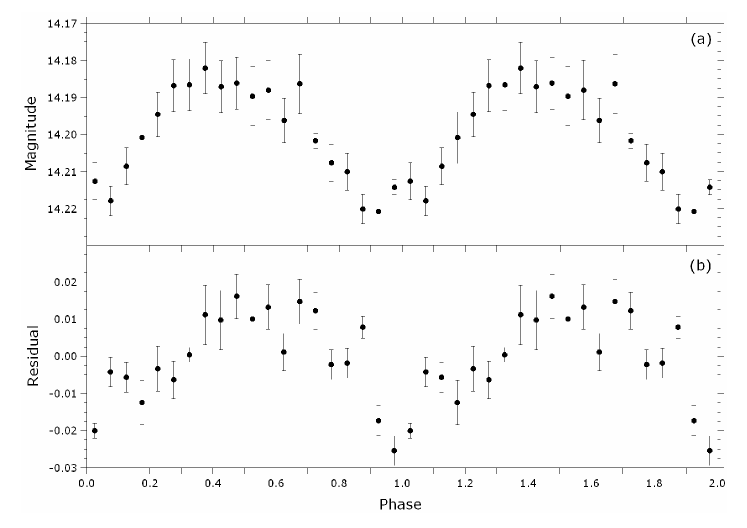
To test the reliability of the peaks found near 7 c/d, we calculated the mean magnitudes of each night and subtracted them from the observations of V1193 Ori. These power spectra are shown in Fig. 3b and Fig. 5. The strongest peak in the power spectrum corresponds to the frequency 6.9930.007 c/d (0.0001) which is consistent with found in the de-trended data. After fitting and subtracting this frequency, the strongest peak in the power spectrum of the residuals is found at the frequency 7.3420.008 c/d (0.0001) which is consistent with mentioned above. We calculated the standard error () of the power level to be 1.13 between 10-100 . By considering this standard error as the noise level, we calculated the limiting confidence level to be 4=4.52 for the power, as described above. The light curve folded on the period is presented in Fig.7a. We also fitted and subtracted a sinusoid with the period from the data. The residual light curve was folded on the period and is shown in Fig. 7b.
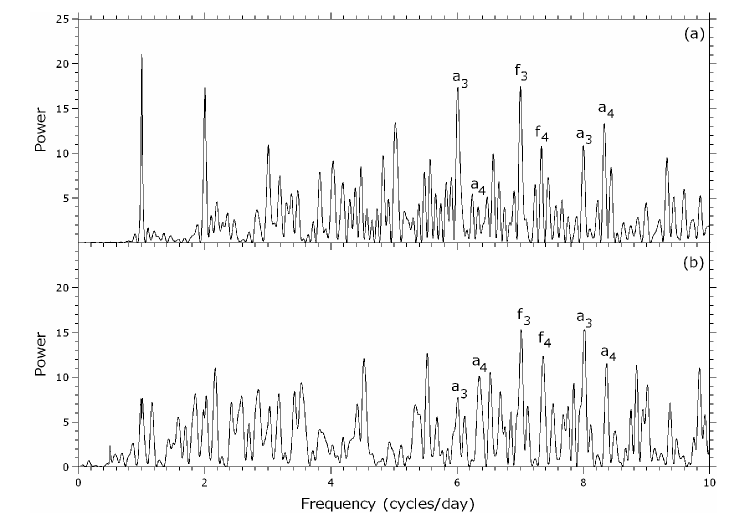
It should be noted that we also analyzed the data obtained in the two observing runs (see Section 2) separately and found that the periods mentioned above appear in both. The power spectra of the two observing runs are shown in Fig. 6.
4 Discussion and conclusions
The peak that corresponds to the frequency 6.993 c/d () in the power spectrum of V1193 Ori is consistent with the alias of the previously suggested orbital period (=, Ringwald et al., 1994; Papadaki et al., 2004) Although the difference between the two corresponding frequencies is 0.932 c/d, not exactly 1, this difference can be ascribed to the large error in the period determination from the radial velocity curve which we estimate as 0.060 c/d by reconstructing the power spectrum of the radial velocity measurements given in Ringwald et al. (1994). In the power spectrum of the radial velocities taken from Ringwald et al. (1994), the alias of 7 c/d is about 1.5 lower in power than the 6 c/d peak. According to Scargle (1982) the significance decreases exponentially, so 1.5 in power corresponds to a factor of 4.5. This means that the 7 c/d peak is 4.5 times lower in significance than the 6 c/d peak or that there is a chance of 18 (1/(4.5+1)=0.18) that the correct period is 7 c/d rather than 6 c/d. In our data the 7 c/d peak is 5 higher than the 8 c/d and 6 higher than the 6 c/d peak, so the chances that they represent the correct period are negligible (less than 1). Since most nights in our observing runs are successive and much longer than those in the previous studies, our results should be regarded more reliable. Thus, the period of found from the periodogram analysis of the photometric observations of V1193 Ori is naturally explained as the orbital period of the system. The orbital period of is above the period gap, which is located roughly between 2-3 h in the orbital period distribution of cataclysmic variables. Such an orbital period can be expected for V1193 Ori since most orbital periods of nova-like systems are above the period gap (Warner, 1995).
The 7.342 c/d frequency corresponds to a period of 0.0001, which is 5 shorter than the suggested orbital period of . Negative superhump periods are a few percent shorter than the orbital periods. The longer the orbital period is the larger the negative superhump deficit is (Patterson, 1999). The period fits this relation and thus can be understood as the negative superhump period in V1193 Ori. Negative superhumps are explained as the beat between the orbital period and the nodal precession of the disc. The aspect at which the accretion disk is seen from Earth is modulated with the precession period, giving brightness modulations with (Stanishev et al., 2002). The precession periods are typically a few days (Larwood et al., 1996; Wood, Montgomery Simpson, 2000). In this model, the relation between the orbital period, , the negative superhump period, , and the precession period of the disc, , is given by =, that is =. By choosing =6.993 c/d and =7.342 c/d from the power spectrum of V1193 Ori, we calculate a precession frequency of =0.350.02 c/d. Thus, we expect a signal with the frequency of =0.35 c/d in the light curve of V1193 Ori. This precession frequency is in good aggreement with the signal found from the de-trended data at =0.3360.008 c/d. So, we conclude that the precession period of the accretion disc in V1193 Ori is =0.07.
Positive superhumps are also observed in cataclysmic variables. They are explained as the beat between the binary motion and the precession of the disc in the apsidal plane (Patterson, 1999). The presence of permanent positive superhumps indicates a high and roughly constant mass transfer rate (e.g., Wood, Montgomery Simpson, 2000). Although positive superhumps are common in SU UMa-type dwarf novae, they have been found in a few novae and nova-like systems as well (Retter Naylor, 2000), e.g., V603 Aql (Patterson et al., 1993, 1997), V795 Her (Patterson Skillman, 1994), V1974 Cyg (Retter, Leibowitz Ofek, 1997). Positive superhumps provide good constraints on the mass-radius relation for the secondary stars in cataclysmic variables (Patterson, 1998, 2001; Patterson et al., 2003). In a few systems positive superhumps appear simultaneously with the negative superhumps (e.g., Patterson et al., 1997; Arenas et al., 2000; Retter et al., 2003). They can also be found in Algol systems (Retter, Richards Wu, 2005). The positive superhump periods are a few percent longer than the orbital periods. Patterson (see also, Retter et al., 2002) found that the period deficits in negative superhumps are about half the period excesses in positive superhumps : 0.5 , where =()/. We found a negative superhump period deficit of for V1193 Ori, which is appropriate for its orbital period (Patterson, 1999). From the relation between the negative superhump deficit and the positive superhump excess mentioned above, we expect a positive superhump excess of about for V1193 Ori. This yields a positive superhump frequency of about c/d. From our data we put an upper limit on the amplitude of a possible positive superhump of about 0.037 and 0.014 mag for the first and second runs respectively. We could not find any evidence for such a frequency in the power spectra of the light curve. Thus, we conclude that the system did not show a positive superhump in our observations or that its amplitude was below our detection limit. However, it should be kept in mind that permanent superhumps are variable. Sometimes we see only a positive superhump, sometimes only a negative superhump, and other times both (e.g., Patterson Richman, 1991; Patterson et al., 1993, 1997; Retter et al., 2003).
These are the first determinations of the superhump and the possible precession in the light curve of V1193 Ori. Further observations are needed to confirm our results.
5 Acknowledgements
We thank the anonymous referee for a thorough report and useful comments that helped improving an early version of the paper. Part of this work was supported by the Research Fund of the University of Istanbul, Project Number: BYP-723/24062005. This work was also partially supported by a postdoctoral fellowship from Penn State University.
References
- Arenas et al. (2000) Arenas, J., Catalan, M.S., Augusteijn, T. Retter, A., 2000, MNRAS 311, 135
- Bond et al. (1987) Bond, H.E., Grauer, A.D., Burstein, D. Marzke, R.O., 1987, PASP 99, 1097
- Breger et al. (1993) Breger, M., Stich, J., Garrido, R., Martin, B., Jiang, S.Y., Li, Z.P., Hube, D.P., Ostermann, W., Paparo, M., Scheck, M. 1993, AA, 271, 482
- Downes, Webbink Shara (1997) Downes, R.A., Vebbink, R.F. Shara, M.M., 1997, PASP, 109, 345
- Ferraz-Mello (1981) Ferraz-Mello, S., 1981, AJ, 86, 619
- Filippenko Ebtener (1986) Filippenko, A.V. Ebtener, K., 1986, IAUC No.4190
- Foster (1995) Foster, G., 1995, AJ, 109, 1889
- Hamuy Maza (1986) Hamuy, M. Maza, J., 1986, IBVS No.2867
- Hamuy, Maza Ruiz (1986) Hamuy, M., Maza, J., Ruiz, M.T., 1986, IAUC No.4172
- Horne Baliunas (1986) Horne, J.H. Baliunas, S.L., 1986, ApJ 302, 757
- Kuschnig et al. (1997) Kuschnig, R., Weiss, W.W., Gruber, R., Bely, P.Y. Jenkner, H., 1997, AA 328, 544
- Larwood et al. (1996) Larwood, J.D., Nelson, R.R., Papaloizou, J.C.B. Terquem, C., 1996, MNRAS 282, 597
- Papadaki et al. (2004) Papadaki, C., Boffin, H.M.J., Cuypers, J., Stanishev, V., Kraicheva, Z. Genkov, V., 2004, in Hilditch, R.W., Hensberge, H. and Pavlovski, K., eds, Spectroscopically and Spatially Resolving the Components of Close Binary Stars, ASP Conference Series, in Press
- Patterson (1998) Patterson, J., 1998, PASP 110, 1132
- Patterson (1999) Patterson, J., 1999, in Mineshige S., Wheeler C., eds, Disk Instabilities in Close Binary Systems. Universal Academic Press, Tokyo, p.61
- Patterson (2001) Patterson, J., 2001, PASP 113, 736
- Patterson Richman (1991) Patterson, J. Richman, H., 1991, PASP 103, 735
- Patterson et al. (1993) Patterson, J., Thomas, G., Skillman, D.R. Diaz, M., 1993, ApJS 86, 235
- Patterson Skillman (1994) Patterson, J. Skillman, D.R., 1994, PASP 106, 1141
- Patterson et al. (1997) Patterson, J., Kemp, J., Saad, J., Skillman, D.R., Harvey, D., Fried, R., Thorstensen, J.R. Ashley, R., 1997, PASP 109, 468
- Patterson et al. (2003) Patterson, J., Thorstensen, J.R., Kemp, J., Skillman, D.R., Vanmunster, T., Harvey, D.A., et al., 2003, PASP 115, 1308
- Retter, Leibowitz Ofek (1997) Retter, A., Leibowitz, E.M., Ofek, E.O. 1997, MNRAS, 286, 745
- Retter, Naylor Leibowitz (1999) Retter, A., Naylor, T. Leibowitz, E.M., 1999, ”Novae Crossing the Thermal Stability Line”, in Disk Instabilities in Close Binary Systems, 25 Years of Disk-Instability Model, ed. S. Mineshige, C. Wheeler (Universal Academy Press Inc.: Tokyo), 91
- Retter Naylor (2000) Retter, A. Naylor, T. 2000, MNRAS, 319, 510
- Retter et al. (2002) Retter, A., Chou, Y., Bedding, T.R. Naylor, T., 2002, MNRAS 330, L37
- Retter et al. (2003) Retter, A., Hellier, C., Augusteijn, T., Naylor, T., Bedding, T. R., Bembrick, C., McCormick, J., Velthuis, F., 2003, MNRAS, 340, 679
- Retter, Richards Wu (2005) Retter, A., Richards, M.T. Wu, K., 2005, ApJ 621, 417
- Ringwald, Thorstensen Hamwey (1994) Ringwald, F.A., Thorstensen, J.R. Hamwey, R.M., 1994, MNRAS 271, 323
- Roberts, Lehar Dreher (1987) Roberts, D.H., Lehar, J. Dreher, J.W., 1987, AJ 93, 968
- Scargle (1982) Scargle, J., 1982, ApJ 263, 835
- Sperl (1998) Sperl, M., 1998, Comm. Astr. Seis., 111
- Stanishev et al. (2002) Stanishev, V., Kraicheva, Z., Boffin, H.M.J. Genkov, V., 2002, AA, 394, 625
- Warner (1995) Warner, B. 1995, Cataclysmic Variable Stars, Cambridge Univ. Press, Cambridge
- Warner and Nather (1988) Warner, B. Nather, R.E., 1988, IBVS No.3140
- Wood, Montgomery Simpson (2000) Wood, M.A., Montgomery, M.M. Simpson, J.C., 2000, ApJ 535, L39