The Hamburg/SAO survey for emission–line galaxies
We present the sixth list with results††thanks: Tables 4 to 8 are only available in electronic form at the CDS via anonymous ftp to cdsarc.u-strasbg.fr (130.79.128.5) or via http://cdsweb.u-strasbg.fr/Abstract.html. Figures A1 to A13 will be made available only in the electronic version of the journal. of the Hamburg/SAO Survey for Emission-Line Galaxies. The final list resulted from follow-up spectroscopy conducted with the 4.5 m MMT telescope in 1996, and with 2.2 m CAHA and 6 m SAO telescopes in 2000 to 2003. The data of this snap-shot spectroscopy survey confirmed 134 emission-line objects out of 182 observed candidates and allowed their quantitative spectral classification and redshift determination. We classify 73 emission-line objects as definite or probable blue compact or Hii galaxies (BCG), 8 as QSOs, 4 as Seyfert 1 and 2 galaxies. 30 low-excitation objects were classified as definite or probable starburst nuclei (SBN), 3 as dwarf amorphous nuclei starburst galaxies (DANS) and 2 as LINERs. Due to the low signal-to-noise ratio we could not classify 14 ELGs (NON). For another 9 galaxies we did not detect any significant emission lines. For 98 emission-line galaxies, the redshifts and/or line intensities are determined for the first time. For the remaining 28 previously-known ELGs we give either improved data the line intensities or some independent measurements. The detection rate of ELGs is 70%. This paper completes the classification of strong-lined ELGs found in the zone of the Hamburg/SAO survey. Together with previously known BCG/H ii galaxies in this zone, this sample of 500 objects is the largest to date in a well bound region.
Key Words.:
surveys – galaxies: fundamental parameters – galaxies: distances and redshifts – galaxies: starburst – galaxies: compact – quasars: redshifts| Date | Telescope | Instrument | Grating, | Wavelength | Dispersion | Observed |
|---|---|---|---|---|---|---|
| grism | range [Å] | [Å/pixel] | number | |||
| (1) | (2) | (3) | (4) | (5) | (6) | (7) |
| 20.05.1996 | 4.5 m MMT | MMT Spect | R300 | 3700–7400 | 3.2 | 42 |
| 11-12.04.2000 | 6 m BTA | LSS | R325 | 3600–7600 | 4.6 | 24 |
| 25.05.2000 | 6 m BTA | LSS | R325 | 3600–7600 | 4.6 | 1 |
| 28.06-04.07.2000 | 2.2 m CAHA | CAFOS | G-200 | 3700–9500 | 4.5 | 54 |
| 03.10-31.10.2000 | 6 m BTA | LSS | R651 | 3700–6000 | 2.3 | 5 |
| 17.01-20.01.2001 | 6 m BTA | LSS | R651 | 3700–6000 | 2.3 | 16 |
| 16-19.02.2002 | 6 m BTA | LSS | R400 | 3700–7600 | 3.8 | 15 |
| 14-15.02.2002 | 2.2 m CAHA | CAFOS | G-200 | 3700–9500 | 4.5 | 14 |
| 10.12-13.12.2002 | 6 m BTA | LSS | R400 | 3700–7600 | 3.8 | 10 |
| 24.12.2003 | 6 m BTA | LSS | R400 | 3700–7600 | 3.8 | 4 |
| Candidate Sample | N | BCG | Other | QSO | Galaxies | Stars | Not | |
|---|---|---|---|---|---|---|---|---|
| & | ELGs | without | Classified | |||||
| BCG? | emission | |||||||
| First priority | new | 36 | 21 | 8 | 1 | 1 | 4 | 1 |
| already known | 40 | 31 | 9 | – | – | – | – | |
| total | 76 | 52 | 17 | 1 | 1 | 4 | 1 | |
| Second priority | new | 77 | 11 | 17 | 6 | 8 | 22 | 12 |
| already known | 29 | 9 | 20 | 1 | – | – | – | |
| total | 106 | 20 | 37 | 7 | 8 | 22 | 12 | |
| Objects presented in this paper | 182 | 72 | 54 | 8 | 9 | 26 | 13 | |
1 Introduction
The problem of creating large, homogeneous and deep samples of actively star-forming low-mass galaxies is very important for several applications in studies of galaxy evolution and spatial distribution. Several earlier projects, based on objective prism plates, like the Second Byurakan Survey (SBS) (Markarian et al. Markarian83 (1983), Stepanian Stepanian94 (1994)), the University of Michigan (UM) survey (e.g., Salzer et al. Salzer89 (1989)) and the Case survey (Pesch et al. Pesch95 (1995), Salzer et al. Salzer95 (1995), Ugryumov et al. Ugryumov98 (1998)), as well as some others (e.g., Kitt Peak International Spectral Survey – KISS, Salzer et al. KISS (2000), based on CCD detector registration) identified several thousand emission-line galaxies. The Hamburg/SAO survey (HSS) creates a new very large homogeneous sample of such galaxies in the region of the Northern sky with an area of some 1700 square degrees. It was initiated, in particular, in order to close the gap between the sky regions of the SBS and the original Case survey, and as a result to get the combined sample of low-mass emission-line galaxies in a very large section of sky suitable for the study of their spatial distribution.
The basic outline of the HSS and its first results are described in Paper I (Ugryumov et al. Ugryumov99 (1999)), while the additional results from the follow-up spectroscopy are given in papers II, III, IV and V (Pustilnik et al. Pustilnik99 (1999), Hopp et al. Hopp00 (2000), Kniazev et al. Kniazev01 (2001), Ugryumov et al Ugryumov01 (2001)). In this, the last paper, we present the results of the follow-up spectroscopy of another 182 objects selected on the Hamburg Quasar Survey (HQS) prism spectral plates as ELG candidates. In Table 2 we show the breakdown of these objects in the samples of the 1st and 2nd priority group, and the categories of detected objects as described below. Out of 134 emission-line objects (galaxies and QSOs) 69 were known as NED objects. For 28 of these galaxies either only redshift, or also some information on emission lines was known, mainly from the previous HSS papers. We included such objects in the presented list since we provide either significantly improved data or some independent measurements.
The article is organized as follows. In section 2 we give the details of the spectroscopic observations and of the data reduction. In section 3 the results of the observations are presented in several tables. In section 4 we briefly discuss the new data and summarize the current state of the Hamburg/SAO survey. Throughout this paper a Hubble constant H0 = 75 km s-1 Mpc-1 is used.
2 Spectral observations and data reduction
2.1 Observations
The results presented here were obtained mostly in snap-shot observing mode during one run with the 4.5 m Multiple Mirror Telescope (MMT), two runs with the Calar Alto 2.2 m and seven runs with the SAO 6 m (BTA) telescopes (see Table 1).
2.2 Observations with the MMT 4.5 m telescope
The observations were carried out on May 20, 1996, with the Red Channel of the MMT Spectrograph through the long slit of 15180′′. The 300 grooves mm-1 grating in first order provides a dispersion of 3.2 Å pixel-1, and a spectral resolution FWHM of about 10 Å. To avoid second-order contamination, a L-38 blocking filter was used. The total spectral range was 3700–7400 Å. The spectra were rebinned by a factor of 2 along the spatial axis. Hence, the spatial sampling was 06 pixel-1.
Short exposures (3–5 minutes) were taken in order to detect strong emission lines to allow redshift measurements and a crude classification. The slit was not oriented along the parallactic angle because of the snap-shot observing mode. Reference spectra of an Ar–Ne–He lamp were recorded to provide wavelength calibration. Spectrophotometric standard stars from Oke (Oke90 (1990)) and Bohlin (Bohlin96 (1996)) were observed at the beginning and at the end of the night for flux calibration. The dome flats, bias, dark and twilight sky frames were accumulated each night. The weather conditions were photometric, with seeing variations around 10 (FWHM).
2.3 Calar Alto 2.2 m telescope observations
Follow-up spectroscopy with the CAHA 2.2 m telescope was carried out during two runs (June-July 2000 and February 2002), using the Calar Alto Faint Object Spectrograph (CAFOS). During these runs a long slit of and a G-200 grism (187 Å mm-1, first order) were used. The spatial scale along the slit was pixel-1. A SITE 15 2K2K CCD was operated without binning. The wavelength coverage was 3700 – 9500 Å with maximum sensitivity at 6000 Å. The spectral resolution was 12–16 Å (FWHM). The slit orientation was not aligned with the parallactic angle because of the snap-shot observing mode. The exposure times varied within minutes depending on the object brightness and weather conditions. The observations were complemented by standard star flux measurements (Oke Oke90 (1990), Bohlin Bohlin96 (1996)), reference spectra (Hg–Cd lamp) for wavelength calibration, dome flat, bias and dark frames. In the run of June-July 2000 the weather conditions were photometric most of the time with a seeing 1.5″ (FWHM). During one night of this run, as well as during two nights in February 2002, the weather conditions were variable with a seeing of 3″ – 4″. The measurements in these nights are marked by “” in Table 5.
There was no order separation filter applied, therefore some second order contamination by the object UV light might be present at wavelengths longer than 7200 Å. However, as can be directly seen from the presented spectra, this effect is probably small, since it is undetectable in the continuum behavior around 7200 Å. In principle, one could expect an increase of the line fluxes at wavelengths longer than this due to the second order contamination in the spectra of the flux calibrating stars. There are seven objects whose emission line ratios could be potentially affected. These objects are listed and commented at the end of section 3.1.
2.4 BTA 6 m telescope observations
The observations with the 6 m telescope (BTA) of the Special Astrophysical Observatory of Russian Academy of Sciences (SAO RAS) were performed mainly as a back-up program. Therefore the weather conditions in most cases were rather poor. The seeing in the majority of the nights was in the range of 2″ to 4″ (FWHM) and/or the transparency was variable. Results obtained under non-photometric conditions are marked by “” in Table 5. In all cases we used the long slit spectrograph (LSS) in the BTA prime focus (Afanasiev et al. Afanasiev95 (1995)) with a Photometrics 1K1K CCD detector with 24 m pixel size. The long slit of 120″ was used with the slit width of either 15 or 20, depending on the seeing and grating. Three set-ups with the gratings of 325, 400 and 651 grooves mm-1 were used during various runs. The wavelength ranges of the spectra covered for different set-ups and their samplings in Å pixel-1 are given in Table 1. The respective effective resolutions were 14 Å, 11 Å and 7 Å.
Reference spectra of an Ar–Ne–He lamp were recorded before or after each observation to provide wavelength calibration. Spectrophotometric standard stars from Bohlin (Bohlin96 (1996)) were observed for flux calibration. All observations were conducted mainly with the software package NICE in MIDAS, described by Kniazev & Shergin (Kniazev95 (1995)).
2.5 Data reduction
The reduction of all data was performed at SAO using the standard reduction systems MIDAS111 MIDAS is an acronym for the European Southern Observatory package – Munich Image Data Analysis System. and IRAF222IRAF is distributed by National Optical Astronomical Observatory, which is operated by the Association of Universities for Research in Astronomy, Inc., under cooperative agreement with the National Science Foundation.
The MIDAS command FILTER/COSMIC was found to be a quite successful way to automatically remove all cosmic ray hits from the images. After that we applied the IRAF package CCDRED for bad pixel removal, trimming, bias-dark subtraction, slit profile and flat-field corrections.
To do accurate wavelength calibration, correction for distortion and tilt for each frame, sky subtraction and correction for atmospheric extinction, the IRAF package LONGSLIT was used.
To obtain an instrumental response function from observed spectrophotometric flux standards, we first extracted the apertures of standard stars. Then the determined sensitivity curve was applied to perform flux calibration for all object images. Finally we extracted one-dimensional spectra from the flux calibrated images. When more than one exposure was taken with the same setup for a given object, the extracted spectra were co-added and a mean vector was calculated. When several observations with different setups (telescopes or grisms) for the same object were obtained, the data were reduced and measured independently and the more accurate values were taken.
To speed-up and facilitate the line measurements we employed the dedicated command files created at SAO using the FIT context and MIDAS command language. The procedures for the measurements of line parameters and redshifts applied were also described in detail in Papers III, IV and in Kniazev et al. (Kniazev04 (2004)).
3 Results of follow–up spectroscopy
In Table 2 we present the summary of the observation results. 182 candidates were selected from our first and second priority samples introduced in Paper IV.
Out of 76 first priority candidates (objects showing a clear density peak near 5000 Å and a blue continuum on the HQS prism spectral plates), 36 objects appeared in our list as new ones. 40 objects were listed in the NED as galaxies or objects from various catalogs and 4 of them already had information on emission lines and redshifts in earlier publications. Apart from these 4 objects, 24 more of the mentioned 40 NED galaxies have appeared in our previous HSS papers, but had data of rather low quality. All such objects were included in our observing program in order to improve spectral information. The comparison of our measured velocities with those of galaxies with already known redshift shows acceptable consistency for most objects in common within the uncertainties given. However, for five galaxies originally appearing in the HSS List II, the difference found is as high as 200–300 km s-1, which probably indicates the lower accuracy of some radial velocities from that list.
The remaining 106 observed objects were taken from the list of the second priority candidates, those with less prominent emission features on the high resolution spectra (HRS) obtained after scanning the original HQS objective prism plates. As described in Paper IV, we created from this list the “APM selected sample”, which uses additional information for the selection. The “APM selected” sample comprises second priority candidates which are classified as non-stellar (at least in one of two filters) on Palomar Sky Survey plates (PSS) in the APM database, and have a blue colour according to the APM colour system ( 1.0). Here we give the spectral data for 64 of them, that looked like ELGs or QSOs. 31 more 2nd priority candidates were classified as stars or galaxies without emission, and 12 objects with no emission lines were not classified at all due to poor S/N ratio spectra.
3.1 Emission-line galaxies
The parameters of the 126 observed emission line galaxies are listed in
Table 4, containing the following information:
column 1: Number in the Table.
column 2: The object’s IAU-type name with the prefix HS.
column 3: Right ascension for equinox B1950.
column 4: Declination for equinox B1950.
The coordinates were measured on direct plates of the HQS
and are accurate to 2 (Hagen et al. Hagen95 (1995)).
column 5: Heliocentric velocity and its r.m.s. uncertainty in
km s-1.
column 6: Apparent B-magnitude obtained by calibration of the digitized
photoplates with photometric standard stars (Engels et al. Engels94 (1994)),
having an r.m.s. accuracy of for objects fainter than
mB = (Popescu et al. Popescu96 (1996)).
Since the algorithm to calibrate the objective prism spectra is
optimized for point sources, the brightnesses of extended galaxies are
underestimated. The resulting systematic uncertainties are expected to
be as large as 2 mag (Popescu et al. Popescu96 (1996)). For about 30%
of our objects, B-magnitudes are unavailable at the moment. We present
for them blue magnitudes obtained from the APM database. They are
marked by a “*” before the value in the corresponding
column. According to our estimate they are systematically brighter by
than the B-magnitudes obtained by calibration of the
digitized photoplates (r.m.s. ).
column 7: Absolute B-magnitude, calculated from the apparent
B-magnitude and the heliocentric velocity.
No correction for galactic extinction is made because all objects are
located at high galactic latitudes and the corrections are significantly
smaller than the uncertainties in the magnitudes.
column 8: Preliminary spectral classification type according to
the spectral data presented in this article. BCG means a galaxy
possessing a characteristic Hii-region spectrum with low enough
luminosity (M20m). SBN and DANS are galaxies of lower
excitation with a corresponding position in the line ratio diagnostic
diagrams, as discussed in Paper I. SBN are the brighter fraction of this
type. Here we follow the notation of Salzer et al. (Salzer89 (1989)).
The non-confident classification is followed by ”?”.
Three objects (HS 0807+4103, HS 1525+4344, HS 1627+3625)
were recognized as Sy 1 galaxies due to the presence of broad Balmer lines
and broad [Feii] emission. HS 1644+3934 was recognized as a
Seyfert 2 galaxy.
The typical spectrum of low-ionization nuclear emission-line regions
(LINERs) is identified for 2 galaxies.
14 ELGs are difficult to classify, mainly due to low S/N. They are coded
as NON.
column 9: One or more alternative names, according to the
information from NED.
References are given to the other sources of the
redshift-spectral information indicating that a galaxy is an ELG.
The spectra of all emission-line galaxies are shown in Appendix A, which is available only in the electronic version of the journal.
The results of line flux measurements are given in Table 5
which contains the following information:
column 1: Number in the Table.
column 2: The object’s IAU-type name with the prefix HS.
Asterisks refer to the objects observed during non-photometric
conditions.
column 3: Designation of the telescope with which the spectral data
were obtained. ‘B’ means BTA, ‘C’ - Calar Alto 2.2 m telescope, and ‘M’
- MMT.
column 4: Observed flux (in
10-16 erg s-1 cm-2) of the H line.
The accuracy of this and other parameters varies substantially over
the whole table. We divided the relative errors into four intervals:
5%, (5–10)%, (10–20)% and (20–50)%. They are marked by the
respective superscripts , , and right of each table entree.
For about 40% of ELGs the Balmer absorptions from the underlying
stellar population can somewhat affect the measured H emission flux
and the related flux ratios. These objects are marked with “”.
For several objects with non-detected H emission line, the
fluxes are given for H and marked by a “”.
columns 5,6,7: The observed flux ratios [Oii]/H,
[Oiii]/H and H/H.
columns 8,9: The observed flux ratios
[Nii] 6583 Å/H, and
([Sii] 6716 Å + 6731 Å)/H.
columns 10,11,12: Equivalent widths of the lines
[Oii] 3727 Å, H and
[Oiii] 5007 Å.
Below we give comments on some specific cases:
HS 1010+4907 and HS 1009+4906 comprise a compact group
(50 kpc in extent) with a fainter galaxy without evident emission
lines, namely HS 1010+4906 (see Table 7).
HS 1353+4706 was classified as an M-star in Paper I
(Ugryumov et al. Ugryumov99 (1999)). However, it was suspected that
a wrong object had been observed about 03 away. This object
will be referred to as HS 1353+4706A.
The new observations indeed revealed that HS 1353+4706B is a very strong-lined
BCG with very low metallicity (12+(O/H) = 7.630.03; see Pustilnik
et al. 2004b ).
The M-dwarf HS 1353+4706A has B1950 coordinates
13 53 25.2 +47 06 46 and its brightness is B18.7.
Seven galaxies observed with the Calar Alto 2.2 m telescope have H,
[N ii] or [S ii] lines at 7200 Å. Their fluxes
can be affected by the second order contamination as pointed out in Sect.
2.3. For these galaxies (1231+4349, 1235+4108, 1426+3658, 1437+3724,
1439+3704, 1525+4344 and 1614+4450) the affected parameters in
Table 5 can be either the ratio F(H)/F(H), or the
line flux F(H), if H was not detected. For the ratios of
F([N ii])/F(H) and F([S ii])/F(H) the effect
should be minor since these lines are close in wavelength.
3.2 Quasars
The main criteria applied to search for BCGs are blue continuum near 4000 Å and a strong emission line, the expected doublet [Oiii] 4959,5007 Å, in the wavelength region between 5000 Å and the sensitivity break of the Kodak IIIa-J photoemulsion near 5400 Å (see Paper I). For this reason faint QSOs with Ly 1216 Å redshifted to 3, or with Civ 1549 Å redshifted to 1.7, or with Mgii 2798 Å redshifted to 0.8 could be selected as BCG candidates. In Papers I–V we reported the discovery of a number of such faint QSOs. They were missed by the Hamburg Quasar Survey since it is restricted to bright QSOs (B ). Here we report the discovery of eight faint (B ) QSOs. For four of them we identified Ly 1216 Å redshifted to 3 as the line responsible for its selection. Two objects (HS 1608+3546 and HS 1714+4202) show a broad emission line tentatively identified as Mgii 2798 Å at 0.83–0.84. Two more quasars with were selected due to the line Civ 1549 Å. Since for HS 1203+3811 only one broad line is seen in a rather poor S/N ratio spectrum, its identification as Ly should be considered as tentative. The data for all eight quasars are presented in Table 6. Finding charts and plots of their spectra can be found on the www-site of the Hamburg Quasar Survey (http://www.hs.uni-hamburg.de/hqs.html).
3.3 Non-emission-line objects
In total, for 49 candidates no (trustworthy) emission lines were detected. We divided them into three categories.
3.3.1 Absorption-line galaxies
For nine non-emission line objects the signal-to-noise ratio of our spectra was sufficient to detect absorption lines, allowing the determination of redshifts. The data are presented in Table 7.
3.3.2 Stellar objects
To separate the stars among the objects with no detectable emission lines, we cross-correlated a list of the most common stellar features with the observed spectra. In total, 26 objects with definite stellar spectra and redshifts close to zero were identified. All of them were crudely classified in categories from definite A-stars to G-stars, with most of them intermediate between A and F. The data for these stars are presented in Table 8.
3.3.3 Non-classified objects
It was not possible to classify 13 objects without emission lines. Their spectra have too low signal-to-noise ratio to detect trustworthy absorption features, or the EWs of their emission lines are too small.
4 Discussion
4.1 The sixth list
As a result we have 182 observed candidates preselected on HQS objective prism plates, out of which 76 were first priority candidates and 106 were second priority. 134 objects (73 % of the total) are found to be either ELGs (126) or quasars (8). 24 of these ELGs were presented in the previous HSS papers, and were reobserved in order to improve the data quality.
Seventy two out of 126 ELGs (57 %) were classified based on the character of their spectra and their luminosity as Hii/BCGs or probable BCGs.
14 ELGs are difficult to classify due to their poor signal-to-noise spectra. Six more ELGs were classified as Active Galactic Nuclei (AGN): 4 as Seyfert galaxies and 2 as LINERs. The remaining 33 ELGs are objects with low excitation: either starburst nuclei galaxies (SBN and probable SBN) or their lower mass analogs – dwarf amorphous nuclear starburst galaxies (DANS or probable DANS).
4.2 Brief summary of the HSS for ELGs
Summarizing the results of the Hamburg/SAO survey presented in Papers I through VI, we discovered altogether, from the 1-st priority candidates, 463 new emission-line objects (26 of them are QSOs). For 100 more ELGs known from the literature (NED) we obtained quantitative data for their emission lines. The total number of confident or probable blue compact/Hii-galaxies is 387. Relative to all observed 537 ELGs the fraction of BCGs is 72%.
42 more new BCGs and 56 other ELGs are found among the second priority candidates. Along with the BCGs selected from the HSS candidates, but not observed by us since they already were known from other surveys in this region, the total number of BCGs in the sky region covered by the HSS (1700 sq.degrees of a single piece of sky) reaches 500. This constitutes the largest and deepest BCG sample in both hemispheres and will be presented elsewhere as a separate publication. The assembly and verifying of the whole HSS database is underway, and the most up-dated version of this will appear at: http://precise.sao.ru.
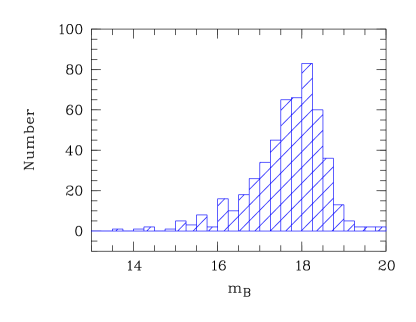
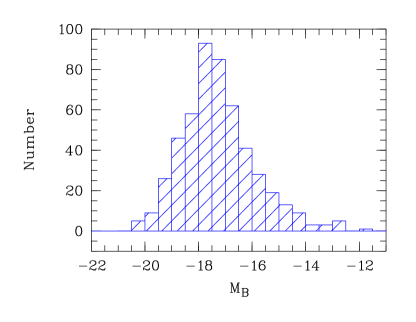
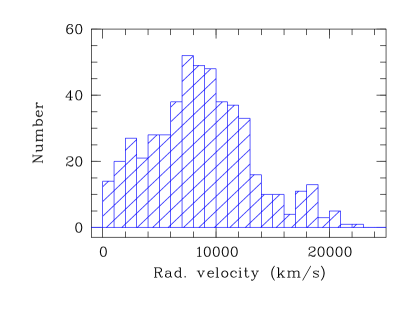
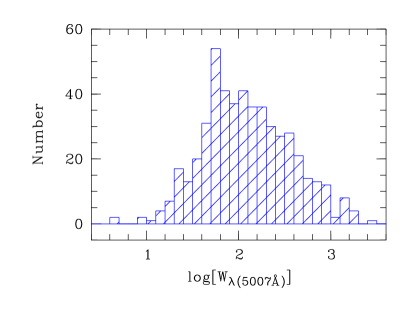
In Figure 1(a-d) we show the distributions of radial velocities, apparent and absolute magnitudes and EWs([O iii] 5007) for all found BCGs or BCGs? in the zone of HSS (506 objects, including also the galaxies, selected by us as the HSS candidates, but not observed in this project due to lack of observing time; these objects were already known/classified and had redshift data). The latter group comprises about 70 galaxies which came mainly from the papers by Peimbert & Torres-Peimbert (PTP92 (1992)), Vogel et al. (Vogel93 (1993)), Popescu et al. (Popescu96 (1996, 1997, 1998)), Ugryumov et al. (Ugryumov98 (1998)), Popescu & Hopp (Popescu00 (2000)) and some unpublished data on BCGs in the SBS zone, partly intersecting the HSS zone.
Since for most of the sample galaxies the total -band magnitudes are not available, we used their photographic blue magnitudes from the Palomar Sky Survey, as provided in the APM database (Automatic Plate-measuring Machine at Cambridge, Irwin Irwin98 (1998)), and calibrated them through the sample of about a hundred BCGs with CCD-measured total magnitudes. We obtained the linear regression of:
| (1) |
in the range of from 14 to 19.5, with the standard deviation of residuals of 0.43 mag. These magnitudes were used as a first approximation to more accurate data in order to estimate absolute magnitudes and to look at the distributions of the sample galaxies of these parameters.
| Parameter | Number | Mean | Median | 80% |
| of BCGs | interval | |||
| Btot (mag) | 506 | 17.66 | 17.81 | 16.51,18.59 |
| MB (mag) | 506 | –17.25 | –17.40 | –15.40,–18.89 |
| Vhel (km s-1) | 506 | 8471 | 8752 | 2695,14976 |
| EW(5007)(Å) | 502 | 122 | 113 | 33,524 |
4.3 Use of the HSS ELG sample
Since the new BCG sample is the largest sample of low-mass galaxies and is well situated on the sky, it can be used for several purposes. First, as it was assumed in planning this survey, such a sample is suitable to address the problem of the spatial distribution of low-mass galaxies relative to the structures delineated by bright galaxies. A more detailed study of the already-known differences between luminous and faint galaxies (e.g., Salzer S89 (1989); Pustilnik et al. PULTG (1995); Popescu et al. Popescu97 (1997)) could help to gain a deeper understanding of the CDM structure N-body simulations (e.g., such as by Mathis & White MW02 (2002) and Gottlöber et al. Gott03 (2003)).
One of the aims of the HSS project was to close the gap between the sky regions of the SBS and Case survey. This goal has now been reached. Since the HSS has intersections with both, the possible differences in their selection functions and other sample characteristics can be quantified and accounted for. Thus, the useful ranges of galaxy parameters for which ELGs can be studied in the whole region of sky covered by the SBS, HSS and Case will be obtained.
Another important aspect of the BCG studies is related to the starburst triggering mechanisms. It can be addressed with the HSS sample to check the preliminary conclusion about the important role of galaxy interactions made, e.g., on the large sample of the SBS BCGs (Pustilnik et al. Pustilnik01 (2001)). Similar studies have been conducted on the samples from the 2dF Survey project by Lambas et al. (Lambas03 (2003)) and Alonso et al. (Alonso04 (2004)).
One more interesting aspect of statistical studies of this BCG sample is related to the high S/N ratio spectra of the subsample of the most strong-lined ELGs. This allows us to determine in a large sample of galaxies the abundance of oxygen and other heavy elements by the classic method, and to use these data to compare the BCG properties with the models of galaxy chemical evolution. We already obtained such data for a significant fraction of the HSS BCG sample (15% of all BCG and 40 % BCGs with the EW([O iii]5007) 150 Å, Pustilnik et al. 2004b ). Some of the strong-lined HSS BCGs were used in the new primordial helium determination (Izotov & Thuan IzTh04 (2004)).
One of the goals of the HSS project was to search for new extremely metal-deficient (XMD) BCGs (those with 12+(O/H) 7.65), possible analogs of candidate young galaxies, like I Zw 18 and SBS 0335–052. Altogether, in addition to the two XMD galaxies in this zone known from previous studies (1415+437=CG 389 and 1224+3756=CG 1024), eight new such galaxies are found (see papers by Kniazev et al. KPU98 (1998); 2000a ; 2000b , Pustilnik et al. 2004a ; 2004b , Guseva et al. Guseva03 (2003)). Thus, the fraction of XMD BCGs at the magnitude limit of the HSS is 2% (as already claimed by Pustilnik et al. Kiel02 (2003)), about 1.5 times higher than the fraction found by Kniazev et al. (Kniazev03 (2003)) for the Sloan Digital Sky Survey (SDSS). While we are dealing with small samples in either case, which makes this ratio uncertain, the ratio still indicates that we succeeded in creating a design for the HSS which is more sensitive in finding XMD BCGs than general galaxy surveys like the SDSS.
5 Conclusions
We performed the follow-up spectroscopy of the sixth and last list of candidates for ELGs (mainly of H ii type) from the Hamburg/SAO Survey. Summarizing the results, the analysis of the spectral information and the discussion above we draw the following conclusions:
-
•
The methods to detect ELG candidates on the plates of the Hamburg Quasar Survey give a reasonably high detection rate of H ii type emission-line objects. In total, within the two defined priority categories, 182 objects were observed, 27 of which were already known as ELGs. Among the remaining 155 objects we found 107 emission-line objects corresponding to a detection rate of 68 %.
-
•
Besides ELGs we also found 8 new quasars, with either Ly, or Civ1549, or Mgii2798 in the wavelength region Å near the red boundary of the IIIa-J photoplates (z 3, 1.7 and 0.8, respectively).
-
•
The fraction of BCG/Hii galaxies among all new observed ELGs (about 43 %) is lower in this paper compared to the previous parts of the HSS since about 2/3 of the observed candidates came from the second priority list.
-
•
This list completes the classification work on the strong-lined ELGs in the zone of the Hamburg/SAO survey. Together with previously-known BCG/H ii galaxies in this zone, this sample of 500 objects is the largest one made to date in a well bound region.
Acknowledgements.
This work was supported by the grant of the Deutsche Forschungsgemeinschaft No. 436 RUS 17/77/94 and by the Russian Federal Program ”Astronomy”. U.A.V. is very grateful to the staff of the Hamburg Observatory for their hospitality and kind assistance. Support by the INTAS grant No. 96-0500 is gratefully acknowledged. I.M. and J.M. acknowledge financial support by DGICyT grants AYA2001-2089 and AYA2003-00128 and the Junta de Andalucía. The authors thank the anonymous referee for useful comments and suggestions. The use of APM facility was very important for selection methods for additional candidates to BCGs from the 2nd priority list. This research has made use of the NASA/IPAC Extragalactic Database (NED) which is operated by the Jet Propulsion Laboratory, California Institute of Technology, under contract with the National Aeronautics and Space Administration. We have also used the Digitized Sky Survey, produced at the Space Telescope Science Institute under government grant NAG W-2166.References
- (1) Afanasiev, V.L., Burenkov, A.N., Vlasyuk, V.V., Drabek, S.V. 1995, SAO RAS internal report, No. 234
- (2) Alonso, M.S., Tissera, P.B., Coldwell, G. & Lambas, D.G. 2004, MNRAS, 352,1081
- (3) Bade, N., Engels, D., Voges, W., et al. 1998, A&AS, 127, 145
- (4) Bohlin, R. C. 1996, AJ, 111, 1743
- (5) Engels, D., Cordis, L., & Köhler, T. 1994, Proc. IAU Symp. 161, ed. H. T. MacGillivray (Kluwer: Dordrecht), 317
- (6) Gottlöber, S., Lokas, E., Klypin, A., Hoffman, Y. 2003, MNRAS, 344, 715
- (7) Grupe, D., Beuermann, K., Thomas, H.-C., Mannheim, K., Fink, H.H. 1998, A&A, 330, 25
- (8) Guseva, N.G., Papaderos, P., Izotov, Y.I., et al. 2003, A&A, 407, 91
- (9) Hagen, H.-J., Groote, D., Engels, D., & Reimers, D. 1995, A&AS, 111, 195
- (10) Hopp, U., Engels, D., Green, R., et al. 2000, A&AS, 142, 417 (Paper III)
- (11) Huchra, J.P., Geller, M.J., & Corwin, H.G. Jr. 1995, ApJS, 99, 391
- (12) Irwin, M. 1998, http://www.ast.cam.ac.uk/∼apmcat/
- (13) Izotov, Y.I., & Thuan, T.X. 2004, ApJ, 602, 200
- (14) Kniazev, A.Y., & Shergin, V.S. 1995, SAO RAS internal report, 249, 1
- (15) Kniazev, A.Y., Pustilnik, S.A., Ugryumov, A.V. 1998, Bulletin SAO, 46, 23
- (16) Kniazev, A.Y., Pustilnik, S.A., Ugryumov, A.V., & Kniazeva, T.F. 2000a, Astronomy Letters, 26, 129
- (17) Kniazev, A.Y., Pustilnik, S.A., Masegosa, J., et al. 2000b, A&A, 357, 101
- (18) Kniazev, A.Y., Engels, D., Pustilnik, S.A. et al. 2001, A&A, 366, 771 (Paper IV)
- (19) Kniazev, A.Y., Grebel, E.K., Lei Hao, et al. 2003, ApJ, 593, L73
- (20) Kniazev, A.Y., Pustilnik, S.A., Grebel, E.K., Lee, H., & Pramskij, A.G. 2004, ApJS, 153, 429
- (21) Lambas, D.G., Tissera, P. B., Alonso, M. S., & Coldwell, G. 2003, MNRAS, 346, 1189
- (22) Markarian, B.E., Lipovetsky, V.A., & Stepanian, J.A. 1983, Afz, 19, 29
- (23) Mathis, H. & White, S.D.M. 2002, MNRAS, 337, 1193
- (24) Oke, J.B. 1990, AJ, 99, 1621
- (25) Peimbert, M., & Torres-Peimbert, S. 1992, A&A, 253, 349
- (26) Pesch, P., Stephenson, C.B., & MacConnell, D.J. 1995, ApJS, 98, 41
- (27) Popescu, C. C., & Hopp, U. 2000, A&AS, 142, 247
- (28) Popescu, C.C., Hopp, U., Hagen, H.-J., & Elsässer, H. 1996, A&AS, 116, 43
- (29) Popescu, C.C., Hopp, U., & Elsässer, H. 1997, A&A, 325, 881
- (30) Popescu, C.C., Hopp, U., Hagen, H.-J., Elsässer, H. 1998, A&AS, 133, 13
- (31) Pustilnik, S.A., Ugryumov, A.V., Lipovetsky, V.A., Thuan, T.X., & Guseva, N.G. 1995, ApJ, 443, 499
- (32) Pustilnik, S.A., Engels, D., Ugryumov, A.V., et al. 1999, A&AS, 135, 299 (Paper II)
- (33) Pustilnik, S.A., Kniazev, A.Y., Lipovetsky, V.A., & Ugryumov, A.V. 2001, A&A, 373, 24
- (34) Pustilnik, S.A., Kniazev, A.Y., Pramskij, A.G., & Ugryumov, A.V. 2003, Proc. of Euroconference ”The evolution of galaxies. III. From simple approaches to self-consistent models”, Kiel, Germany, July 2002, ApSS, 284, 795
- (35) Pustilnik, S.A., Kniazev, A.Y., Pramskij, A.G. et al. 2004a, A&A, 419, 469
- (36) Pustilnik, S.A., Kniazev, A.Y., Pramskij, A.G., et al. 2004b, A&A, in preparation
- (37) Salzer, J.J. 1989, ApJ, 347, 152
- (38) Salzer, J.J., MacAlpine, G.M., & Boroson, T.A. 1989, ApJS, 70, 479
- (39) Salzer, J.J., Moody, J.W., Rosenberg, J.L., Gregory, S.A., & Newberry, M.V. 1995, AJ, 109, 2376
- (40) Salzer, J.J., Gronwall, C., Lipovetsky, V.A., et al. 2000, AJ, 120, 80
- (41) Schneider, D.P., Schmidt, M., Gunn, J.E. 1994, AJ, 107, 1245
- (42) Stepanian, J.A. 1994, Proc. IAU Symp. 161, ed. H. T. MacGillivray (Kluwer: Dordrecht), 731
- (43) Ugryumov, A.V., Pustilnik, S.A., Lipovetsky, V.A., Izotov, Y.I., & Richter, G.M. 1998, A&AS, 131, 295
- (44) Ugryumov, A.V., Engels, D., Lipovetsky, V.A., et al. 1999, A&AS, 135, 511 (Paper I)
- (45) Ugryumov, A.V., Engels, D., Kniazev, A.Y. et al. 2001, 2001, A&A, 374, 907 (Paper V)
- (46) Vogel, S., Engels, D., Hagen, H.-J., et al. 1993, A&AS, 98, 193
| # | Name | mB | M | Type | Other names from NED | |||
|---|---|---|---|---|---|---|---|---|
| and number of reference | ||||||||
| (2) | (3) | (4) | (5) | (6) | (7) | (8) | (9) | |
| 1 | HS 0713+4105‡ | 07 13 28.5 | +41 05 51 | 13768 40 | ⋆17.00 | –19.31 | BCG | 2MASX J07165730+4100327 |
| 2 | HS 0719+4928‡ | 07 19 00.7 | +49 28 19 | 18659 40 | 17.60 | –19.37 | SBN? | |
| 3 | HS 0727+4711‡ | 07 27 52.1 | +47 11 51 | 20192 30 | 18.00 | –19.15 | SBN? | 2MASX J07313250+4705296 |
| 4 | HS 0732+3529 | 07 32 23.3 | +35 29 07 | 3785 42 | 17.80 | –15.71 | BCG? | (1) |
| 5 | HS 0735+4507‡ | 07 35 50.8 | +45 07 47 | 15259 50 | 18.50 | –18.04 | NON | |
| 6 | HS 0755+4142‡ | 07 55 42.3 | +41 42 43 | 26702 54 | 18.00 | –19.75 | SBN | 2MASX J07590777+4134301 |
| 7 | HS 0756+4402‡ | 07 56 51.8 | +44 02 21 | 16189 30 | 17.90 | –18.77 | SBN? | |
| 8 | HS 0807+4103‡ | 08 07 58.7 | +41 03 48 | 20073 110 | ⋆17.57 | –19.56 | Sy1 | FIRST J081121.4+40545 |
| 9 | HS 0817+4600 | 08 17 35.5 | +46 00 26 | 11319 48 | 17.40 | –18.49 | BCG | 2MASX J08210576+4550542 (2) |
| 10 | HS 0820+3919‡ | 08 20 32.1 | +39 19 23 | 6963 35 | 18.50 | –16.33 | BCG | |
| 11 | HS 0849+3639‡ | 08 49 34.0 | +36 39 14 | 7467 42 | 20.00 | –14.99 | BCG | (3) |
| 12 | HS 0859+4738‡ | 08 59 14.6 | +47 38 01 | 15760 40 | 18.80 | –17.81 | NON | |
| 13 | HS 0903+4349 | 09 03 31.9 | +43 49 45 | 7758 40 | 20.20 | –14.87 | BCG | (1) |
| 14 | HS 0907+4444 | 09 07 59.1 | +44 44 42 | 8003 42 | 18.40 | –16.74 | BCG | |
| 15 | HS 0919+4234 | 09 19 07.8 | +42 34 15 | 9856 38 | 18.70 | –16.89 | BCG | |
| 16 | HS 0925+4821‡ | 09 25 25.4 | +48 21 35 | 23557 40 | 17.80 | –19.68 | SBN | |
| 17 | HS 0932+3616‡ | 09 32 22.6 | +36 16 57 | 8005 38 | 18.10 | –17.04 | SBN | |
| 18 | HS 0935+4931 | 09 35 04.5 | +49 31 49 | 9334 40 | 17.90 | –17.57 | BCG | SBS 0935+495 (2) |
| 19 | HS 0944+3633‡ | 09 44 56.0 | +36 33 45 | 7876 40 | 18.00 | –17.10 | BCG | |
| 20 | HS 0947+3537‡ | 09 47 47.0 | +35 37 09 | 12110 50 | 17.50 | –18.54 | SBN | |
| 21 | HS 0948+3723 | 09 48 19.0 | +37 23 05 | 4784 40 | ⋆18.14 | –15.88 | BCG | (3,4) |
| 22 | HS 0951+3841 | 09 51 46.4 | +38 41 13 | 5233 30 | 16.80 | –17.41 | BCG | (1) |
| 23 | HS 1009+4906‡ | 10 09 58.3 | +49 06 28 | 18321 40 | ⋆17.89 | –19.05 | BCG | 2MASX J10130712+4851368 |
| 24 | HS 1010+4907 | 10 10 00.3 | +49 07 09 | 18246 40 | ⋆18.23 | –18.70 | BCG | |
| 25 | HS 1012+4135 | 10 12 41.1 | +41 35 48 | 20485 30 | 18.00 | –19.18 | BCG | |
| 26 | HS 1014+3923‡ | 10 14 45.9 | +39 23 20 | 15596 30 | 18.00 | –18.59 | BCG | |
| 27 | HS 1024+4041 | 10 24 49.3 | +40 41 39 | 13239 63 | 17.70 | –18.53 | SBN? | MAPS-NGP O_214_1065413 |
| 28 | HS 1027+4018 | 10 27 01.3 | +40 18 48 | 28310 51 | ⋆18.21 | –19.67 | LINER | 2MASX J10295708+4003288 |
| 29 | HS 1034+3722‡ | 10 34 49.2 | +37 22 33 | 8584 38 | 17.30 | –17.99 | BCG | |
| 30 | HS 1037+4757 | 10 37 30.5 | +47 57 38 | 10130 80 | 18.50 | –17.15 | BCG | (2) |
| 31 | HS 1043+3851‡ | 10 43 17.6 | +38 51 51 | 7991 61 | 19.60 | –15.53 | BCG | |
| 32 | HS 1043+4711 | 10 43 56.1 | +47 11 32 | 10027 40 | ⋆16.89 | –18.74 | SBN? | KUG 1043+471 |
| 33 | HS 1052+4458 | 10 52 53.4 | +44 58 53 | 15384 30 | ⋆18.25 | –18.31 | BCG | MAPS-NGP O_169_1616461 |
| 34 | HS 1053+3624‡ | 10 53 52.9 | +36 24 30 | 816 40 | 17.90 | –12.28 | NON | MAPS-NGP O_264_0140714 |
| 35 | HS 1054+4605 | 10 54 34.0 | +46 05 13 | 6864 30 | 16.60 | –18.20 | BCG | (5) |
| 36 | HS 1057+4317 | 10 57 34.8 | +43 17 16 | 11155 45 | ⋆16.80 | –19.06 | BCG | 2MASX J11002494+4301119 |
| 37 | HS 1102+5009 | 11 02 45.3 | +50 09 53 | 8465 70 | 18.10 | –17.18 | BCG | (2) |
| 38 | HS 1113+4622 | 11 13 02.9 | +46 22 58 | 2925 38 | 17.90 | –15.05 | BCG | (5) |
| 39 | HS 1117+4722 | 11 17 36.5 | +47 22 23 | 7467 40 | 17.10 | –17.89 | SBN | 2MASX J11202304+4705592 (2) |
| 40 | HS 1120+4453‡ | 11 20 31.5 | +44 53 12 | 9722 40 | ⋆17.68 | –17.88 | NON | MAPS-NGP O_170_0535959 |
| # | Name | T | F(H) | EW3727 | EWHβ | EW5007 | |||||
|---|---|---|---|---|---|---|---|---|---|---|---|
| (2) | (3) | (4) | (5) | (6) | (7) | (8) | (9) | (10) | (11) | (12) | |
| 1 | HS 0713+4105 | C | 41b | 1.84d | 3.15b | 4.90b | 0.15b | 0.23b | 33c | 26b | 82a |
| 2 | HS 0719+4928 | B | 14b | 2.92c | 1.77c | 5.45b | 0.25b | 0.29b | 27b | 8b | 13b |
| 3 | HS 0727+4711 | B | 20c | 2.86c | 1.12c | 5.53c | 0.37b | 0.29b | 46c | 11c | 12c |
| 4 | HS 0732+3529 | B | 44b | 1.27c | 6.17c | 53c | 55b | 331a | |||
| 5 | HS 0735+4507‡ | B | 10c | 0.28d | 0.87d | ||||||
| 6 | HS 0755+4142‡ | B | 34b | 0.25d | 0.40d | 25d | 15c | ||||
| 7 | HS 0756+4402 | B | 13b | 3.60c | 3.19c | 3.42c | 0.16d | 130b | 14b | 33c | |
| 8 | HS 0807+4103‡ | B | 54b | 0.38d | 0.26d | 37b | |||||
| 9 | HS 0817+4600 | B | 18a | 2.80a | 1.76a | 39a | 10a | 16a | |||
| 10 | HS 0820+3919 | B | 10b | 2.10c | 3.16c | 48b | 16b | 51a | |||
| 11 | HS 0849+3639 | B | 28b | 2.51b | 2.54b | 159b | 71b | 184b | |||
| 12 | HS 0859+4738‡ | B | 22c | 0.46 | 0.55 | 27d | |||||
| 13 | HS 0903+4349 | C | 6.1c | 7.87c | 4.92c | 0.05 | 0.12d | 20c | 209a | ||
| 14 | HS 0907+4444 | C | 16b | 4.05b | 4.16b | 0.05d | 0.15c | 23b | 96a | ||
| 15 | HS 0919+4234 | C | 22b | 5.46c | 3.02c | 0.09 | 0.10d | 73b | 292a | ||
| 16 | HS 0925+4821 | B | 7.1d | 1.89d | 1.19d | 4.74d | 0.38c | 0.39d | 34d | 8d | 10d |
| 17 | HS 0932+3616 | B | 2.5d | 4.34d | 2.32d | 107d | 6d | 15c | |||
| 18 | HS 0935+4931 | B | 15b | 3.71b | 3.69b | 3.48b | 0.09c | 0.28b | 115a | 22b | 80a |
| 19 | HS 0944+3633 | B | 14b | 2.61b | 2.74b | 45b | 15b | 36a | |||
| 20 | HS 0947+3537 | B | 8.0a | 4.26b | 1.14b | 40b | 8b | 10b | |||
| 21 | HS 0948+3723 | B | 3.9b | 2.77c | 4.31c | 39c | 7b | 32b | |||
| 22 | HS 0951+3841 | B | 47a | 3.39a | 3.17a | 82a | 24a | 72a | |||
| 23 | HS 1009+4906 | B | 1.5d | 6.57d | 5.35d | 16.55d | 20.10 | 0.47d | 31b | 4d | 22b |
| 24 | HS 1010+4907 | B | 27a | 1.42a | 5.59a | 14.02d | 0.06 | 0.07b | 134a | 257a | 1779a |
| 25 | HS 1012+4135 | B | 29a | 2.64a | 5.60a | 14.27d | 0.05 | 0.10c | 87a | 47a | 268a |
| 26 | HS 1014+3923 | B | 18b | 3.53b | 3.29b | 66a | 19b | 58a | |||
| 27 | HS 1024+4041 | B | 3.5d | 2.94d | 1.30d | 5.93d | 0.16 | 0.33d | 25d | 9d | 12d |
| 28 | HS 1027+4018‡ | M | 33d | 2.00c | 1.02c | 54c | |||||
| 29 | HS 1034+3722 | B | 31a | 2.15b | 4.52a | 92a | 33a | 152a | |||
| 30 | HS 1037+4757 | B | 1.5c | 1.04d | 6.42c | 5.37c | 0.04d | 0.33d | 17c | 176b | |
| 31 | HS 1043+3851 | C | 19a | 3.36b | 3.07b | 0.08d | 0.09d | 15a | 55a | ||
| 32 | HS 1043+4711 | C | 76a | 2.09c | 1.47b | 3.48a | 0.31a | 0.24a | 66c | 31a | 49a |
| 33 | HS 1052+4458 | M | 11c | 2.94c | 4.00c | 3.15c | 0.19 | 0.18 | 93c | 23c | 90a |
| 34 | HS 1053+3624 | C | 31d | 1.00d | 6.90d | 0.10 | 13d | 14d | |||
| 35 | HS 1054+4605 | B | 31a | 3.53a | 2.66a | 91a | 19a | 47a | |||
| 36 | HS 1057+4317 | M | 199a | 2.48a | 5.06a | 3.49a | 0.07d | 0.16b | 97a | 43a | 223a |
| 37 | HS 1102+5009 | M | 12c | 6.82c | 4.31c | 6.12c | 0.13d | 0.30d | 100b | 8c | 33a |
| 38 | HS 1113+4622 | B | 25a | 2.09a | 3.30a | 52a | 21a | 63a | |||
| 39 | HS 1117+4722 | M | 100a | 2.61b | 1.34a | 4.29a | 0.19b | 0.21b | 54b | 20a | 28a |
| 40 | HS 1120+4453‡ | C | 126b | 0.21 | 0.16 | 14c |
| # | Name | Detected emission lines | ||||
| (2) | (3) | (4) | (5) | (6) | (7) | |
| 1 | HS 1138+4900 | 11 38 13.4 | +49 00 09 | 3.353 | 18.9 | Ly 1216 Å, Siiv/Oiv] 1400 Å, Civ 1549 Å |
| 2 | HS 1203+3811 | 12 03 53.7 | +38 11 09 | 3.184 | +19.6 | Ly 1216 Å |
| 3 | HS 1250+4408 | 12 50 27.1 | +44 08 53 | 1.639 | +18.4 | Civ 1549 Å, Ciii] 1909 Å, Mgii 2798 Å |
| 4 | HS 1334+3948 | 13 34 52.3 | +39 48 15 | 3.223 | 19.1 | Ly 1216 Å, Siiv/Oiv] 1400 Å, Civ 1549 Å |
| 5 | HS 1528+3914 | 15 28 39.4 | +39 14 25 | 3.290 | 17.0 | Ly 1216 Å, Siiv/Oiv] 1400 |
| 6 | HS 1608+3546 | 16 08 00.5 | +35 46 30 | 0.829 | 17.8 | Mgii 2798 Å |
| 7 | HS 1646+4501 | 16 46 19.0 | +45 01 32 | 1.790 | 19.0 | Civ 1549 Å, Ciii] 1909 Å |
| 8 | HS 1714+4202 | 17 14 46.3 | +42 02 49 | 0.846 | +18.1 | Mgii 2798 Å |
| a Observed redshift; + corrected APM magnitudes (see Sect. 4.2). | ||||||
| # | Name | mB | M | Absorption lines | |||
| (2) | (3) | (4) | (5) | (6) | (7) | (8) | |
| 1 | HS 0716+4510† | 07 16 35.8 | +45 10 09 | 33994 | 19.2 | –19.0 | H, NaD |
| 2 | HS 0805+4120† | 08 05 01.7 | +41 20 23 | 17071 | +17.8 | –18.9 | H, H, Gband, CaK, CaH |
| 3 | HS 1010+49061 | 10 10 00.3 | +49 06 56 | 18070 | 19.3 | –17.6 | CaK, CaH, Gband, MgIb , NaD, probable emis. H |
| 4 | HS 1052+3637† | 10 52 32.9 | +36 37 05 | 7774 | 19.0 | –16.1 | CaK, CaH |
| 5 | HS 1350+4701† | 13 50 52.3 | +47 01 41 | 18570 | 17.7 | –19.2 | H |
| 6 | HS 1420+4624† | 14 20 21.1 | +46 24 39 | 9276 | 18.5 | –16.9 | H, H, MgIb |
| 7 | HS 1443+4253 | 14 43 07.8 | +42 53 13 | 5082 | +18.1 | –16.1 | CaK, CaH, H, MgIb, TiO 6155-6180 |
| 8 | HS 1454+3513 | 14 54 22.4 | +35 13 30 | 35356 | +19.1 | –19.2 | H, H, CaK, CaH, MgIb |
| 9 | HS 1527+4252† | 15 27 06.3 | +42 52 55 | 35360 | +17.5 | –20.8 | H, H, H, Gband, |
| a Heliocentric velocities; b absolute magnitudes are not corrected for galactic extinction; | |||||||
| † objects from the APM second priority sample; + APM magnitude. | |||||||
| 1 a galaxy near HS 1009+4906 and HS 1010+4907 in Table 4. | |||||||
| # | Name | mB | Type | Spectral features | ||
| (2) | (3) | (4) | (5) | (6) | (7) | |
| 1 | HS 0712+4338‡ | 07 12 46.4 | +43 38 30 | 18.0 | F-G | Hα, Hβ, Hγ, CaK, CaH |
| 2 | HS 0721+4148 | 07 21 16.0 | +41 48 55 | 18.0 | ? | Hα, NaD, CaK, CaH |
| 3 | HS 0729+4559‡ | 07 29 08.8 | +45 59 03 | 18.0 | F-G | Hα, NaD,Hβ, Hγ |
| 4 | HS 0742+4205‡ | 07 42 11.9 | +42 05 38 | 17.9 | F | Hα, Hβ, Hγ,CaK, CaH, NaD, MgIb |
| 5 | HS 1019+4002‡ | 10 19 36.5 | +40 02 20 | 17.2 | G | CaK, CaH, Gband, Hγ, Hβ, MgIb |
| 6 | HS 1027+4930 | 10 27 32.5 | +49 30 33 | 19.0 | K | CaK, CaH, Gband, FeI,MgIb,NaD |
| 7 | HS 1246+4514 | 12 46 12.1 | +45 14 33 | 19.0 | M | NaD, CaK, CaH, TiO-bands |
| 8 | HS 1317+4521A | 13 17 49.6 | +45 22 14 | +17.3 | K | CaK, CaH, Gband, FeI,Hβ, MgIb, NaD, Hα |
| 9 | HS 1350+5022 | 13 50 14.6 | +50 22 41 | 18.4 | F | Hα, Hβ, Hγ |
| 10 | HS 1400+3833‡ | 14 00 04.3 | +38 33 22 | 18.7 | K | CaK, CaH, Gband, FeI, MgIb, NaD |
| 11 | HS 1502+4358‡ | 15 02 17.7 | +43 58 57 | +16.9 | K | CaK, CaH, Gband, FeI, Hβ, MgIb, NaD, Hα |
| 12 | HS 1514+4506‡ | 15 14 29.8 | +45 06 29 | +17.6 | G | CaK, CaH, Gband, Hβ, MgIb, NaD, Hα |
| 13 | HS 1543+4919‡ | 15 43 29.5 | +49 19 07 | 19.2 | A | Hγ, Hβ, Hα |
| 14 | HS 1609+4518‡ | 16 09 47.0 | +45 18 48 | 19.0 | F | Hγ, Hβ, NaD, Hα |
| 15 | HS 1613+4408‡ | 16 13 18.4 | +44 08 07 | 17.8 | F | Hα, Hβ, Hγ |
| 16 | HS 1614+4646‡ | 16 14 22.7 | +46 46 55 | 17.9 | F-G | Hα, Hβ, Hγ,NaD |
| 17 | HS 1614+4835‡ | 16 14 09.4 | +48 35 20 | 18.0 | A-F | Hβ, Hγ, CaK, CaH |
| 18 | HS 1615+4512‡ | 16 15 45.4 | +45 12 09 | 17.6 | F | Hα, Hβ, Hγ, CaK, CaH |
| 19 | HS 1647+4024‡ | 16 47 31.7 | +40 24 02 | +17.1 | A-F | Hα, Hβ, Hγ, Gband |
| 20 | HS 1654+3939‡ | 16 54 53.2 | +39 39 54 | 17.6 | A | CaK, CaH, Hγ, TiII, Hβ, Hα |
| 21 | HS 1659+4059‡ | 16 59 57.2 | +40 59 36 | +18.1 | F | CaK, CaH, Gband, Hβ, MgIb, NaD, Hα |
| 22 | HS 1703+4242‡ | 17 03 02.4 | +42 42 12 | +18.0 | A | Hα, Hβ, Hγ |
| 23 | HS 1720+4950‡ | 17 20 10.9 | +49 50 03 | 18.2 | F-G | CaK, CaH, Gband, Hβ, MgIb, NaD, Hα |
| 24 | HS 1721+4624‡ | 17 21 41.7 | +46 24 49 | 18.1 | G | CaK, CaH, Gband, FeI, Hβ, MgIb, NaD, Hα |
| 25 | HS 1722+4829‡ | 17 22 51.4 | +48 29 05 | 17.4 | F-G | CaK, CaH, Gband, Hβ, MgIb, NaD, Hα |
| 26 | HS 1733+4441‡ | 17 33 59.5 | +44 41 19 | +16.8 | F | CaK, CaH, Hδ, Gband, Hγ, Hβ, Hα |
| ‡ objects from the APM selected sample; + APM magnitudes. | ||||||