Feeding the monster… the nucleus of NGC 1097 at sub-arcsec scale in the IR with the VLT
Abstract
Near-infrared images of the prototype LINER / Seyfert 1 galaxy NGC 1097 observed with the Very Large Telescope (VLT) using adaptive optics disclose with unprecedented detail a complex central network of filamentary structure spiralling down to the center of the galaxy. The structure, consisting of several spiral arms, some almost completing a revolution about the center, is most prominent within the radius of about 300 pc. Gas and dust may be channelled to the center of NGC 1097 along this central spiral. Some filaments can be traced further out, where they seem to connect with the nuclear star-forming ring at 0.7 kpc radius. Straight principal shocks running along the primary large-scale bar of NGC 1097, seen in the optical images as prominent dust lanes, curve into this ring, but radio polarization vectors cross the nuclear ring under a rather large angle. Here we attempt to explain this morphology in terms of three-dimensional gas flow in a barred galaxy. In our scenario, parts of the principal shock, which propagate in the off-plane gas, can cross the nuclear star-forming ring, and excite waves inward from it. If the dispersion relation of the excited waves allows for their propagation, they will naturally take the shape of the observed central spiral. The nuclear region of NGC 1097 remains unresolved at sub-arcsec scales in the near-IR, with an upper size limit of 10 pc FWHM. Thus, any putative central dusty torus or gaseosus disk envisaged by the AGN unified schemes has to be smaller than 10 pc in diameter at near-IR wavelengths. The extinction in the region between the nuclear star-forming ring and the nucleus increases very moderately, reaching at the immediate surrounding of the nucleus. Thus, if the nuclear filaments are tracing cold dust, they contribute to a very low extinction in the line of sight and are likely to be distributed in a rather thin disk.
1 Introduction
NGC 1097 is a SBb galaxy with an Active Galactic Nucleus (AGN), located at a distance of 14.5 Mpc (Tully, 1988; 1 arcsec 70 pc), which places it among the nearest AGN in the Southern Hemisphere. It has been originally classified as a LINER and further reclassified as a Seyfert type 1 (Sy 1) nucleus after the detection of broad, double peaked emission by Storchi-Bergmann et al. (1993). However, it is very moderate AGN with erg s-1(Terashima et al. 2002). Dust extinction toward the nucleus, as inferred from the broad Balmer line ratio, (Storchi-Bergmann et al. 1995), is quite moderate, . The ratio of Balmer narrow components indicates similar extinction (Storchi-Bergmann et al. 1996).
NGC 1097 has a very strong bar at 141and a prominent nuclear star-forming ring of 0.7 kpc radius inside it. Interior to the ring, a secondary nuclear bar crosses the nucleus at PA=28(Quillen et al. 1995), almost orthogonally to the primary bar. The nucleus and the star-forming ring are prominent in CO and HCN molecular emission (Kohno et al. 2003). The CO map shows three main peaks: at the nucleus and at two diametrically opposite locations in the nuclear star-forming ring. The latter correspond to the connecting points between principal dust lanes in the outer bar and the star-forming ring. They also roughly coincide with the ends of the inner nuclear bar, but they slightly trail the bar (have larger PA). The resolution of Kohno’s et al maps, in CO(1-0) and in HCN(1-0), is insufficient to confirm the presence of cold material between the nucleus and the ring. The map and radial profile distribution presented by the authors hint to the presence of some weaker CO emission in this region. First evidence for the presence of cold material there comes from the Hubble Space Telescope (HST) optical images analyzed by Barth et al. (1995), who reported on the presence of dusty filaments in the surroundings of NGC 1097’s nucleus.
Regarding the presence of warmer gas in the nuclear region of NGC 1097, infrared (IR) spectroscopy reveals emission from both and HII at the nucleus, the star-forming ring and the region in between. Long-slit IR spectroscopy in several directions across the nucleus (Reunanen, Kotilainen & Prieto 2002; Kotilainen et al. 2000) shows strong 2.12 m line emission from the nucleus and the star-forming ring, and weak extended emission from the region in between. Optical long-slit spectroscopy (Storchi-Bergmann et al. 1996) shows strong ionized gas emission from both the nucleus (Sy 1 spectrum with broad emission) and the ring (low excitation HII region spectrum), and faint line emission from the region in between (a LINER type spectrum). Br emission is detected in the ring but not at the nucleus (Reunanen, Kotilainen & Prieto, 2002; Kotilainen et al. 2000). Also the line is very weak in the nuclear spectra due to the absorption component by the underlying stellar contribution.
In this paper we present high spatial resolution images of NGC1097, obtained with the Very Large Telescope (VLT) and the Adaptive-Optics-assisted NACO camera/spectrograph in the 1-2.4 m range. The physical scales traced by these images are of the order of 10 pc, and thus they probe with unprecedented detail the presence and extent of obscuring material in the very proximity of the nucleus. After describing the observations in Section 2, and results in Section 3, in Section 4 we attempt to explain the dynamics of the central filamentary structure that is observed.
2 Observations
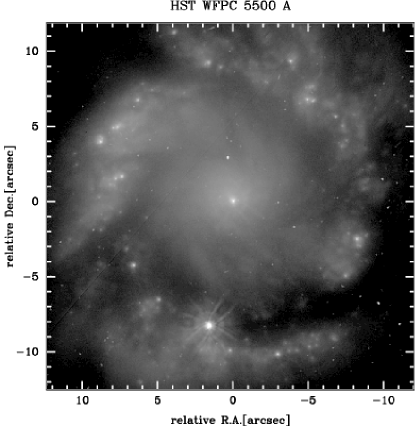
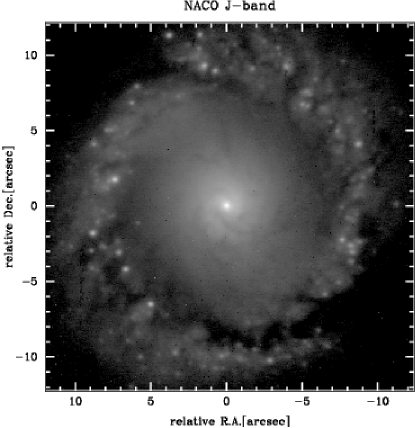
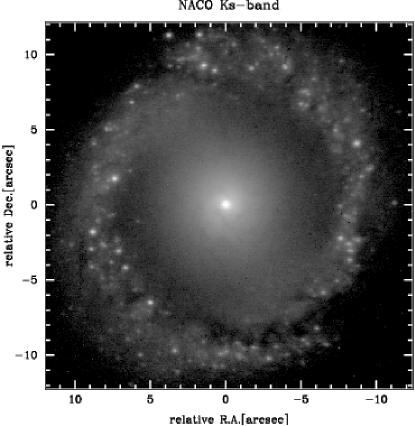
Images of the NGC 1097 nucleus in and bands were collected with the UT4 unit of the VLT during August 2002. The images were taken with the NACO camera that provides a field of view of 2727 arcsec and a scale of 0.027 arcsec per pixel. The adaptive optics correction was done with the optical wave-front sensor closing the loop on NGC 1097 nucleus. The achieved spatial resolution has FWHM of about in band, in band, and in band. These values were measured on various isolated HII regions in the star-forming ring, which we assumed to be point-like. These HII regions are resolved in the HST WFPC1 image at 5500 Å (Barth et al. 1995), having sizes about 4 pc (0.06 arcsec). In the NACO images, we get almost constant angular size for several of the HII regions, as well as for the nucleus, and thus we believe this to be the real resolution of the data. It is different from that derived from a stellar PSF, but estimating the spatial resolution on the basis of separate images of stars is not viable because atmospheric correction achieved by the Adaptive Optics (AO) system is different depending on the type of source used for monitoring the atmosphere. NGC 1097 images were corrected using the nucleus of the galaxy, which means that the contamination by the galaxy light degrades the contrast of the nuclear light. This leads to a systematically worse AO correction when compared with that achieved from a separate image of an isolated bright star. The spatial resolution achieved in the PSF star images taken for this program turned out in general to be at least 30% better than that of the science images.
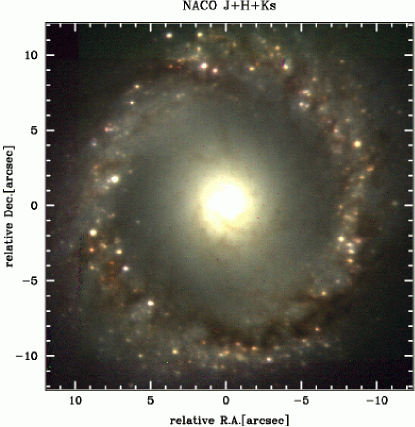
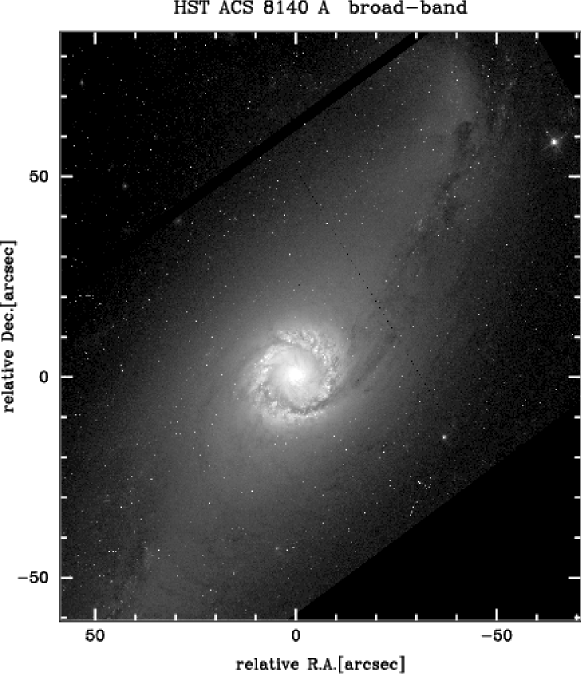
NACO and band images, and the HST WFPC1 optical image of NGC 1097 are shown in Fig. 1. The NACO band image is similar, and therefore it is not shown. Although the resolution of the NACO images is about 4 times worse than that of the optical HST image, this shortcoming is largely compensated by the amount of new information revealed in the IR images. At all wavelengths the AGN and the star-forming ring are detected, but the IR images show in addition the presence of a central nuclear bar and newly discovered HII regions in the ring, more than 300 compared with 88 measured by Barth et al. (1995) in the HST image. The comparison of the optical and IR images gives evidence for the presence of dust all over the star-forming ring interlaced with the HII regions. The ring morphology is more like two spiral arms, with each of the arms connecting to an end of the nuclear bar. Note however that a different morphology is disclosed by the color image presented in Section 3.3.
3 Results
3.1 The nucleus
At the resolution of these IR observations, the nucleus of NGC 1097 remains a point-like source, with an upper limit to the size of FWHM in the band. This is about the FWHM measured in several of the best isolated HII regions in the star-forming ring from the same -band image (see Section 2), and thus we consider the nucleus unresolved. At the distance of NGC 1097, that angular resolution implies an upper limit for the nucleus size of less than 10 pc diameter.
A light-profile decomposition of the central 3 arcsec (210 pc) radius of NGC 1097 is shown in Fig. 2. It is fitted with a simple two-component model consisting of an unresolved source – the nucleus, represented by a PSF, and an underlying galaxy component or pseudo-bulge, represented by a generalized Sersic model. Surface brightness in the Sersic model follows a formula , where is the central surface brightness, is a scaling radius, and is the Sersic exponent (Sersic 1968). The PSF was estimated as follows. The useful dynamic range of the profile from the HII regions in the star-forming ring is only ; the dynamic range reached in the PSF star images observed separately from the science frames is however . The core of PSF star images is narrower than that measured for the HII regions. Therefore, a PSF composite profile was produced which includes the profile of an HII region up to a radius of 0.45 arcsec in band, 0.3 arcsec in and bands, complemented with that of the stellar PSF from those radii on. The Sersic exponent was allowed to vary between 1 and 4, but the best fit in any of the bands was obtained for . The results of the best fit are shown in Fig. 2, and the parameters derived from this fit are given in Table 1. The residuals from the fit are less than 5% at all radii. However, within 0.3-0.6 arcsec radius, the residuals show structure which is most probably due to a still unsatisfactory PSF, particularly in and bands.
The contribution of the point-like source, the AGN, to the total light at different radii is given in Table 2. As expected, the AGN contribution increases with wavelength. Within a 0.2 arcsec aperture diameter, which is 1.5 times the achieved spatial resolution, its contribution in the -band is dominant, 90%, but it is 20% less important in band. The colors of the nucleus are rather red: , , indicative of dust temperature of 1000 K. However, this temperature should be taken as an upper limit considering that the measurements still correspond to relatively large physical scales — the resolution of these observations is about 10 pc. Warm and hot gas should also be present at these distances from the center and therefore free-free emission from these gas phases might also be contributing at those scales to the near-IR, in particular if shock excitation is present. This indeed seems to be the case as indicated by the large line-widths, km s-1, measured in the optical spectra from regions in between the nucleus and the star-forming ring (Storchi-Bergmann et al. 1996). Shock velocities of that range can heat the gas to , and bremsstrahlung emission from this gas will substantially contribute in the IR (see e.g. Contini et al. 2004).
3.2 The pseudo-bulge
Table 2 gives the colors of the region between the nucleus and the star-forming ring integrated directly on the images over increasing concentric radii. This region, 0.7 kpc in radius, is referred to as the pseudo-bulge of NGC 1097 in Section 3.1. The colors are subtracted from the point source contribution estimated from the radial profile fit (Section 3.1). Equivalent colors derived from the Sersic model used in the fit are given in Table 2 for comparison. There is reasonable agreement within a few percent between the two estimates except for radii below 0.4 arcsec where the nucleus and an additional source of emission become important. This is discussed below.
The radial variation of the colors in the central 10 arcsec together with a color-color diagram from the same region are plotted in Fig. 3. These colors are measured on the images from azimuthally averaged concentric rings. By comparing the upper and lower panels in Fig. 3, one sees that the reddest colors, i.e. and , are measured at radii below 1 arcsec. The particular trend followed by these extreme colors in the vs diagram is caused by contamination by the nucleus light particularly in band (see Table 2). It may also be introduced by the underlying central spiral structure revealed in the color images (see Section 3.3), which becomes more dense with decreasing radius. This contamination seems to fade at about 1 arcsec (70 pc) radius as indicated by the clear color turnover at and in the color-color diagram. From that radius outward pseudo-bulge dominates the color, which becomes monotonically bluer, reaching a minimum , at arcsec (350 pc) radius from the center. Further out, the colors become redder again due to the incipient contribution of NGC 1097 nuclear star-forming ring.
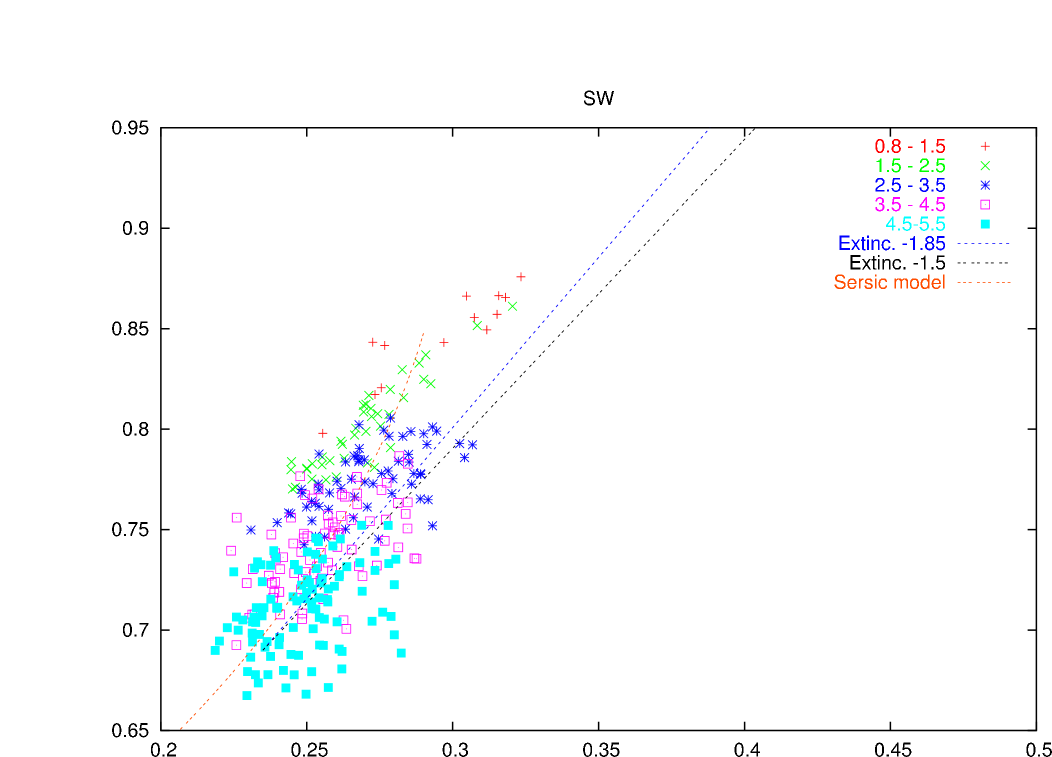
With the aim of determining the extinction towards the nucleus, as a first step we took those minima, , , as the intrinsic colors of NGC 1097 pseudo-bulge. In doing so, we note that the progressive reddening with decreasing radius is difficult to explain by dust extinction alone, unless very steep IR extinction curves, with 3.5 (), are considered. The problem is better illustrated in Fig. 4 where a detailed view of the color variations in a selected area of the bulge – e.g. the South-West quadrant – is shown. - and - are measured in consecutive boxes of size 0.270.27 arcsec, covering the region between 0.5 and 5.5 arcsec ( pc) from the center. Colors measured in the other quadrants show similar behavior. Taking again and as the intrinsic colors of the pseudo-bulge, the progressive reddening at radii larger than arcsec is well explained by dust extinction alone (two extinction laws with and 1.8 are shown in the figure). However further in, becomes much redder than predicted.
We then compared the observed color variation with the one predicted by the Sersic model used to fit the pseudo-bulge (Section 3.1). These colors are plotted as a red line in Fig. 4. It can be seen that the observed colors follow Sersic predictions down to a radius of arcsec. Further in, they depart from Sersic trend, but the departure is now easily reconciled with a more pure extinction law. Based on this result, we estimate the extinction toward the nucleus by taking as a face value for the intrinsic colors of the pseudo-bulge those measured at 2.5 arcsec (180 pc) radius from the center: i.e. , 0.25 (Fig. 4). The reddest values at about 0.6” from the nucleus are , . These compared with our fiducial value lead to a moderate extinction of within the central pc region. This extinction is in the range measured from the nuclear Balmer decrement estimated from an aperture larger than 1 arcsec (Storchi-Bergmann et al. 1996).
3.3 The central spiral network
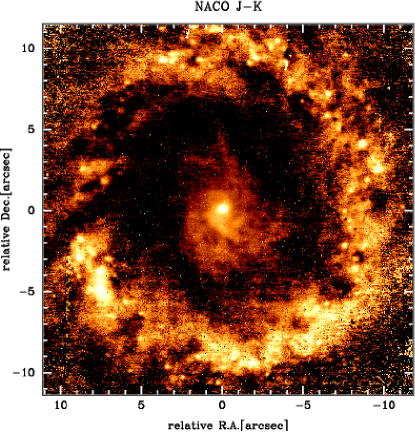
In Fig. 5 (bottom-left panel), a - color map of the central 2 kpc region of NGC 1097 is presented. It shows the morphology of the nuclear star-forming ring as a complete annulus, filled by a continuous distribution of HII regions and gas. It differs from two spiral arms morphology seen in the optical image (Fig. 1). In the - color map most of the contribution from both the pseudo-bulge and the nuclear bar cancels out, disclosing a filamentary structure that spirals around the center. This structure is similar to those unveiled in nearby galaxies by ’structure maps’ constructed from HST WFPC2 images (Pogge & Martini 2002), or through visible-near-infrared color maps from the HST (Martini et al. 2003). The resolution of our NACO images, when compared to that of HST/NICMOS images, is similar in band and a factor of 2 worse in band. However, the PSF of the VLT/NACO images does not show the boxy diffraction pattern often seen in NICMOS images of strong point-like sources, and therefore nuclear structure at distances as small as 10 pc from the center can be revealed. An additional advantage of using a near-IR color image in this study is that this spectral range is less prone to the contamination by line emission. images often used to trace dust structures in the surrounding of an AGN may largely be polluted by strong optical emission lines in the band.
Most of the central filamentary structure around the nucleus of NGC 1097 cannot be distinguished in the direct HST optical and NACO IR images, except for the outer parts of the longer filaments which are seen as obscured fingers in the HST WFPC1/F5500W and the NACO band images (Fig. 1). These filaments are seen in extinction against background light from the pseudo-bulge, and therefore they are likely to be tracers of cold material and dust. The low extinction, , indicated by the IR colors of the pseudo-bulge (see Section 3.2) suggests that the filaments are not filling much of the volume within this region, and are likely distributed in a rather thin disk.
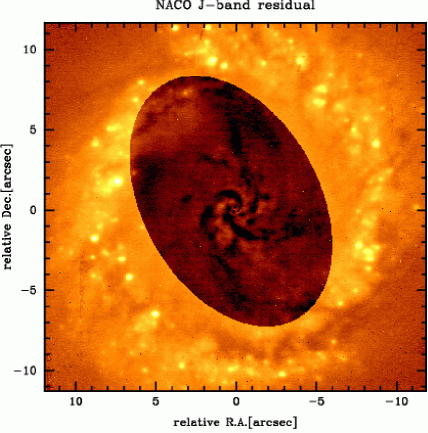
To investigate the central filamentary structure in more detail, a simple elliptical model was fitted and subtracted from the -band image, with the fit restricted to the region inside the nuclear star-forming ring. The residual image, shown in Fig. 5 (bottom-right panel), looks like the negative of the - color map. The brighter filaments in the color map appear as dark channels in the residual, yet, with sharper detail and increasing length in the latter. Our analysis of the VLT/NACO images of NGC 1097 shows that these filaments, within the achieved resolution of about 10 pc, end up at the very center of the galaxy. Several filaments can be traced in the residual image, but most prominent are three spiral arms that wind around the center at radii below 200 pc. At larger radii, the pitch angles of these arms increase, and two arms seem to align with the nuclear secondary bar present in NGC 1097. The northern arm then splits into two at a radius of about 300 pc. The third arm appears to be unrelated to the nuclear bar, and it splits into a number of spiral filaments at a similar radius. Some of the filaments can be followed outward up to the nuclear star-forming ring. It can be seen in the HST/ACS image (Fig. 5, top panel) that this ring also encircles the curving innermost parts of the dust lanes which run along the primary bar of NGC 1097. The nuclear filaments seem to connect with the large-scale dust lanes, but there is a clear discontinuity in the pitch angle at the meeting points.
4 Dynamics of the central spiral network
The VLT high-resolution infrared images presented in this paper unveil a complex spiral network of dust filaments around the nucleus of NGC 1097. Here we examine how such a network could have been formed, and whether it could funnel gas inward. The mass of the molecular gas makes only a fraction of the total dynamical mass within the inner few hundreds parsecs of the galaxy. We estimate an upper limit to the central molecular gas mass within the beam size of the CO observations by Kohno et al. (2003), or pc, to be M. The dynamical mass within the same area, inferred from the rotation curve (Storchi-Bergman et al. 1996), is at least M.
4.1 Origin of the central spiral
The spiral dusty filaments around the nucleus of NGC 1097 are unlikely to be formed by a self-amplified density wave, analogous to the one that shapes the classical large-scale spiral arms in galaxies. This is because stars, which make up most of the mass in this region, mostly settle in the pseudo-bulge and in the nuclear bar that we observe in the infrared. This spiral pattern is also unlikely to be of acoustic origin (Elmegreen 1994), because it consists of a few sharp spiral filaments, while acoustic spirals, generated by the amplification of sound waves in the gaseous nuclear disk, are expected to have flocculent, multi-arm morphology, and to uniformly fill the nuclear disk. The spiral network around the nucleus of NGC 1097 closely resembles the nuclear spirals seen in hydrodynamical models (Englmaier & Shlosman 2000, Maciejewski et al. 2002, Maciejewski 2004b). Straight principal shocks in a large-scale bar may end in a nuclear ring, which itself is a tightly wound spiral, or they can give rise to more open nuclear spirals, which are an extension of these shocks inward to smaller radii. Hereafter we call the nuclear spirals that extend to the galactic center the central spirals.
There is a strong large-scale bar in NGC 1097, which could trigger a nuclear spiral, but there is also a prominent nuclear star-forming ring there, abundant in gas. Central spirals have not been found in models inside gaseous nuclear rings, because shocks triggered by the large-scale bar get damped in such rings, so they cannot give rise to central spirals (Maciejewski 2004b). The coexistence of the nuclear star-forming ring and the dusty central spiral in NGC 1097 seems to contradict these models, unless principal shocks in the bar have some effect on the gas encircled by the nuclear ring.
Numerical models of gas flow in bars have so far only been built in two dimensions, in order to reflect the dynamics of gas in the disk of a galaxy. On the other hand, shocks generated in gas by a large-scale bar are intrinsically three-dimensional, and they propagate also in the off-plane gas. There have been studies of the vertical structure of galactic spiral arms (Martos & Cox 1998, Gomez & Cox 2002), but not of the shocks in bars. Here we make a qualitative attempt to describe gas flow in bars in three dimensions. We base our description on two assumptions: 1) in addition to the gas in the plane of the disk there is off-plane gas of lower density, 2) larger scale-height of the off-plane gas is supported by its energy stored in velocity dispersion of the clouds. Within this framework we can guide our understanding of gas flow in three dimensions using various two-dimensional models for various heights above the galactic plane. However, full quantitative description requires high-resolution three-dimensional hydrodynamical models, which are beyond the scope of this paper.
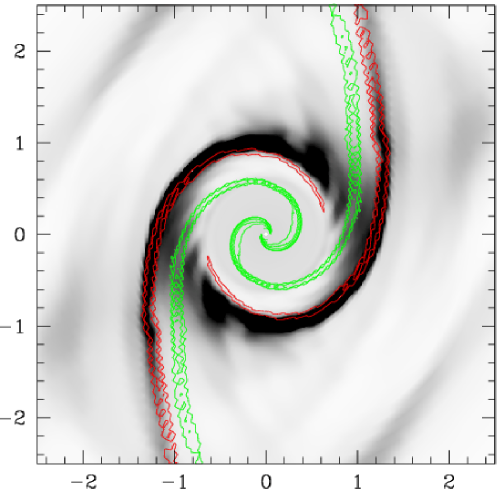
The dispersion relation of a wave generated in the gaseous disk implies that the pitch angle of the wave is proportional to the velocity dispersion in gas (Englmaier & Shlosman 2000, Maciejewski 2004a). Thus in gas with higher velocity dispersion (dynamically warmer), waves generated by the principal shocks in the bar should have higher pitch angle than in a dynamically colder gas. When the pitch angle is high enough, waves can spiral freely into the galactic center (Maciejewski et al. 2002). This may be a scenario for the extraplanar gas. On the other hand, shocks propagating in the disk, where gas is dynamically colder, generate waves with smaller pitch angle. These waves are damped in dense post-shock gas, and a nuclear gaseous ring forms with excellent conditions for star formation (Maciejewski 2004b). The morphology of waves, which are expected to form in the disk as well as in the extra-planar gas, together with gas morphology in the plane of galaxy are shown in the top panel of Fig. 6. These morphologies should be compared with those in the bottom-right panel of Fig.5. Although the structure in the model is generic, and not tuned to reflect particular features in NGC 1097, there are similarities between the model and the data. The large-scale dust lanes enter the nuclear star-forming ring along the paths marked by the red lines that indicate shocks in the cold in-plane gas in the model, whereas the observed central spiral takes a shape similar to that of the green line marking shocks in the extraplanar gas. The distribution of the emission from the star-forming ring resembles in-plane gas density distribution in the model.
The nuclear star-forming ring in NGC 1097 consists mostly of molecular gas, and therefore it is well confined to the galactic plane. It damps waves generated by the principal shocks in the bar that are propagating in the galactic plane. However, in the scenario proposed above, shocks propagating in the off-plane gas may pass the ring almost unaffected. Inward from the ring our simple plane-parallel scenario breaks down, and full three-dimensional approach is needed to determine whether off-plane shocks couple with the dynamically cold gas in the disk and whether they can generate spiral density waves there. It is possible that the gaseous disk inside the nuclear star-forming ring is no longer dynamically cold, as indicated by the large pitch angle of the central spiral, which should facilitate the coupling. If the dispersion relation of the excited wave allows for its propagation inward from the nuclear ring, this wave will naturally take a spiral shape. Waves inward from the ring can propagate freely toward the galactic center, because they are not hindered by the dense post-shock gas in the galactic plane, which has settled in the ring outside them. We hypothesize that these waves form the observed spiral network inside the nuclear star-forming ring. In this picture the central spiral in NGC 1097 would be a wave in gas, and a continuation of the principal shocks present in the large-scale bar.
We note that the innermost parts of the central spiral have a three-arm symmetry, not an obvious consequence of triggering by bisymmetric shocks in a bar. Three-arm spirals can form as a response to lopsided () or terms in the forcing. One source of these odd terms in NGC 1097 may be the difference in strength of the two principal shocks in the main bar. It has been observed that the amount of post-shock gas can differ between the two shocks by a factor of two (Schinnerer et al. 2002). This can effectively introduce odd terms in forcing, since in our scenario it is the shock, and not the bar, that triggers the central spiral. A dwarf elliptical companion to NGC 1097 may also introduce mode in the shocks. Regardless of its explanation, the three-arm symmetry of the central spiral indicates that there is a departure from bisymmetry in the forcing that generates this pattern.
4.2 Interpretation of the polarization maps of NGC 1097
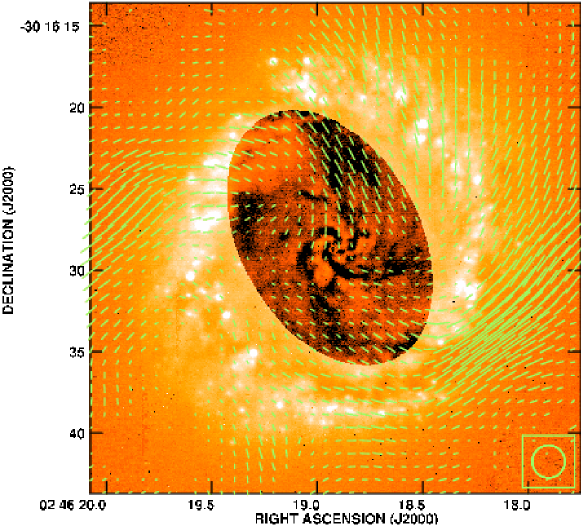
Our scenario for the origin of the central spiral in NGC 1097, presented above, is supported by the morphology of the regular magnetic field seen in the radio polarization maps of this galaxy (Beck et al. 1999). In the lower panel of Fig. 6, we present the magnetic field vectors observed by Beck et al. (1999, 2005), which are aligned with the shearing flow, plotted on top of our processed -band image that shows the dusty central spiral. At radii where the principal shocks originating in the main bar approach the nuclear star-forming ring, the magnetic vectors progressively swing from an alignment with these shocks to a clear spiral pattern that crosses the nuclear star-forming ring under a rather large angle (50). Directly inward from the ring this pattern tends to follow central dusty spiral structure that we observe.
At the position of the nuclear star-forming ring, the spiral morphology of the magnetic field is very different from the ring-like morphology of gas and of star-forming regions. Here we propose that this is because star formation is confined within the disk of the galaxy, while radio polarization maps show the regular magnetic field averaged along the path length that includes the off-plane gas. The scale-height of the off-plane gas, from which polarized emission is observed in galaxies, is about 1 kpc, as indicated by maps of the magnetic field in edge-on spirals (Beck 2000). Although the total radio signal is largest from the dense in-plane gas, star-forming activity creates field turbulence there, which lowers the degree of polarization in the nuclear star-forming ring in the plane of NGC 1097. If field turbulence in regions far from the galactic plane is much lower, then most of the polarized emission may be coming from the off-plane gas, even when most of the total radio emission is coming from the disk. Then vectors in polarization maps will trace kinematics of the off-plane gas. Polarization vectors observed in NGC 1097 (bottom panel of Fig.6) indicate strong ordered magnetic field on top of the star-forming nuclear ring, as well as a field aligned with the large-scale dust lanes and with the central spiral. Directions of these vectors are consistent with our scenario, in which parts of the principal shock that propagate in the off-plane gas give rise to a spiral pattern, which crosses the nuclear ring. Note that in this scenario the magnetic field is just a tracer of gas motions, and it does not play a dynamical role. The role of magnetic fields in extraplanar gas is most likely important, and full magnetohydrodynamical approach may be needed in order to understand the propagation of waves past the nuclear ring.
If the polarized emission comes mostly from the off-plane gas, then another paradox in NGC 1097 noticed by Beck et al. (1999) can be explained in a similar way. Beck et al. observe a depolarization zone, which they ascribe to a shock, upstream from the straight principal dust lanes. Hydrodynamical models (e.g. Englmaier & Gerhard 1997, Maciejewski et al. 2002) indicate that the distance of the principal shock from the major axis of the stellar bar decreases with the velocity dispersion in gas. This is also seen in the top panel of Fig. 6. If the depolarization zones mark shocks in the off-plane warmer gas, then they are expected to be located closer to the major axis of the bar than the dust lanes, which mark shocks in the dynamically cold gas in the plane of the disk.
4.3 Central spiral in NGC 1097 as a shock in gas. The role of the inner bar
Whether the central spiral in NGC 1097 is a shock or a weak wave has direct implications for the expected inflow of gas to the center. A weak wave triggers no inflow, while shocks are capable of supplying enough gas to the galactic center to maintain the AGN activity (Maciejewski 2004b). Nuclear spirals in barred galaxies can be shocks throughout their extent from the principal shock in the bar to the galactic center (Maciejewski et al. 2002). Nuclear spiral shocks in gas tend to have pitch angle larger than what the linear theory of gaseous density waves predicts (Maciejewski 2004b). The observed large pitch angle of the central spiral in NGC 1097 is beyond the linear regime, which is suggestive of a spiral shock. The optical emission from the region between the nucleus and the ring reveals a typical LINER spectrum with strong low excitation lines and large line widths (FWHM of [NII] 6548 Å between 100 and 300 km s-1, Storchi-Bergmann et al. 1996), which are signatures of shock-excited gas (Contini & Viegas 2001, Viegas & Contini, 1989). This, together with the observed lack of star formation in the central spiral, favour the idea that this spiral is a shock with strong shear.
In Section 3.3 we noted that two of the three most prominent arms of the central spiral in NGC 1097 unwind at radii above 200 pc to almost straight filaments aligned with the inner bar. Thus one may think of an alternative explanation, which ascribes this spiral to the principal shock in the inner bar. However, principal shocks triggered by bars approach the major axis of the bar toward the bar’s ends, as seen both in nature and in numerical models, and accounted for by studies of orbital structure. On the contrary, in NGC 1097 the most pronounced north filament running along the inner bar departs from the bar’s major axis as the radius increases (see NACO -band image in Fig. 1). This difference already indicates that the gas dynamics in the inner bar of NGC 1097 is different from the well studied cases of large-scale bars. In particular the central spiral in this galaxy, with its three-arm symmetry, is most likely not generated by the inner bar. Nevertheless, appropriate modelling of this dynamics is necessary before firm conclusions are to be drawn about the role of the inner bar. The only models of a spiral density wave propagating through a nuclear bar built so far (Maciejewski 2004b) indicate that this bar can reshape the spiral shock, generated there by the outer bar. It does so by straightening parts of the spiral arms and aligning them with itself, which gives an impression of straight shocks, and resembles the morphology of the two spiral arms observed in the center of NGC 1097. However, the nuclear bar in those models is rather strong, while the inner bar observed in NGC 1097 is weak.
Finally, the curling of the spiral pattern in the innermost 100 pc (its pitch angle decreasing inward) may point at the presence of a supermassive black hole in the center of NGC 1097. Such a black hole in the center of a galaxy causes the nuclear spiral to wind up as it approaches the center, while in its absence the spiral would be unwinding with decreasing radius (Maciejewski 2004a).
5 Conclusions
The nucleus of NGC 1097 remains a point-like source at subarcsec scales in the near-IR. An upper limit to its size has FWHM pc. Accordingly, any putative central dusty torus or gaseous disk required by AGN unified schemes has to be smaller than 10 pc in diameter at near-IR wavelengths.
High spatial resolution achieved in the NACO/VLT observations of NGC 1097 presented here was sufficient to reveal in sharp detail an intricate network of filamentary structure in the central 10” (700 pc) of the galaxy. These filaments are seen directly in color maps (Fig. 5, bottom left). They also appear in extinction against the IR background light from the galaxy, and therefore they are likely to be tracers of cold material. On the basis of the IR colors, and assuming foreground extinction, a very moderate extinction toward the nuclear region () is determined. This is consistent with the extinction values derived from the Balmer decrement. Thus, if the filaments are tracing cold dust, they contribute to a very low extinction in the line of sight, and therefore they are likely to be distributed in a rather thin disk. The filaments are spiralling around the center from the nuclear star-forming ring to the nucleus, which is suggestive of them being channels by which cold dust and gas are flowing to the center. The CO and HCN maps hint to the presence of cold material in this region, though their resolution is insufficient to confirm the exact location of this material. The molecular 2.12 m emission is also present between the nucleus and the star-forming ring. We have recently collected AO-corrected band spectra of this region which should resolve spatially the dynamics of this warm gas.
The spiral network in NGC 1097 resembles nuclear spirals found in hydrodynamical models, where they are density waves driven by the shocks generated in a large-scale bar. There is a strong large-scale bar in NGC 1097 (Fig. 5, top panel), which can generate the shocks, but the nuclear star-forming ring may hamper propagation of the waves inward in the plane of the disk. In this paper we propose a scenario, in which, because of different dynamical conditions in the off-plane gas, waves propagating there wind into a spiral, and pass the nuclear ring. We cannot make a decisive statement on how these waves propagate inward from the nuclear ring – this would require full three-dimensional and probably magnetohydrodynamical models – but if the dispersion relation of waves excited there allows for their propagation, they should naturally form the observed central spiral. Radio polarization maps of NGC 1097 support this scenario, on the assumption that the polarization vectors trace the motion of the off-plane gas. These vectors show a progressive swing from an alignment with the principal shocks along the primary bar to a clear spiral pattern at the ring and further in. Interior to the ring, they closely follow some of the nuclear filaments (Fig. 6, bottom panel). Emission lines in this region, which show all the characteristics of shock-excited gas, together with large pitch angle of the central spiral, and the lack of star formation in the spiral arms, make a suggestive evidence that this spiral is a shock with strong shear, along which gas and dust can be channelled to the center of NGC 1097.
6 Acknowledgments
We are thankful to Rainer Beck for interesting discussions and for providing us with the radio polarization map of NGC 1097 displayed in Fig. 6, bottom. We acknowledge comments from John Maggorian on this manuscript. This work was partially supported by the grant 1 P03D 007 26 from the Polish Committee for Scientific Research.
References
- (1) Barth, A.J., Ho, L.C., Filippenko, A.V., Sargent, W.L. 1995, AJ, 110, 1009
- (2) Beck, R., Ehle, M., Shoutenkov, V., Shukurov, A. & Sokoloff, D. 1999, Nature 397, 324
- (3) Beck, R. 2000, Phil. Trans. R. Soc. Lond. A 358, 777
- (4) Beck, R. Fletcher, Shukurov, A. et al. 2005, in preparation
- (5) Contini, M & Viegas, S. 2001, ApJSS 132, 211
- Contini, Viegas & Prieto (2004) Contini, M., Viegas, S.M. & Prieto, M.A. 2004, MNRAS 348, 1065
- (7) Elmegreen, B. 1994, ApJ 433, 39
- (8) Englmaier, P. & Gerhard, O. 1997, MNRAS 287, 57
- (9) Englmaier, P. & Shlosman, I. 2000, ApJ 528, 677
- (10) Gomez, G. & Cox, D. P. 2002, ApJ 580, 235
- (11) Kohno, K., Ishizuki, S., Matsushita, S., Vila-Vilaro, B. & Kawabe, R. 2003, PASJ 55, L1
- (12) Kotilainen, J.K., Reunanen, J., Laine, S., Ryder, S.D. 2000, A&A, 353, 834
- (13) Maciejewski, W., 2004a, MNRAS 354, 883
- (14) Maciejewski, W., 2004b, MNRAS 354, 892
- (15) Maciejewski, W., Teuben, P. J., Sparke, L. S. & Stone, J. M., 2002, MNRAS 329, 502
- (16) Martini, P., Regan, M. W., Mulchaey, J. S., Pogge, R. W. 2003, ApJS 146, 353
- (17) Martos, M. A. & Cox, D. P. 1998, ApJ 509, 703
- (18) Pogge, R. W., Martini, P. 2002, ApJ 569, 624
- (19) Quillen, A.C., Frogel, J., Kuchinski, L. E. & Terndrup, D. M. 1995, AJ 110, 156
- (20) Reunanen, J., Kotilainen, J. & Prieto, M.A., 2002, MNRAS 331, 154
- (21) Sersic, J.-L. 1968, Atlas de Galaxias Australes (Cordoba: Observatorio Astronomico)
- (22) Schinnerer, E., Maciejewski, W., Scoville, N. & Moustakas, L. A., 2002, ApJ 575, 826
- (23) Storchi-Bergmann, T, Baldwin, J. A, Wilson, A., 1993, ApJ 410, L11
- (24) Storchi-Bergmann, T. et al. 1995, ApJ 443, 617
- (25) Storchi-Bergmann, T, Wilson, A. & Baldwin, J. A. 1996, ApJ 460, 252
- (26) Terashima, Y., Iyomoto, N. Ho, L., Ptak, A. 2002, ApJSS 139, 1
- (27) Tully, R.B. 1988, Nearby Galaxies Catalogue, Cambridge University Press.
- (28) Viegas, S & Contini, M. 1989, ApJ 339, 689


| Band | AGN | SB galaxy | n | reff | reff |
|---|---|---|---|---|---|
| mag | mag/arcsec | ″ | pc | ||
| J | 12.1 | 18 | 1.95 | 13.0 | 890 |
| H | 10.8 | 16.2 | 2.05 | 11.5 | 800 |
| Ks | 9.8 | 16.7 | 2.00 | 10.2 | 720 |
| r | J | H | Ks | (J-H)s | (H-Ks)s | (J-H)m | (H-Ks)m |
|---|---|---|---|---|---|---|---|
| ″ | % | % | % | mag | mag | ||
| 0.1 | 67.7 | 75.9 | 90.9 | 0.88 | -0.14 | 0.95 | 0.29 |
| 0.2 | 45.2 | 51.8 | 68.4 | 0.94 | 0.27 | 0.93 | 0.29 |
| 0.3 | 36.3 | 41.4 | 59.3 | 0.92 | 0.23 | 0.92 | 0.29 |
| 0.4 | 28.0 | 32.0 | 48.9 | 0.91 | 0.25 | 0.91 | 0.29 |
| 0.5 | 23.0 | 26.4 | 42.3 | 0.90 | 0.26 | 0.89 | 0.28 |
| 0.6 | 18.8 | 21.7 | 36.1 | 0.80 | 0.27 | 0.89 | 0.28 |
| 0.7 | 15.8 | 18.4 | 31.6 | 0.88 | 0.27 | 0.88 | 0.28 |
| 0.8 | 13.5 | 15.7 | 27.7 | 0.87 | 0.27 | 0.87 | 0.28 |
| 0.9 | 11.6 | 13.6 | 24.3 | 0.86 | 0.28 | 0.86 | 0.28 |
| 1.0 | 10.1 | 11.9 | 21.6 | 0.86 | 0.28 | 0.86 | 0.28 |
| 2.0 | 3.9 | 4.7 | 9.4 | 0.82 | 0.28 | 0.81 | 0.27 |