11email: s.gburillo@oan.es 22institutetext: Observatoire de Paris, LERMA, 61 Av. de l’Observatoire, 75014-Paris, France
22email: francoise.combes@obspm.fr 33institutetext: Max-Planck-Institut für Astronomie, Königstuhl, 17, 69117-Heidelberg, Germany
33email: schinner@mpia-hd.mpg.de 44institutetext: Max-Planck-Institut für Radioastronomie, Auf dem Hügel, 69, 53121-Bonn, Germany.
44email: fboone@mpifr-bonn.mpg.de 55institutetext: Istituto di Radioastronomia/CNR, Sez. Firenze, Largo Enrico Fermi, 5, 50125-Firenze, Italy
55email: hunt@arcetri.astro.it
Molecular Gas in NUclei of GAlaxies (NUGA)
We discuss the efficiency of stellar gravity torques as a mechanism to account for the feeding of the central engines of four low luminosity Active Galactic Nuclei (AGN): NGC 4321 (HII nucleus/LINER), NGC 4826 (HII nucleus/LINER), NGC 4579 (LINER 1.9/Seyfert 1.9) and NGC 6951 (Seyfert 2). These galaxies have been observed as part of the NUclei of GAlaxies–(NUGA) CO project, aimed at the study of AGN fueling mechanisms. Our calculations allow us to derive the characteristic time-scales for gas flows and discuss whether torques from the stellar potentials are efficient enough to drain the gas angular momentum in the inner 1 kpc of these galaxies. The stellar potentials are derived using high-resolution near infrared (NIR) images and the averaged effective torques on the gas are estimated using the high-resolution (0.5”–2”) CO maps of the galaxies. Results indicate paradoxically that feeding should be thwarted close to the AGNs: in the four cases analyzed, gravity torques are mostly positive inside r200 pc, resulting in no inflow on these scales. As a possible solution for the paradox, we speculate that the agent responsible for driving inflow to still smaller radii is transient and thus presently absent in the stellar potential. Alternatively, the gravity torque barrier associated with the Inner Lindblad Resonance of the bars in these galaxies could be overcome by other mechanisms that become competitive in due time against gravity torques. In particular, we estimate on a case-by-case basis the efficiency of viscosity versus gravity torques to drive AGN fueling. We find that viscosity can counteract moderate–to–low gravity torques on the gas if it acts on a nuclear ring of high gas surface density contrast and a few 100 pc size.
We propose an evolutionary scenario in which gravity torques and viscosity act in concert to produce recurrent episodes of activity during the typical lifetime of any galaxy. In this scenario the recurrence of activity in galaxies is indirectly related to that of the bar instabilities although the active phases are not necessarily coincident with the maximum strength of a single bar episode. The general implications of these results for the current understanding of fueling of low-luminosity AGN are discussed.
Key Words.:
Galaxies:individual:(NGC 4321, NGC 4579, NGC 4826, NGC 6951) – Galaxies:ISM – Galaxies:kinematics and dynamics – Galaxies:nuclei – Galaxies:Seyfert – Radio lines: galaxies1 Introduction
The phenomenon of nuclear activity is understood to be a result of the feeding of supermassive black holes (SMBHs) in galactic nuclei. Observational evidence accumulated over the last decade indicates that SMBH exist in most galactic bulges (e.g., Kormendy & Richstone kor95 (1995); Magorrian et al. mag98 (1998); Ferrarese & Merritt fer00 (2000); Gebhardt et al. geb00 (2000)). Among all these massive black holes, very few are highly active. AGN are found in 10 of the local galaxies (Ho et al. ho97 (1997)); however, this percentage is increased up to 44 if LINERs are taken into account. One of the present challenges is to understand how AGN can be fed during their lifetime. In the feeding problem the gas supply must come from the whole disk of the host galaxy at large distances compared to the radius of gravitational influence of the central engine. Therefore it is expected that a hierarchy of mechanisms combine to drive virtually all the gas from the large kpc scales down to the inner pc scales. The different spatial scales involved suggest that the various mechanisms at work have very different time scales (Shlosman et al. shl89 (1989, 1990); Combes com01 (2001, 2003); Jogee jog04 (2004)). Recent observational and theoretical evidence indicates that the AGN lifetimes may be as short as a few 107–108yr (Ho et al. ho03 (2003); Martini mar04 (2004); Wada wad04 (2004); Merloni mer04 (2004)). Moreover, Wada (wad04 (2004)) finds evidence that mass accretion may not be constant even during the nominal duty cycle of 108yr, but composed of several shorter episodes with a duration of 104-5yr. This time-scale conspiracy could explain the lack of success of observers in finding any correlation between the presence of kpc scale non-axisymmetric perturbations (e.g., large-scale bars and interactions) and the onset of activity in galaxies, except for very high luminosity objects(QSOs) (Moles et al. mol95 (1995); Mulchaey & Regan mul97 (1997); Knapen et al. kna00 (2000); Krongold et al. kro01 (2001); Schmitt sch01 (2001)). On these spatial scales, Hunt & Malkan (hun99 (1999)) have found a significant correlation between the detection rate of outer rings and the onset of activity.
| Galaxy | (∘) | (∘) | (Mpc) | scale(pc/′′) | RA2000 | Dec2000 | v(km s-1) | CO(1–0)() | CO(2–1)() |
|---|---|---|---|---|---|---|---|---|---|
| NGC 4321 | 153 | 32 | 16.8 | 83 | 12h22m54.91s | 15o49′19.9′′ | 157310 | 2.21.2 | – |
| NGC 4826 | 112 | 54 | 4.1 | 20 | 12h56m43.63s | 21o40′59.1′′ | 41310 | 2.51.8 | 0.70.5 |
| NGC 4579 | 95 | 36 | 19.8 | 97 | 12h37m43.52s | 11o49′05.5′′ | 146910 | 2.01.3 | 1.00.6 |
| NGC 6951 | 134 | 42 | 19 | 93 | 20h37m14.12s | 66o06′20.0′′ | 144110 | 1.41.1 | 0.60.5 |
The search for a universal feeding mechanism has been pursued by looking for morphological features in the central kpc of nearby AGN with high spatial resolution (a few 100 pc), though with limited success. Nuclear stellar bars seem to be as common in AGN as in non-AGN (Regan & Mulchaey reg99 (1999); Laine et al. lai02 (2002)). Furthermore, a similar scenario holds for nuclear spirals: while Martini & Pogge (mar99 (1999)) and Pogge & Martini (pog02 (2002)) initially found a high frequency of dusty spirals in the HST enhanced color images of Seyfert nuclei of their sample, more recently, Martini et al. (mar03 (2003)) have shown on a firmer statistical basis that these nuclear features are not preferentially found in AGN. Similarly there is only weak statistical evidence that nuclear rings are more frequently found in Seyferts (Knapen kna05 (2005)). Hunt & Malkan (huntmalkan04 (2004)) found evidence for an excess in type 2 Seyferts of kpc-scale twisted isophotes, though the cause of such twists is unclear.
On the modeling front, significant progress has been made in recent years on the study of the feeding efficiency of different types of gravitational instabilities: nested bars (e.g., Shlosman et al. shl89 (1989); Friedli & Martinet fri93 (1993); Maciejewski & Sparke mac00 (2000); Englmaier et al. eng04 (2004)), gas spiral waves (e.g., Englmaier & Shlosman eng00 (2000); Maciejewski et al. mac02 (2002); Maciejewski 2004a ; 2004b ), perturbations (e.g., Shu et al. shu90 (1990); Junqueira & Combes jun96 (1996); García-Burillo et al. gb00 (2000)) and nuclear warps (e.g., Schinnerer et al. sch00 (2000)). However, the lack of high quality multi-wavelength observational constraints on the different models has thus far made the choice of a single optimal scenario rather difficult.
The study of interstellar gas in AGN is essential to understand the phenomenon of nuclear activity in galaxies and its possible link to circumnuclear star formation. As most of the neutral gas in galactic nuclei is in the molecular phase, CO lines are best suited to undertake high-resolution mapping of AGN hosts, with interferometer resolution of 100 pc, i.e., the scales on which secondary modes embedded in kpc-scale perturbations are expected to take over. CO lines better trace the total gas column densities than dust extinction probes obtained from HST NIR/optical color images. Most importantly, CO maps provide the gas kinematics (velocity fields and velocity dispersions). This information is essential to characterize gravitational instabilities and to constrain the models. The NUclei of GAlaxies–NUGA–project, fully described by García-Burillo et al. (2003a ; 2003b ), is the first high-resolution (0.5′′–1′′) CO survey of 12 low luminosity AGN (LLAGN) including the full sequence of activity types (Seyferts, LINERs and transition objects from HII to LINER). In the case of LLAGN, the required mass accretion rates derived from the typical bolometric luminosities of these objects range from 10-2 to 10-5M⊙yr-1 (from Seyferts to LINERs; e.g., see compilation by Jogee jog04 (2004)). Observations, carried out with the IRAM Plateau de Bure Interferometer (PdBI), have been completed early 2004. NUGA surpasses in both spatial resolution and sensitivity ongoing surveys of nearby AGN conducted at OVRO (MAIN: Jogee et al. jog01 (2001)) and at NRO (Kohno et al. koh01 (2001)).
In this paper we focus on the study of gravitational torques in a subset of NUGA galaxies, which span the range of the different activity classes within our sample: NGC 4321 (transition object: HII/LINER), NGC 4826 (transition object: HII/LINER), NGC 4579 (LINER 1.9/Seyfert 1.9) and NGC 6951(Seyfert 2). Information on the stellar potentials, obtained through available HST and ground-based optical/NIR images of the sample, is used to determine the gravitational torques exerted by the derived stellar potentials on the gaseous disk. The efficiency with which gravitational torques drain the angular momentum of the gas depends first on the strength of the non-axisymmetric perturbations of the potential (m0) but, also, on the existence of significant phase shifts between the gas and the stellar distributions. The estimate of these phase shifts necessarily requires the availability of images of comparably high spatial resolution (0.5′′ in our case) showing the distribution of the stars and the gas. In this paper we purposely neglect the role of gas self-gravity as a source of non-axisymmetry in the gravitational potential. Nuclear galaxy disks with a high gas surface density and a mostly axisymmetric stellar potential can be prone to develop this kind of gas self-gravitating perturbation. We purposely defer the study of pure gas instabilities and their ability to drive gas inflow to a forthcoming publication.
We describe in Sect. 2 the observations used, including high-resolution CO maps and NIR images of NGC 4321, NGC 4826, NGC 4579 and NGC 6951. Sect. 3 interprets them in terms of AGN feeding. Sect. 4 computes from NIR images the gravitational potentials and forces, and deduces from the CO maps the effective torques applied to the gas. From these torques, it is possible to derive time-scales for gas flows and discuss whether gravity torques alone are efficient enough to feed the AGNs. The general implications of these results for the current understanding of AGN feeding are presented in Sect. 5.
2 Observations
2.1 CO NUGA observations
Observations of the circumnuclear disks of NGC 4826, NGC 4579 and NGC 6951 were carried out as part of the NUGA survey with the PdBI between December 2000 and March 2003. We used the ABCD set of configurations of the array (Guilloteau et al. gui92 (1992)). This assures high spatial resolution (1′′ at the highest frequency) but also an optimum sensitivity to all spatial frequencies in the maps. A previous set of observations of NGC 4826, using data taken with the BCD configurations, has been discussed in García-Burillo et al. (2003b ) (hereafter called paper I). We have observed simultaneously the J=1–0 and J=2–1 lines of 12CO in single fields. Table 1 lists the spatial resolution of these CO observations as well as other source related parameters. The primary beam size is 42′′ (21′′) in all the 1–0 (2–1) line observations. As the bulk of the relevant nuclear disk emission arises well inside the central 15′′ in the four galaxies discussed in this paper, observations have not been corrected for primary beam attenuation. During the observations the spectral correlator was split in two halves centered at the transition rest frequencies corrected for the assumed recession velocities. The correlator configuration covers a bandwidth of 580 MHz for each line, using four 160 MHz-wide units; this is equivalent to 1510 km s-1(755 km s-1) at 115 GHz (230 GHz). Visibilities were obtained using on-source integration times of 20 minutes framed by short ( min) phase and amplitude calibrations on nearby quasars. The absolute flux scale in our maps was derived to a 10% accuracy based on the observations of primary calibrators whose fluxes were determined from a combined set of measurements obtained at the 30m telescope and the PdBI array. Image reconstruction was done using standard IRAM/GAG software (Guilloteau & Lucas gui00 (2000)). In this work we use prior observations of the 1–0 line of 12CO of NGC 4321 made using the BCD configurations of the PdBI and previously published by García-Burillo et al. (gb98 (1998)) (see this paper and Table 1 for details).
Depending on the resolution/sensitivity requirements, we use either naturally or uniformly weighted line maps, as indicated throughout the paper. Uniform weighting in the 2–1 line enables us to achieve subarcsecond spatial resolution in the maps of NGC 4826, NGC 4579 and NGC 6951. By default, all velocities are referred to the systemic velocities (vsys, listed in Table 1), as determined from this work and from García-Burillo et al. (gb98 (1998)). Similarly (, ) offsets are relative to the AGN loci derived from our own estimates (Table 1).
Molecular gas masses are derived from the CO(1–0) integrated intensities assuming a CO–to–H2 conversion factor X=N(H2)/ICO(1-0)=2.21020cm-2 K-1 km-1 s (Solomon & Barrett sol91 (1991)). When required, molecular gas column densities are inferred from the CO(2–1) integrated intensity maps. In this case CO(2–1) intensities are first corrected by the 2–1/1–0 ratio measured within the equivalent 1–0 beam at each position, and subsequently we convert them into N(H2) assuming the X factor referred to above.
We have estimated the percentage of CO(1–0) flux recovered in the PdBI maps by comparing the single-point fluxes detected by the 30m telescope (García-Burillo & Krips, private communication) towards the nuclei of the four galaxies discussed in this paper with the fluxes recovered in the PdBI maps, corrected by primary beam attenuation and convolved to the 30m resolution at this frequency (21). The fraction of the flux recovered inside the 21 field-of-view ranges from 60-65 in NGC 6951 and NGC 4579 to 75 in NGC 4321 and 90 in NGC 4826. The corresponding values for the 2–1 line of CO are comparable. The missing zero spacing flux in these maps is expected to be found in low-level emission arising in the shape of smooth extended components. As has been shown by Helfer et al. (hel03 (2003)), who estimated the percentage of flux recovery in BIMA SONG galaxies using the 12m NRAO telescope, this percentage is always very high in the central regions of galaxies (i.e., the domain of NUGA maps). The reason is that the velocity gradient is largest at the nuclear regions. CO emission is thus confined to much smaller areas in individual channel maps compared to the outer disk regions where the percentage of flux filtered out can be higher. Considering that the percentage of flux actually present in the PdBI maps over the total single-dish estimate is moderate–to–large in the galaxies studied here (see above), we do not expect that the morphology of the maps will significantly change by the addition of a plateau-like component. Moreover, the gravity torque calculation developed in this paper is based on azimuthal averages made to infer time-scales for the gas flows in these galaxy nuclei. The approach followed makes our results virtually insensitive to the presence of a weak extended component: gravity torques on this type of source distribution will be zero. Therefore we do not expect the derived torque budget to be significantly biased.
2.2 Near-infrared and optical observations
We acquired from the HST archive111Based on observations made with the NASA/ESA Hubble Space Telescope, obtained from the data archive at the Space Telescope Science Institute. STScI is operated by the Association of Universities for Research in Astronomy, Inc. under NASA contract NAS 5-26555. broadband images of NGC 4826, NGC 4579 and NGC 6951, including three NICMOS images (F110W and F160W for NGC 6951; F160W for NGC 4826) and four WFPC2 images (F450W and F814W for NGC 4826; F555W and F814W for NGC 4579). The optical images were combined using (crreject) to eliminate cosmic rays, and calibrated according to Holtzman et al. (holtzman (1995)). The NICMOS images were re-reduced with the STSDAS task calnica using the best reference files, and the images were calibrated in the standard way. The “pedestal” effect (see Böker et al. bok99 (1999)) was removed with the van der Marel algorithm222http://www.stsci.edu/marel/software/pedestal.html. Sky values were assumed to be zero since the galaxy filled the WFPC2/NICMOS frames, an assumption which makes an error of 0.1 mag at most, in the corner of the images. A J-H color image of NGC 6951 was constructed from F110W-F160W according to the transformations by Origlia & Leitherer (origlia (2000)). For NGC 4321, we have adopted the (ground-based) K-band image presented by Knapen et al. (kna95 (1995)).
3 Observational evidence of ongoing feeding
3.1 NGC 4321
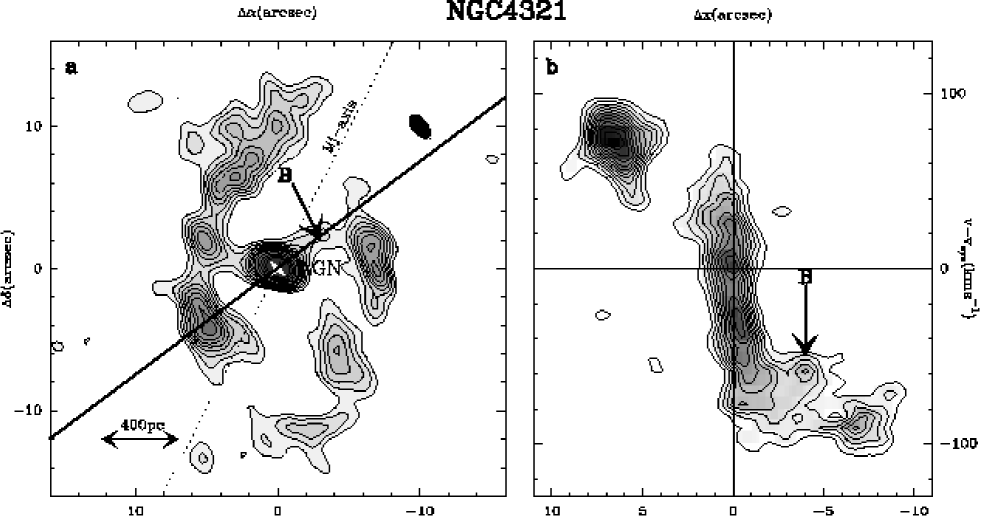
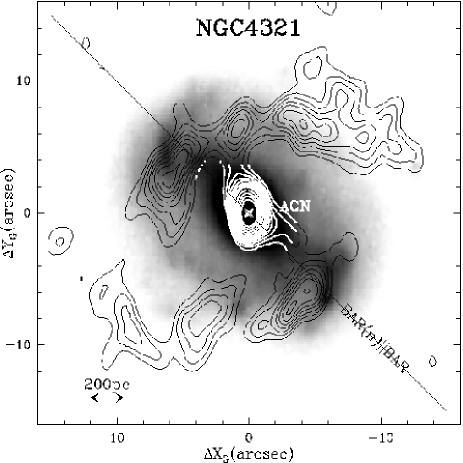
The inner r1.5 kpc of this galaxy was mapped by García-Burillo et al. (gb98 (1998)) with the PdBI at moderate (2”) spatial resolution in the 1–0 line emission of 12CO. NGC 4321 has been classified as a transition object (i.e., HII/LINER) by Ho et al. (ho97 (1997)). As can be seen in Fig. 1a, molecular gas in the nucleus of NGC 4321 is concentrated in a two spiral arm structure that starts at r550 pc, near the end points of a prominent nuclear bar (detected in the K band by Knapen et al. kna95 (1995); see also Fig. 5) and extends out to r1.2 kpc. There is also a central CO source coinciding with the AGN which is marginally resolved (r150 pc) by the 2” beam. This central source contains a molecular gas mass of 108M⊙. The CO spiral arms mostly lie at the trailing edges of the nuclear bar. This particular geometry determines the feeding budget for the gas in this region (see Sect. 4.2.1). The spiral arms and the central source are connected by a molecular gas bridge which is spatially resolved NW of the nucleus, i.e., at the leading edge of the nuclear bar (component B in Fig. 1b). García-Burillo et al. (gb98 (1998)) interpreted these CO observations and their relation with other gaseous and stellar tracers using numerical simulations of the cloud hydrodynamics. They found that the best fit for the gas flow corresponds to the nuclear bar being decoupled from the large-scale bar. The nuclear bar is fast, with a pattern speed 150 km s-1kpc-1. This pushes corotation of the nuclear bar inward, likely inside the outer edges of the CO spiral arms.
The kinematics of molecular gas are characterized by streaming motions detected in the CO spiral arms (see discussion in García-Burillo et al. gb98 (1998)). Closer to the AGN (r500 pc), we find that molecular gas also displays significant departures from circular rotation at the location of B. Fig. 1b shows the position-velocity (p-v) plot along a strip at PA=127∘, purposely oriented to illustrate the CO kinematics at B. The discontinuity in radial velocities at x–4” indicates that the molecular gas flow is decelerated, exactly as expected if gas flows along the leading edges of the bar. Details on the kinematics of molecular gas in the central component are hidden due to the insufficient spatial resolution of the CO maps. We notice however that molecular gas emission is asymmetric with respect to vsys: CO emission is preferentially blue-shifted.
As is the case for the other transition object analyzed in this paper (NGC 4826), we have found a large molecular gas concentration (108M⊙) near the AGN in NGC 4321 (r150 pc). The analysis of gas kinematics provides evidence for gas fueling at present on intermediate scales: at r200-300 pc from the AGN. However, the spatial resolution of the CO maps does not allow us to probe closer than 100 pc from the AGN.
3.2 NGC 4826
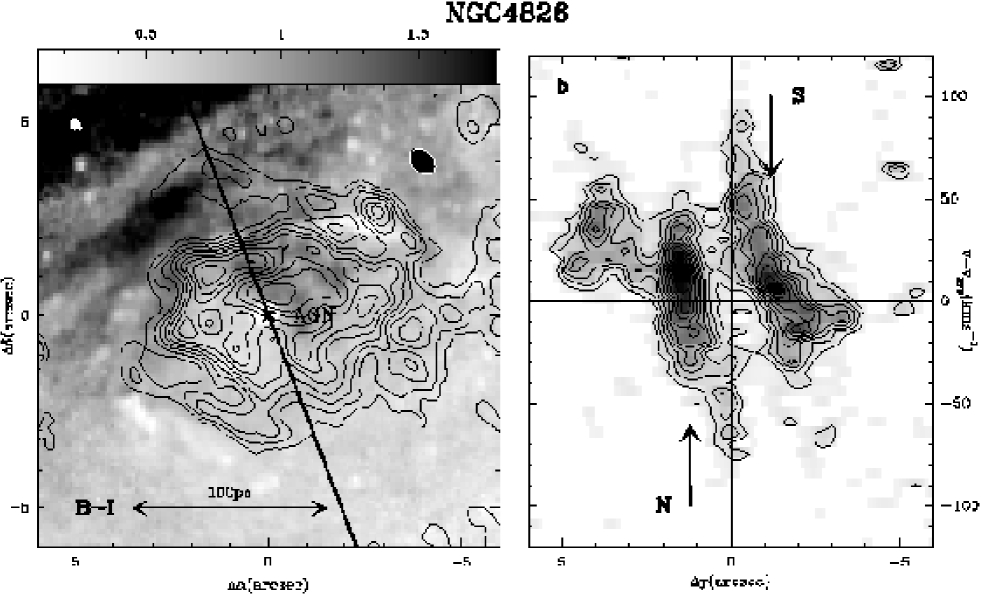
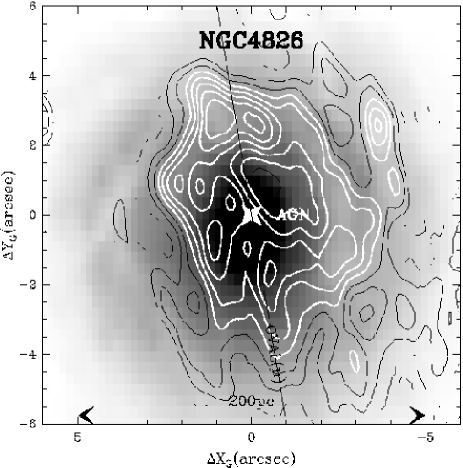
The first NUGA maps of the transition object NGC 4826 were published in paper I. The CO images showed already a large concentration of molecular gas (1600M☉/pc2 ) in the 160 pc-diameter circumnuclear disk (CND) of this galaxy. The distribution of molecular gas in the inner CND is significantly lopsided with respect to the position of the AGN; this suggests that m=1 instabilities may be at work at radial distances of r50–60 pc from the central engine. With the newest 0.5′′ (10 pc) resolution 12CO(2–1) observations the distribution of molecular gas in the CND is fully resolved; the CND appears in the new maps as an off-center ringed disk (Fig. 2a). The dynamical center of the galaxy determined from these observations coincides within the errors with a blue point source identified in the B-I HST color map of Fig. 2a. This confirms our earlier findings that the putative super massive black hole lies on the southeastern inner side of the off-center ringed disk.
The gas kinematics in the CND are characterized by the presence of streaming motions. A first analysis of the 2D kinematics performed on the lowest resolution data of paper I indicated that the instabilities identified in the CND (and those of the inner m=1 spiral) may not favor AGN feeding. The information contained in the newest images confirms this result. Fig. 2b shows the departures from circular motion of gas velocities, identified at the northern and southern crossings of the CND ring along the minor axis. Gas velocities become systematically redder (bluer) when we approach the nucleus from the southern (northern) side of the ring along the minor axis. Deprojected onto the galaxy plane (North is the near side), this pattern indicates that the radial velocity component changes from an inflow signature (outside the ring) into an outflow signature (inside the ring). As it is fully discussed in paper I, this measured change of sign across the minor axis is compatible with the pattern expected for a trailing wave outside corotation (fast wave), i.e., the type of perturbation that would not help to drain the gas angular momentum. The driving agent of these ’mainly’ gaseous instabilities may not be related to the stellar potential which is essentially featureless and mostly axisymmetric (see Sect. 4.2.2 and discussion of paper I).
Based on the CO maps of NGC 4826 we find little evidence of ongoing AGN feeding at scales r150 pc from the AGN. While the molecular gas reservoir of NGC 4826 is abundant (3107M⊙) close to its central engine (r150 pc), the analysis of gas kinematics provides no evidence that ongoing AGN feeding is at work in this transition object.
3.3 NGC 4579
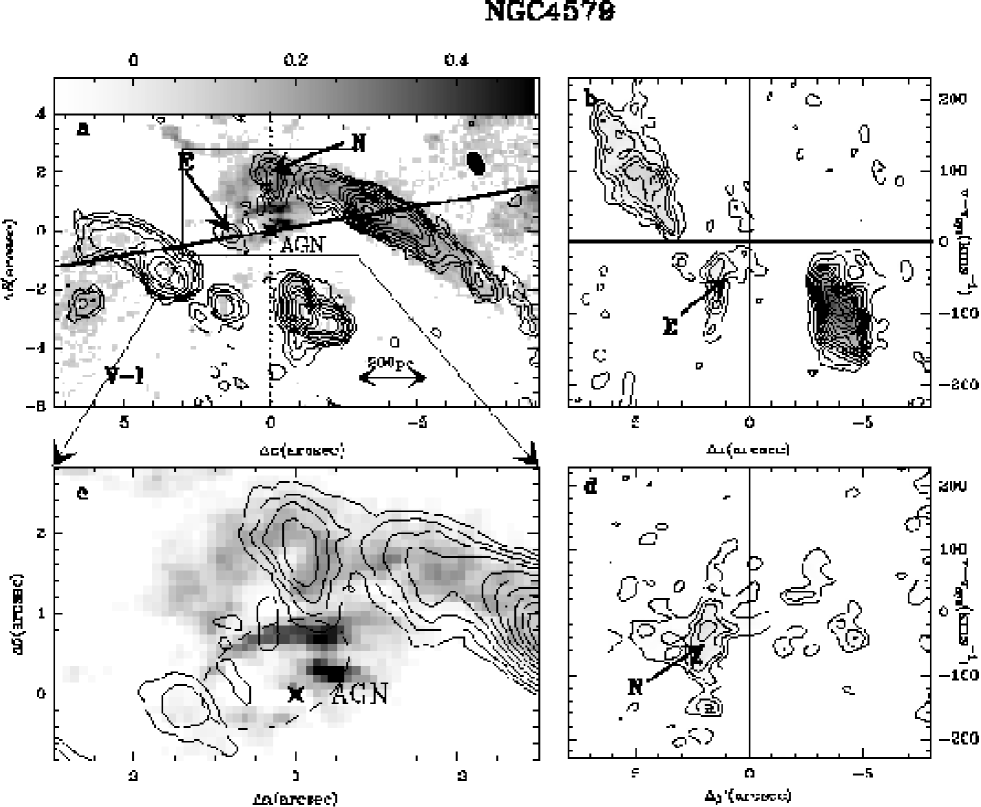
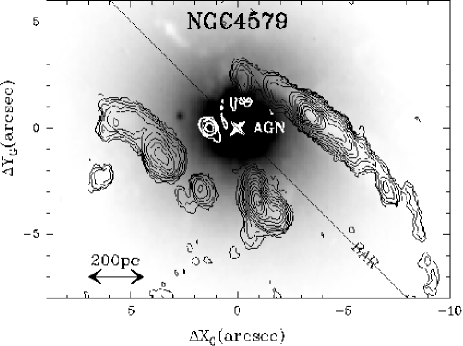
The 12CO(2–1) emission in the S1.9/L1.9 galaxy NGC 4579 has been mapped at 0.5′′ resolution (see Fig. 3a adapted from García-Burillo et al. 2005 in prep.). The molecular gas distribution in the central 1 kpc of NGC 4579 suggests that the gas flow responds to the 9 kpc-diameter stellar bar identified in all the NIR images of this galaxy (e.g. Jarret et al. jar03 (2003)). The 12CO(2–1) map of Fig. 3a reveals a mass of 3.2108M⊙ of molecular gas piled up in two highly contrasted spiral arcs. The CO lanes lie at the leading edges of the stellar bar, which is oriented along PA=58∘. The northern spiral is more continuous and better delineated than its southern counterpart; it is also very well correlated with the red lane seen North in the V–I color HST image of the galaxy, shown in Fig. 3a. There is little molecular gas at r100 pc distance from the central engine of NGC 4579: the closest gas complex of 106M⊙ lies East of the nucleus at r150 pc (complex E in Fig. 3a, b). There is no molecular gas emission coincident with the AGN itself to a 3 detection limit of a few 105M⊙. The V–I color HST image of the galaxy helps to identify the eastern molecular complex as part of a structured disk of 150 pc-diameter and ring-like shape (Fig. 3a, c). The position of the AGN is well defined by its radio continuum emission detected at both 1mm and 3mm coming from a point source that lies close to the southwestern edge of the central disk. This indicates that the point-symmetry of the gas flow driven by the bar of NGC 4579 breaks up at r200 pc and lets lopsidedness take over. An independent confirmation of this picture comes from the new HST image of the nuclear region of NGC 4579 obtained with the ACS camera at 3300 Å; this image resolves the central disk into a winding spiral instability that mimics a ring (Contini con04 (2004)).
The kinematics of molecular gas in the central 1 kpc of NGC 4579 are characterized by the presence of highly non-circular motions detected over the spiral arms and most notably over the central disk. Fig. 3b shows the p-v plot along the kinematic major axis of NGC 4579 (PA=95∘). The radial velocities of the gas in the central gas disk depart by 100kms-1 from the expected pattern of circular rotation: emission of the Eastern gas complex (at x1.5′′) appears at highly forbidden negative velocities (i.e., vvsys). Assuming that the gas flows inside the galaxy plane, the reported velocity deviations measured at E would imply that gas is apparently counter-rotating at a speed of v150kms-1. As it is discussed in García-Burillo et al. 2005, this could be qualitatively explained by very eccentric orbits. Alternatively, this velocity pattern could be accounted for assuming that gas is flowing out of the galaxy plane, possibly entrained by an expanding shell. The expanding shell scenario is supported by the observed kinematics of the gas close to the N side of the central disk. Fig. 3d shows the p-v plot taken along the declination axis, i.e., very close to the orientation of the minor axis. Molecular gas kinematics at the N complex (where v-v–75 kms-1) can be interpreted either as gas flowing outward inside the plane along the minor axis (North is the near side), or as a signature of out of the plane motions (similarly to the case of the E complex). In either case this implies that AGN fueling is presently thwarted on these scales.
In summary, most of the molecular gas content of the central 1 kpc of NGC 4579 is trapped in a two arm spiral structure that can be traced from r1 kpc down to r200 pc. Some molecular gas (106M⊙) is detected at r150 pc from the central engine of NGC 4579, but not on the position of the central engine itself (a few 105M⊙). The first-order interpretation of the complex gas kinematics at r150 pc provides no evidence of ongoing inflow from these scales down to the AGN, but on the contrary, it indicates outflow motions.
3.4 NGC 6951
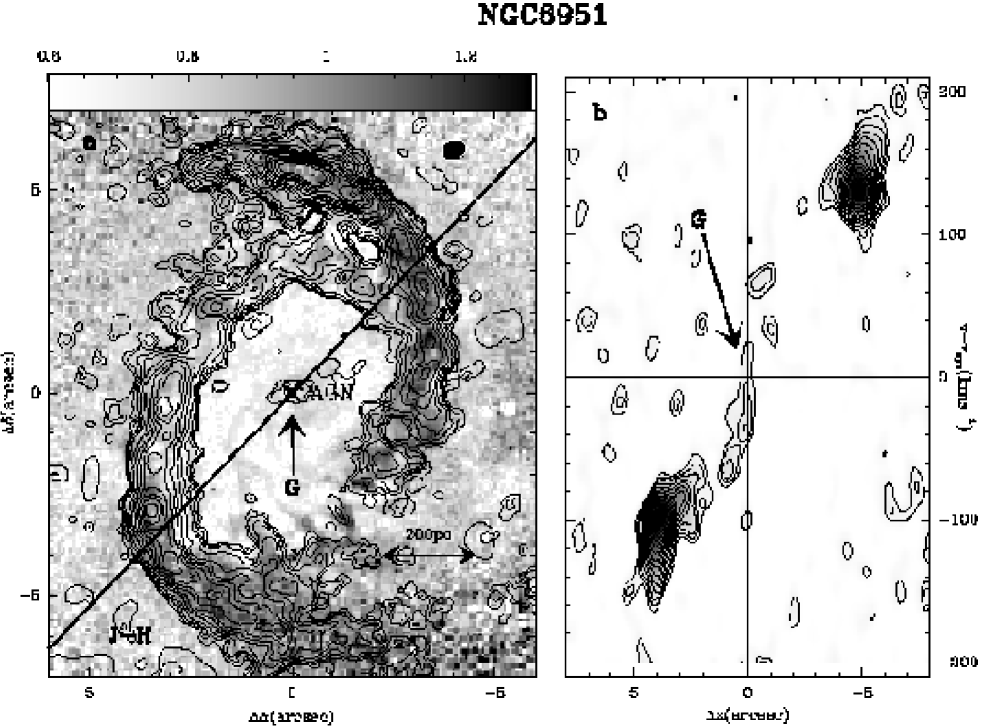
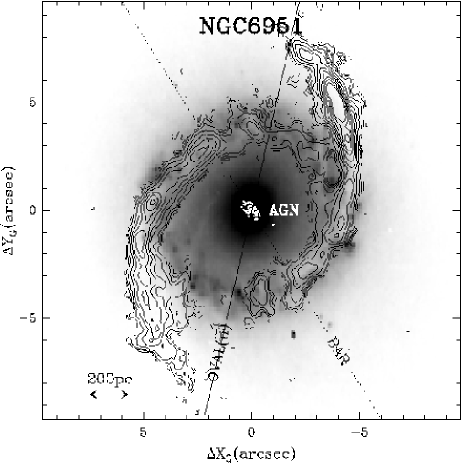
NGC 6951 is a prototypical Seyfert 2 galaxy for which sub-arcsecond resolution 12CO(2–1) maps have been completed within the NUGA project (Fig. 4a adapted from Schinnerer et al. 2005, in prep.). The molecular gas distribution in the central 1 kpc consists of two nuclear spiral arms that can be traced for over 180∘; the winding spiral arms end up as a highly contrasted pseudo-ring at r350 pc. The spiral arms can be identified by their red color in the J–H HST image of the galaxy, shown in Fig. 4a. This gas instability contains a significant gas reservoir of 3108M⊙ which is presently feeding a nuclear starburst, also identified by its intense radio continuum and H emissions (Ho & Ulvestad ho01 (2001), Rozas et al. roz02 (2002)). The geometry of the molecular gas ridges likely reflects the crowding of molecular clouds along the x2 family of orbits of the prominent stellar bar, detected in all NIR images of NGC 6951 (Márquez & Moles mar93 (1993); Friedli et al. fri96 (1996); Pérez et al. per00 (2000)). As shown in Fig. 4a, only a small amount of molecular gas has succeeded in making its way down to the AGN: most of the molecular gas mass is trapped in the nuclear spiral arms, quite similar to the case of NGC 4579 (though in this galaxy molecular gas likely populates both x1 and x2 orbits). A compact unresolved molecular complex (denoted as G in Fig. 4a, b) of a few 106M⊙ is detected at the position of the central engine. This component could correspond to a molecular torus (of 40-50 pc size). As seen in Fig. 4a, low level CO emission has been tentatively detected inside the ring, bridging the ’apparent’ gap between the N spiral arm (running North from West) and the central source. The bridge is better identified in the p–v plot of Fig. 4b. The molecular gas mass of this emission bridge is more accurately estimated using the natural weighted map: the gas mass amounts to 107M⊙ (Schinnerer et al. 2005). This could be the northern molecular counterpart of the filamentary spiral structure identified in the J–H HST map (Fig. 4a).
The kinematics of molecular gas in the nuclear spiral arms reveal streaming motions (Schinnerer et al. 2005) also identified in the previous lower resolution CO and HCN maps of NGC 6951 (Kohno et al. koh99 (1999)). Inside the ring (50 pcr350 pc), however, gas kinematics are compatible with regular rotation (Fig. 4b). Of particular note, this is in clear contrast to the case of NGC 4579. The kinematics of the G–component, although compatible with circular motions, cannot be studied in detail due to insufficient spatial resolution.
While most of the 3108M⊙ molecular gas disk is feeding a starburst episode in the nuclear spiral arms at r350 pc, a small amount of molecular gas (a few 106M⊙) has been detected on the central engine. This central component reveals a prior accretion episode down to scales of r50 pc. It is unclear whether molecular gas detected in the bridge component is falling into the nucleus or migrating outward: the gas flow is fully compatible with regular circular motions from r=50 pc to r=350 pc.
4 Gravitational torques and AGN fueling
To explore more precisely the efficiency of feeding, we have estimated the gravitational torques exerted by the stellar potentials (derived from the NIR images) on their molecular circumnuclear disks (as given by the NUGA CO maps). After estimating the role of stellar gravitational torques, we will investigate whether other mechanisms are required to explain the low level of nuclear activity in these galaxies.
We first explain the general methodology employed and the basic assumptions in Sect. 4.1. The different steps are described in detail in Sect. 4.1.1 and Sect. 4.1.2. We discuss in Sect. 4.2 the results obtained from the application of this procedure to the four NUGA targets examined in this work.
4.1 General methodology
Gravitational forces are computed at each location in the plane of the galaxy, using near-infrared images to derive the underlying gravitational potential. We assume that the total mass budget is dominated by the stellar contribution and thus neglect the effect of gas self-gravity. We also assume a constant M/L ratio, and determine its best value by fitting the rotation curve constrained by the CO observations. From the 2D force field (,) we derive the torques per unit mass at each location (=). This torque field, by definition, is independent of the present gas distribution in the plane. The crucial step consists of using the torque field to derive the angular momentum variations and the associated flow time-scales. As explained below, the link is made through the observed distribution of the gas.
With this aim, we assume that the measured gas column density () derived from a CO intensity map at each offset in the galaxy plane is a fair estimate of the probability of finding gas at this location at present. In this statistical approach, we implicitly average over all possible orbits of gaseous particles and take into account the time spent by the gas clouds along the orbit paths. We assume that CO is a good tracer of the total gas column density, since HI mass in the nuclei of galaxies is typically a very small fraction of the total gas mass. The torque field is then weighted by at each location to derive the time derivative of the local angular momentum surface density =.
In order to estimate the gas flows induced by these angular momentum variations we produce azimuthal averages of at each radius. The azimuthal average at each radius, using as the actual weighting function, represents the global variation of the specific gas angular momentum occurring at this radius (). Finally, the time-scales for gas inflow/outflow can be derived by estimating the average fraction of angular momentum transferred in one rotation.
The validity of our estimate of the efficiency of stellar gravity torques to drive angular momentum transfer in the gas is based on the following simple hypothesis: we assume that the gas response to the stellar potential is roughly stationary with respect to the potential reference frame during a few rotation periods. We would like to stress that even in the particular case of nuclear bars, which might decouple from the outer stellar bars under certain circumstances, our assumption is still valid. When there are several stellar pattern speeds at different radii in a galaxy disk, numerical simulations show that the gas response tends to be coupled with the stellar potential pattern (Friedli & Benz fri95 (1995); García-Burillo et al. gb98 (1998); Bournaud & Combes bou02 (2002), 2005 in prep.). The gas response adjusts its pattern speed to that of the dominant stellar pattern at a given radius.
A different case is represented by non-axisymmetric perturbations which can be driven by gas self-gravity and that are partly independent of or possibly decoupled from the stellar perturbations of the disk. Nuclear galaxy disks with a high gas surface density and a mostly axisymmetric stellar potential can be prone to develop this kind of gas self-gravitating perturbation. In this limiting case (not contemplated here), and although our calculation is still formally correct, the inclusion of gas self-gravity is required to derive the correct torque budget. In particular, if the gas disk decouples from the stellar pattern, the azimuthally averaged gravity torques exerted by the stellar pattern on the gas will very likely be close to zero. The main source for the torques if any should come from the gas instability itself.
Note also that any radial variation of the CO-to-H2 conversion factor (XCO) is not expected to affect the estimated time-scales as these are independent of the global normalization factor as a function of radius. If XCO varies as a function of azimuth at a fixed radius, there could be a potential bias. However, observational evidence indicates that the dominant variation of XCO in the central regions of galaxies is radial (Solomon & Barrett sol91 (1991); Regan et al. reg01 (2001)).
In the approach followed to derive the gravitational potential we have assumed that the bulge is as flattened as the disk, and thus no attempt has been made to separate the bulge from the pure disk contribution. The implicit assumption of a highly flattened bulge is probably not wrong for some barred galaxies but for others it will overestimate the radial forces by at most a factor of 2 (e.g., Buta & Block but01 (2001)). On the other hand, the effect of bulge stretching due to deprojection can enhance the strength of bars, especially if they are aligned with the minor axis and the inclination angles are large. As this is not the case for the galaxies analyzed here, we instead expect that the value derived for the gravity torques will be typically underestimated in our case by a factor 1.5-2 although they will still have the same sign.
4.1.1 Evaluation of stellar potentials
The first step is to derive the stellar potential in the nuclear disks of these galaxies, using the high-resolution NIR images described in Sect. 2.2. Our working hypothesis is that NIR images are less affected than optical ones by dust extinction or by stellar population biases (Quillen et al. quillen (1994)). The images are first deprojected according to the angles and given in Table 1. The images are then completed in the vertical dimension by assuming an isothermal plane model with a constant scale height, equal to 1/12th of the radial scale-length of the image. The potential is then derived by a Fourier transform method. We also assumed a constant mass-to-light (M/L) ratio, obtained by fitting the observed CO rotation curve––for each galaxy. The potential–– is then decomposed in the different m-modes:
| (1) |
where and represent the amplitude and phase of the m-mode, respectively.
Following Combes and Sanders (com81 (1981)), we define the strength of the -Fourier component, as
| (2) |
The corresponding strength of the total non-axisymmetric perturbation is defined by:
| (3) |
where represents the maximum amplitude of the tangential force over all and is the mean axisymmetric radial force.
4.1.2 Efficiency of gravitational torques
After having calculated the forces per unit mass ( and ) from the derivatives of at each pixel, the torques per unit mass––can be computed by:
| (4) |
The sense of the circulation of the gas in the galaxy plane determines the sign of : positive (negative) if the torque accelerates (decelerates) the gas at . We have next obtained the gravitational torque maps weighted by the gas column densities derived from the CO 1–0 and 2–1 lines, , i.e., we derive . These represent the effective variations of angular momentum density in the galaxy plane. We show in Fig. 9a to 12a the normalized version of these maps, i.e., divided by [ N(x,y) t(x,y)]max for the 2–1 line (except for NGC 4321, where we used the 1–0 line). To estimate the radial gas flow induced by the torques, we have first computed the torque per unit mass averaged over the azimuth, using as the actual weighting function,i.e.:
| (5) |
Results obtained for t(R) based on the CO(1–0) and CO(2–1) maps were seen to be virtually identical within the errors. Fig. 9b to 12b show the results derived from the 1–0 line maps. By definition, represents the time derivative of the specific angular momentum––of the gas averaged azimuthally, i.e., =. To derive azimuthal averages, we assume a radial binning () which corresponds to the original resolution of the NIR images. Similarly to the torque maps, the sign of , either + or –, defines whether the gas may gain or lose angular momentum, respectively. More precisely, we evaluate the AGN feeding efficiency by deriving the average fraction of the gas specific angular momentum transferred in one rotation (Trot) by the stellar potential, as a function of radius, i.e., by the non-dimensional function defined as:
| (6) |
where is assumed to be well represented by its axisymmetric average, i.e.,. The absolute value of determines how long will it take for the stellar potential to transfer the equivalent of the total gas angular momentum. Assuming that the gas response to the stellar potential is stationary with respect to the potential reference frame during a few rotation periods, a small value of implies that the stellar potential is inefficient at present. The and curves derived from the 1–0 maps of the analyzed galaxies are displayed in Figs. 9b to 12b.
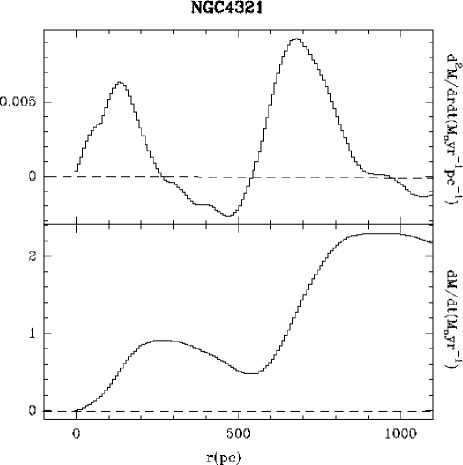
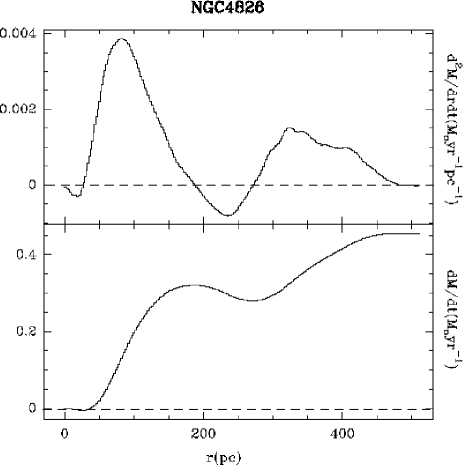
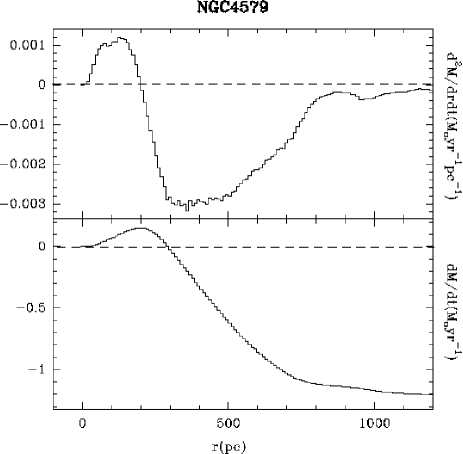
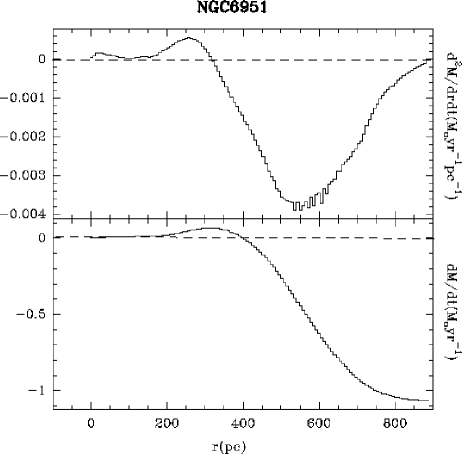
To calculate how much gas mass is involved in the transfer driven by the stellar potential we have estimated the radial trend for the mass inflow (- sign)/outflow(+ sign) rate of gas per unit length as a function of radius (in units of M⊙ yr-1pc-1 in Figs. 13a to 16a) as follows:
| (7) |
where is the radial profile of N(x,y) averaged over the azimuth for a radial binning .
The inflow/outflow rates integrated out to a certain radius R can be derived as:
| (8) |
4.2 Tracking down gravitational torques in NUGA targets
4.2.1 NGC 4321
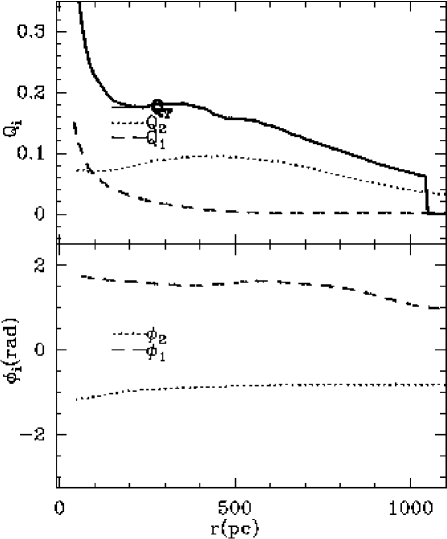
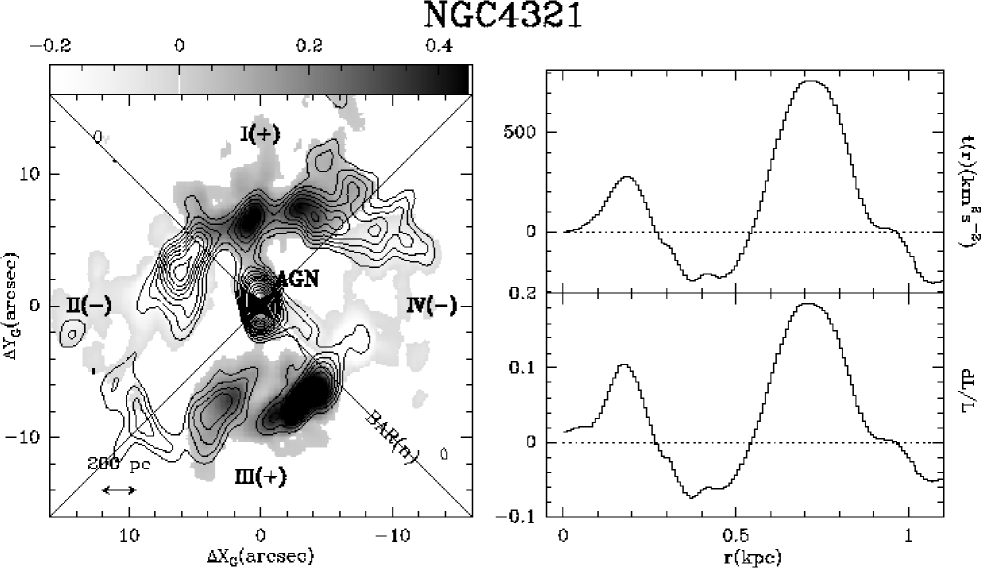
Fig. 5a shows the K-band image of the nucleus of NGC 4321, obtained by Knapen et al. (kna95 (1995)), deprojected onto the galaxy plane (XG/YG coordinates). The NIR image shows a nuclear bar (denoted as BAR(n) in Fig. 5a) which is roughly parallel to the large-scale 8 kpc stellar bar (oriented along PA=112∘ in sky coordinates). The nuclear bar strength is the main contributor to QT, which is typically 0.18 for r500 pc (Fig. 5b).
Fig. 9a, shows that the derived torques change sign following a characteristic 2D butterfly pattern. Quadrants I-to-IV will define hereafter the regions where the signs of the torques driven by the dominant perturbation of the stellar potential are expected to be constant (Figs.9-12a). Assuming that the gas circulation is counterclockwise, Fig. 9a shows that the bulk of the CO emission along the spiral arms lies at the trailing edges of the nuclear bar where torques are positive (quadrants I(+) and III(+)). While there is significant CO emission arising from the leading quadrants of the bar (quadrants II(-) and IV(-)) both on intermediate scales (r=250-550 pc) and in the outer disk r900 pc, negative torques there are weaker than positive torques measured over the trailing quadrants (see Fig. 9b). Most remarkably, closer to the AGN (r200 pc), the sign of the average torques is also positive. Although the central CO source is marginally resolved in the CO map of García-Burillo et al. (gb98 (1998)), and, therefore, higher resolution observations are required to settle the question, positive torques seem to dominate over negative ones at r200 pc.
In terms of mass inflow rates, the overall feeding budget in NGC 4321 is clearly positive at all radii as shown in Fig. 13. This would imply that the radial gas flow goes outward unless other mechanisms more efficiently transfer the gas angular momentum outwards. At r100 pc, dM/dt+0.4M☉ yr-1 and the radial rate is still positive at r500 pc, where dM/dt+0.4M☉ yr-1. Similarly to the case of the other transition object, NGC 4826 (see Sect. 4.2.2), AGN feeding driven by stellar torques is quenched at present in NGC 4321. Although the gas concentration is large close to the AGN, the present gas configuration favors feeding only on intermediate scales (r=250-550 pc). This result is compatible with the CO-based diagnostic of the gas kinematics discussed in Sect.3.1.
4.2.2 NGC 4826
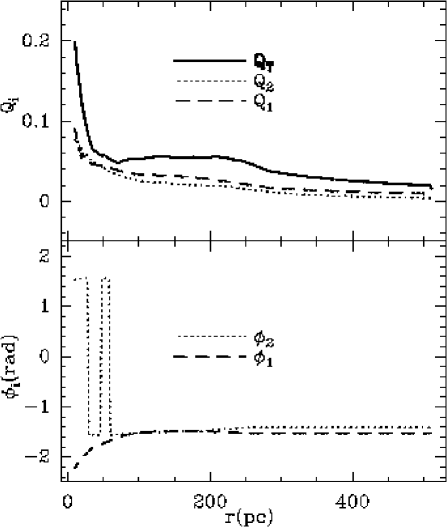
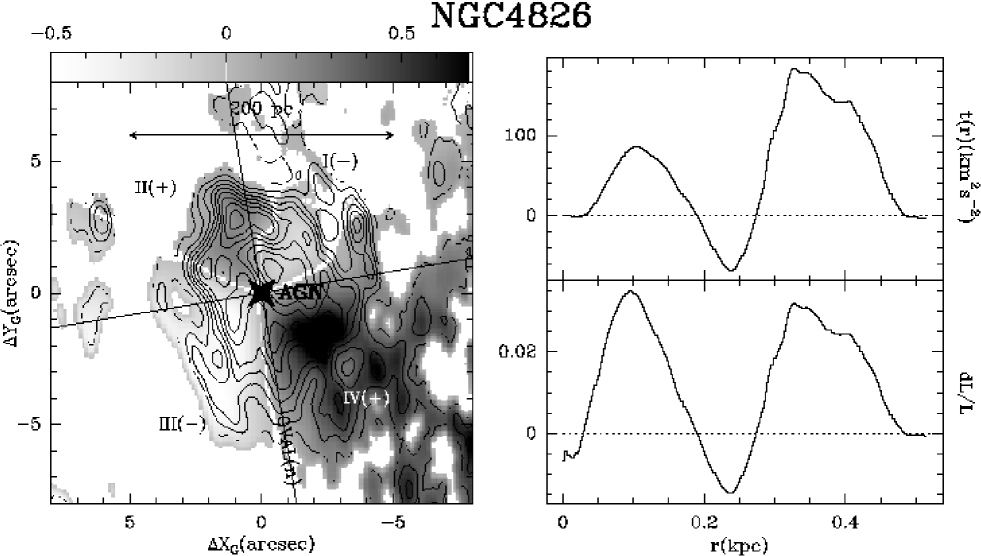
Fig. 6a shows a zoom into the central 200 pc region of the deprojected H-band HST image of NGC 4826. We plot in Fig. 6b Qi( =), (=) and QT inside the full field-of-view of the image (r=530 pc). As shown in Fig. 6b, the deviations from axisymmetry of the stellar potential are exceedingly small at all radii (Q0.02–0.05) except for r75 pc where a weak oval perturbation is detected. The latter is denoted as OVAL(n) in Fig. 6a. This oval seems slightly off-center with respect to the AGN; this would account for the contribution from a stellar mode to QT, identified in Fig. 6b.
As already suggested by the first calculations of paper I, we find that the weak stellar perturbations present in the inner 500 pc of NGC 4826 are inefficient at feeding the AGN at present. Fig. 10a shows how the derived torques change sign in the central 200 pc of the disk. The distribution of torques, defined by quadrants I-to-IV in Fig. 10a, shows the expected behavior if torques are mostly due to the oval distortion of NGC 4826. Moreover, stellar torques are weak and mostly positive inside r150 pc (Fig. 10b). Very close to the AGN (r20 pc), the sign of average torques might become marginally negative, but as we lack spatial resolution on these scales, the torque estimate becomes uncertain.
Alternatively, the lopsided gas disk may be unrelated to the stellar oval. Instead, gas self-gravity could be driving the gas response in the nucleus NGC 4826 (see discussion in paper I). In this case the gas disk may be decoupled from the stellar pattern, and therefore the latter would be viewed as a mostly axisymmetric component from the system of reference of the gas, i.e., providing zero torque on the gas disk. The main source for the torques should come from the gas instability itself. In NGC 4826 instabilities do not seem to favour gas inflow, however (paper I). In either case, this is compatible with the scenario depicted in Sect. 3.2, in which there is currently no evidence of fueling of the AGN.
In spite of the large molecular gas concentration close to the AGN (r150 pc), the overall feeding budget in NGC 4826, quantified by the mass inflow rates shown in Fig. 14, is clearly positive inside the full field-of-view of the NIR image. This implies that the predicted radial mass flow should be dominated by outflow rather than inflow motions. At r100 pc, dM/dt+0.2M☉ yr-1 and the inflow rate is still positive at r500 pc, where dM/dt+0.45M☉ yr-1.
4.2.3 NGC 4579
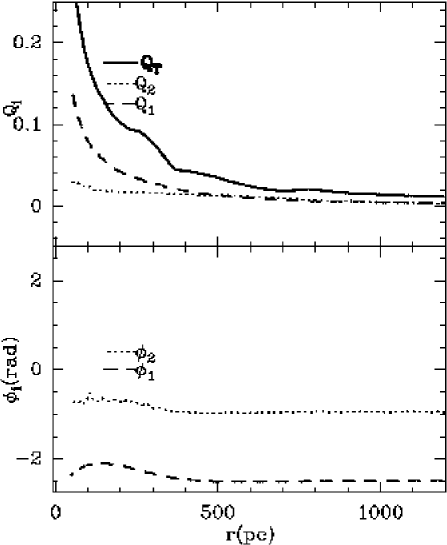
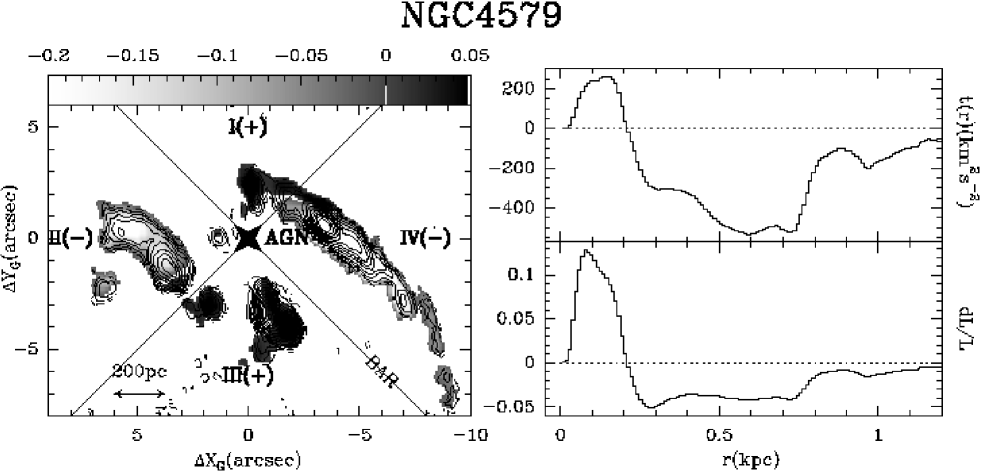
Fig. 7a shows the central r1 kpc region of the I-band HST image of NGC 4579 deprojected onto the plane of the galaxy. The dominant stellar perturbation in the HST image of the disk is the large-scale 9 kpc bar of NGC 4579, denoted BAR and oriented as shown in Fig. 7a. As illustrated by Fig. 7b, the potential strength of the bar is dominated by an mode for r250 pc where Q0.10.
Fig. 11a shows the 2D pattern of gravitational torques for r1 kpc. Stellar torques change sign as expected if the orientation of quadrants I-to-IV can be attributed to the large-scale stellar bar of NGC 4579. Assuming that the sense of gas circulation is clockwise in the galactic plane, Fig. 11a shows that the bulk of the CO emission along the spiral arms lies where torques are strong and negative. Fig 11b shows that the azimuthally averaged torques are strong and negative from the edge of the image at r=1200 pc (and most probably from larger radii) down to r=200 pc.
Closer to the AGN (r200 pc), the bulk of the CO emission is concentrated North of the nucleus in the trailing quadrant I(+), where stellar torques are positive. The CO complex closest to the AGN is in the leading quadrant II(-), East of the nucleus at r150 pc, where torques are negative. However, Fig. 11b shows that the azimuthally averaged torques are positive for r200 pc. As discussed in Sect. 3.3, the interpretation of the complex kinematics observed for molecular gas in this region is not straightforward but does not favor a direct feeding of the AGN. One of the possible scenarios explored by García-Burillo et al. 2005 (in prep.) invokes that gas is being entrained by expanding motions at r200 pc. Note that in this case we do not expect the gas pattern to be stationary with respect to the stellar pattern and therefore, the torque calculation developed above may not be relevant on scales r200 pc. Nonetheless this would not change the picture where the central engine of NGC 4579 is not being fueled at present.
In summary, the overall mass inflow budget is clearly negative down to r200 pc due to the action of the large-scale bar of NGC 4579 (Fig. 15). The radial flow expected for the gas is clearly inward down to r200 pc. At r500 pc, dM/dt–0.6M☉ yr-1. Inside r200 pc stellar torques do not currently help feeding.
4.2.4 NGC 6951
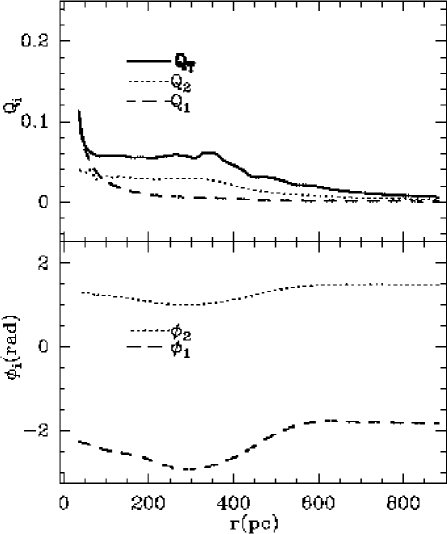
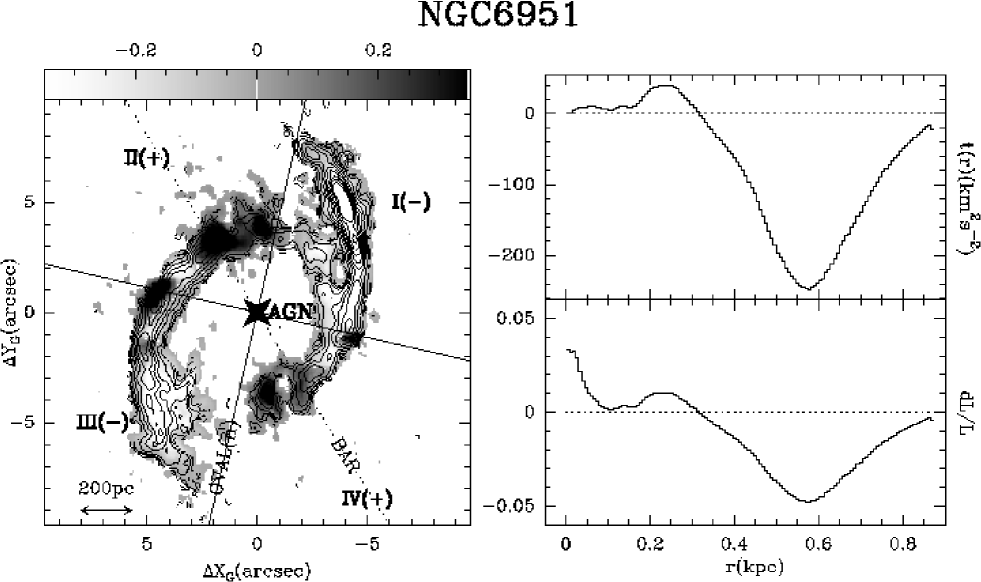
Fig. 8a shows the deprojected J-band HST image of the nuclear region (r900 pc) of NGC 6951. The HST image allows the identification of the central 1.8 kpc of the large-scale bar of NGC 6951 (denoted as BAR in Fig. 8a). The bar clearly extends beyond the image field-of-view (r=900 pc). Moreover we report on the detection of a small oval distortion most prominent inside r=400 pc (denoted as OVAL(n) in Fig. 8a). The mode of the oval perturbation dominates the strength of the potential at r400 pc. While it is true that we likely underestimate the contribution of the large-scale bar to the strength of the mode at r400 pc due to the restricted field-of-view of the HST image, we do not expect this contribution to be significant on these scales, considering the low Q2 values typically shown by large-scale bars at radii of a few 100 pc. The measured strength of the oval is moderate–to–low: Q0.06, i.e., quite comparable to the strength of the oval potential detected in the nucleus of NGC 4826. We note that the strength of the large-scale bar is likely much higher than that of the oval but it is relevant only for the gas which lies beyond the r900 pc circumnuclear CO disk.
The NGC 6951 torque map shown in Fig. 12a suggests indeed that it is the nuclear oval which shapes the NGC 6951 torques map. The orientation of quadrants I-to-IV associated with the nuclear oval fits the pattern of the torques much better than that associated to the bar. As the sense of gas circulation is clockwise in NGC 6951, Fig. 12a shows that CO emission over the spiral arms in quadrants I(-) and III(-) lies at the leading edges of the nuclear oval where torques are negative down to the inner radius of the pseudo-ring, at r300 pc. While the torques due to the large-scale bar on the inner CO ring are weak at present, torques are expected to be strong and negative at the leading edges of the bar. The offset dust lanes detected in the optical images of NGC 6951 (e.g., Pérez et al. per00 (2000)) indicate that gas inflow is at work along the bar on large scales. The combination of the bar and the nuclear oval has created a pattern of torques which are negative down to r300 pc. The bulk of the molecular gas in the central 5 kpc of NGC 6951 has already fallen from the x1 orbits down to the x2 orbits of the bar where it feeds a nuclear starburst in the ring. In the vicinity of the AGN, however, the average stellar torques become marginally positive and AGN feeding is not favored by the present configuration of the stellar potential.
Fig. 16 shows the overall mass inflow budget for NGC 6951. The radial flow expected for the gas is clearly inward down to r300 pc. At r500 pc, dM/dt–0.25M☉ yr-1. Inside r300 pc, however, stellar torques do not favour AGN feeding at present in this Seyfert.
5 Discussion and conclusions
The first results obtained from the analysis of stellar torques in the circumnuclear disks of a subset of NUGA targets reveal complex trends in the details of the feeding history along the Transition/LINER/Seyfert sequence. The overall picture emerging in the two Seyferts/LINERs (i.e., NGC 6951 and NGC 4579) suggests that AGN feeding may proceed in two steps. In a first step, gravity torques do help, by getting rid of gas angular momentum, driving the gas inwards and feeding a nuclear starburst on scales of a few 100 pc. On smaller scales, however, stellar torques play no role in AGN fueling in the current epoch: torques on the gas are not negative all the way to the center, but on the contrary they become positive and quench the feeding. This may explain why molecular gas seems to ’avoid’ the inner 200-300 pc of NGC 6951 and NGC 4579 where we measured Ma few105–106M☉ (see also the properties of NGC 7217 as discussed by Combes et al. com04 (2004)). Observational evidence indicates that in NGC 4579 molecular gas on these scales is presently flowing outward. In a second step, a mechanism complementary to gravity torques may be required to drive gas inflow on smaller scales.
Most notably, a much larger molecular gas concentration has been driven inwards in the transition objects analyzed in this paper: 3107–108M☉ inside r=150 pc. However, we have found that stellar torques are also unable to drain angular momentum from the massive circumnuclear gas disks of NGC 4321 and NGC 4826. The underlying mechanism responsible for halting gas inflow inside r=150 pc seems to be different in these two transition objects. On similar spatial scales, the stellar torques created by the nuclear bar of NGC 4321 are much stronger than those created by the weak oval perturbation of NGC 4826. Furthermore, the perturbation identified in the gas disk of NGC 4826, which is probably unrelated to the oval perturbation, could be the main donor of angular momentum to the gas at these radii (paper I).
Our quest for a mechanism of AGN feeding based only on stellar torques has led to a paradoxical result for the four cases studied here: inflow is actually thwarted close to the AGNs (r100-200 pc). One possible explanation is that the responsible agent in the stellar potential could be transient, or as short lived as an individual AGN episode (hence: 107-8 years). The feeding phase from 100 pc to 1 pc could be so short that the smoking gun evidence in the potential is likely to be missed. Alternatively, this temporary inability of gravitational torques could be overcome by other mechanisms that, over time, become competitive with non-axisymmetric perturbations. Among the different mechanisms usually cited in the literature, dynamical friction and viscous torques have been invoked to help AGN feeding on 100 pc scales. Gravitational torques can become positive close to the central engine as illustrated above, in contrast with viscous torques or dynamical friction that always favour gas inflow. This implies that stellar torques could regulate the gas flows in galactic nuclei in combination with other mechanisms that secularly drain the gas angular momentum.
We discuss below the efficiency of dynamical friction and viscosity versus gravity torques for driving AGN feeding in the four galaxies analyzed in this paper. This efficiency can be quantitatively estimated by comparing the typical time-scales of these processes with those of the gravitational torques derived above for each galaxy.
5.1 Assisting gravity torques
5.1.1 Dynamical friction
Dynamical friction of giant molecular clouds (GMCs) in the stellar bulge of a galaxy is often invoked as a possible mechanism of fueling AGN. According to the well-known Chandrasekhar (1943) formula, the time-scale of dynamical friction for a GMC of mass MGMC at a radius where rotational velocity is would be T108 yr (r/100 pc)(106 M⊙/MGMC)(/200kms-1). We have derived the decay time-scale (Tdf) of a typical GMC (M106M⊙) in the nuclear disks of the 4 galaxies discussed above. We derive Tdf at the radii where we have identified a barrier of positive gravity torques and get from the CO observations. The values of Tdf are typically 30, except in NGC 4826 where we obtain formally T5 (see Table 2). The comparison between Tdf and the corresponding time-scales for gravity torques Tgrav (defined as T from Eq. [6]) implies that friction is a relatively slow process compared to gravity torques, except in NGC 4826 and NGC 6951.
Despite these results, we suspect that the values estimated for Tdf are a strict lower limit and so severely overestimate the efficiency of dynamical friction in all cases. The reason for this assessment is that Chandrasekhar’s formula implicitly assumes that a GMC is a bound rigid body, with a highly concentrated mass. This approximation underestimates the real value of Tdf. Molecular clouds are indeed a loose ensemble of clumps of different sizes, resembling fractals. The typical masses of the densest fragments can be as low as 10-3 M⊙ (e.g., Pfenniger & Combes pfe94 (1994)). Therefore the scattering efficiency of a realistic GMC unit of 10–30 pc size including a complex mass spectrum of clumps inside is much less than estimated above: the Coulomb parameter of a GMC in Chandrasekhar’s formula should tend to vanish. We therefore conclude that dynamical friction is likely to be quite a slow process, which to first approximation can be neglected relative to gravity torques.
| Galaxy | Tgrav | Tdf | Tvisc |
|---|---|---|---|
| (Trot) | (Trot) | (Trot) | |
| NGC 4321(r=200 pc) | 8 | 30 | 20 |
| NGC 4826(r=50 pc) | 70 | 5 | 5 |
| NGC 4579(r=200 pc) | 8 | 30 | 22 |
| NGC 6951(r=200 pc) | 50–100 | 30 | 20 |
5.1.2 Viscosity
Viscous torques are generally weak, and their associated time-scales (Tvis) are quite long at large radii. The reason behind this is that Tvis grows as the square of the radius according to the classical diffusion equation of Pringle (pri81 (1981)) which gives the time evolution of an axisymmetric disk distribution, (,), under the action of viscous transport:
| (9) |
In this formula, the kinematic viscosity, , is usually described as , where is the characteristic mean-free path for viscous transport and is the gas velocity dispersion. Eq. [9] allows to derive by simple dimensional analysis the typical radial dependence of the time-scale for viscous transport in an axisymmetric disk, if we assume that the disk rotation curve can be described by a power law (i.e., V):
| (10) |
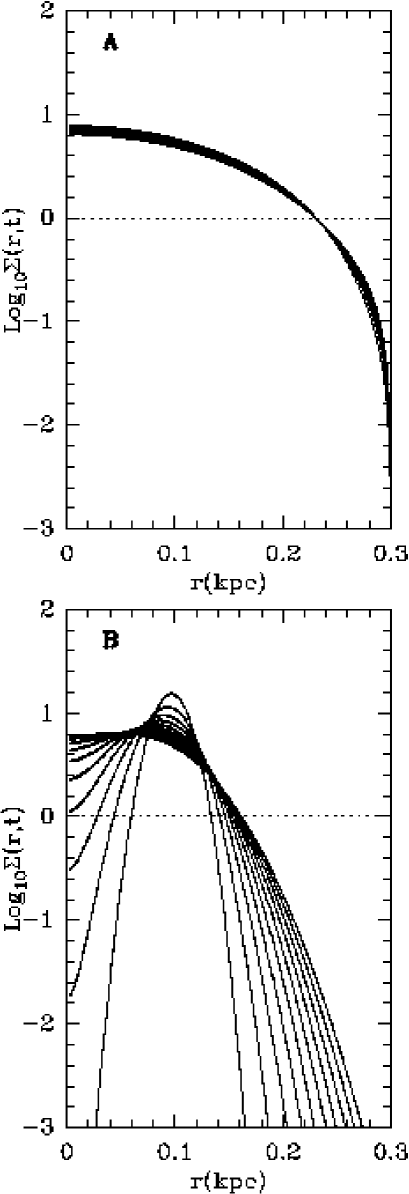
However, as illustrated below, the exact value of strongly depends on the assumed initial density distribution law for the disk. Fig. 17a shows the time evolution of a smooth disk distribution under the action of viscous torques. In this calculation we have taken =100 pc km s-1, assuming =10 pc and =10 km s-1. After 200 Myr the radial gas flows are very small. However, the efficiency of viscous transport can be enhanced if the initial distribution of the disk is characterized by strong density gradients. This is the case of nuclear contrasted rings, especially when these are located in the inner regions of galaxies (r100–500 pc) as frequently is the case for early-type barred spirals. Moreover, and contrary to the conventional wisdom (based on low resolution observations) that most galaxy rotation curves are close to rigid body for r500 pc, can show a strong variation with radius in the inner regime. Therefore galactic shear can still be very high on these scales; this also favours viscous transport.
Fig. 17b illustrates the time evolution of a nuclear ring of r100 pc under the action of viscous torques in a galaxy disk. The radial gas flows are remarkably faster than in the previous case: in typically 5107 yr, the ring starts to dissolve and a significant amount of gas can reach the center of the galaxy. We compare in Table 2 the characteristic time-scales of viscous torques and gravity torques in the 4 galaxies analyzed in this paper. Power-law rotation curves have been fit within the relevant radial ranges adapted to each galaxy, assuming in all cases =100 pc km s-1, i.e., a viscosity prescription similar to the the axisymmetric smooth disk solution. Viscosity seems a viable mechanism to drive significant gas inflow in NGC 4826 at r=50-100 pc, while it is probably inefficient against the stronger gravity torques in NGC 4579 and NGC 4321 for r200 pc. Moreover, gas lying inside the nuclear ring of NGC 6951 could be falling to the AGN favoured by viscous torques at r200 pc. Note that these results are unchanged if we allow gravity torques to be a factor of 1.5–2 stronger, as argued in Sect. 4.1.
We can conclude that, in spite of all the uncertainties in the derivation of time-scales, viscous torques are the most viable mechanism to generate gas inflow on scales 100-200 pc if they act on a contrasted nuclear ring distribution, and do not have to fight against very strong positive torques from gravity.
5.2 A scenario for self-regulated activity in LLAGNs
In this work we have shown that gravity torques exerted by the stellar potential on the gas disks of four LLAGNs, purposely chosen to represent the whole range of activity classes in the NUGA sample, fail to account for the feeding of the AGN at present. We conclude that gravity torques need to be assisted in due time to drive the gas to the center. Based on these results, we develop in this section a simplified general scenario in which the onset of nuclear activity can be understood as a recurrent phase during the typical lifetime of any galaxy. In this scenario the recurrence of activity in galaxies is indirectly related to that of the bar instabilities although, as argued below, the active phases are not necessarily coincident with the maximum strength of a single bar episode. While bars can build up gas reservoirs towards the central regions of galaxies in the shape of nuclear rings in early type objects, the dynamical feed-back associated with these gas flows can destroy or considerably weaken the bars (Norman et al. nor96 (1996); Bournaud & Combes bou02 (2002)). When this happens, gravity torques are negligible and can make way for other competing mechanisms of gas transport, such as viscous torques, in an almost axisymmetric system.
The first step in this evolutionary scenario could begin with an axisymmetric disk of gas. Shortly after the galaxy disk would be prone to a bar instability. If the galaxy is early-type, i.e., with a sufficient bulge or central mass concentration, then the bar pattern is likely to have one or even two Inner Lindblad Resonances (ILRs). A nuclear ring would form either close to the single ILR or between the two ILRs. At this stage, the gas would be driven inwards from corotation to the ILR, and would accumulate in the ring where a burst of star formation can occur. However positive gravity torques would prevent the gas from flowing further in: under the bar forcing, gas inside the ring could be evacuated outwards (Combes com88 (1988)). The bar thus would restrict the amount of fuel available for AGN feeding to that lying very close to the center where it is under the dominant gravitational influence of the black hole. As the potential would be mostly axisymmetric in the central 10 pc, gas could remain there feeding the central engine.
The infall of gas driven by a bar is self-destructive, however: it progressively weakens and destroys the bar, so that the potential returns to axisymmetry (Norman et al. nor96 (1996); Bournaud & Combes bou02 (2002)). At this stage gas piled up in the nuclear ring could dissolve to form a smoother disk through viscosity which may have become competitive against gravity torques. The infall of gas produced by viscous torques could replenish the exhausted fuel near the central engine triggering a new phase of nuclear activity.
In this scenario, the feeding of active nuclei in early-type spirals is contemplated as a two step process: first gravity torques bring the gas of the large-scale disk to the nuclear ring, and when the dynamical feedback has destroyed the bar, the viscous torques could smooth out the ring, and bring gas into the central 10 pc, where it is under the influence of the Keplerian potential of the black hole. The disk becomes axisymmetric and the cycle can be restarted at its first step. In particular, the disk will be prone to a new bar instability if gas is accreted from the outer parts of the disk. These multiple bar phases must occur in gas-rich spiral galaxies, in order to account for the observed frequency of bars (Block et al. blo02 (2002); Bournaud & Combes bou02 (2002, 2004)).
We relate the recurrence of episodes of bar formation and destruction with the fueling of active nuclei in galaxies. The self-regulated competition between gravity torques and viscosity in galaxy nuclei may lead typically to several episodes of activity (each lasting for 108 yr) during a single cycle of bar formation/destruction (lasting for 109 yr). These activity episodes are not expected to be strongly correlated with the phases of maximum strength for the bar, but they may appear at different evolutionary stages of the bar potential, depending on the balance between gravity torques and viscosity. The observed prevalence of outer rings in Seyferts, interpreted as a sign of bar dissolution, would support this scheme (Hunt and Malkan hun99 (1999)). Furthermore, the ample variety of morphologies revealed by the CO maps of the circumnuclear disks of NUGA targets corroborates that there is no universal pattern associated with LLAGNs (García-Burillo et al. gb04 (2004)). Activity can also be found in a galaxy during its axisymmetric phase (e.g., see the case of the NUGA galaxy NGC 5953, discussed by Combes et al. 2005, in prep).
The gas directly responsible for the Seyfert activity in galaxies like NGC 4579 or NGC 6951 must have been brought to the center during the previous axisymmetric phase, while the bar at present is emptying the region inside the nuclear ring, thus regulating the amount of gas available for the active nucleus. In the case of NGC 4579, gravity torques clearly overcome viscosity, while in NGC 6951 the balance between both mechanisms might be reached soon. In the case of NGC 4826, the nucleus has a very low level activity in spite of the presence of a large amount of gas in the vicinity, since the potential is almost axisymmetric, and the nuclear ring could be undergoing dissolution by viscosity. The active phase would develop during the next phase, while the disk would soon become bar unstable again. However, the role of the gas perturbations identified in the disk of NGC 4826 might be to slow down the dissolution of the ring, as kinematics still suggest outward motions close to the AGN. The case of NGC 4321 is still early in the time evolution, as the bar is only now entering the destruction phase, through the formation of a nuclear bar inside the resonant ring. This nuclear bar efficiently prevents nuclear feeding through gravity torques.
The observed fraction of LLAGNs in the Local Universe (44, including LINERs; Ho et al. ho97 (1997)) could impose tight constraints on the expected number of activity episodes per bar formation/destruction cycle in this scenario. Based on these statistics, a rough estimate would raise this number to 4. However this estimate can only be taken as mostly speculative for the time being. The principal source of uncertainty, which prevents us from making a more quantitative prediction, resides in the fact that there is no consensus on what is the typical duration of a nominal AGN duty-cycle. The different values of AGN duty-cycles discussed in the literature range from 107 to 108 yr (Ho et al. ho03 (2003); Martini mar04 (2004); Wada wad04 (2004); Merloni mer04 (2004)). Moreover, the required number of individual episodes could be lowered to a few if we exclude starburst dominated LINERs from the LLAGN population or even more if we restrict the activity classification to Seyferts, the most active members in the family.
In barred galaxies with comparatively less prominent bulges, i.e., characterized by the absence of an ILR barrier, viscosity may not be needed to take over gravity torques close to the AGN. The gas flow should not be stalled at a radius of a few 100 pc forming a nuclear ring in this case. There are a few examples in the NUGA survey of strongly barred galaxies showing a strong nuclear concentration of gas instead of a ring. This class of ILR-free bars could be more common in the early Universe during the formation of disks and the growth of supermassive black holes (Sellwood & Shen sel04 (2004)).
Furthermore, other mechanisms different from axisymmetric viscous flow could be efficient at overcoming the ILR barrier imposed by most stellar bars in the Local Universe. As mentioned above, the ultimate agent for the feeding could still reside in the stellar potential but would be transient and their detection might be elusive. In addition, the role of nuclear and gaseous spirals in AGN feeding is still not completely elucidated. Most interestingly, a few examples of these gas instabilities are found in the available CO maps of AGNs, including some of the galaxies of the NUGA sample (García-Burillo et al. gb04 (2004)).
Finally, the role of gas self-gravity to drive gas inflow may not be negligible in those cases where the distribution of gas is a significant source of non-axisymmetry for the total gravitational potential, especially if the stellar potential itself appears as featureless or mostly axisymmetric. We can estimate the influence of gas self-gravity by calculating the typical gas mass fractions as a function of radius in the case of the galaxies studied in this paper. In NGC 6951 and NGC 4579, the gas mass fractions are very low throughout the disk from r100 pc (1) up to r1000 pc (3). Therefore we do not expect gas instabilities to have a significant influence in the total gravitational potential in these two galaxies. In contrast, gas mass fractions are comparatively larger at the same radii in NGC 4826 and NGC 4321: 10-15 at r100 pc in both galaxies. This gas mass fraction is still high at r1000 pc (10) in NGC 4321, while it decreases down to 5 in NGC 4826 at that distance. This evidence points to a larger influence of gas self-gravity in NGC 4826 (as discussed in paper I) and NGC 4321 (as discussed by Wada et al. wad98 (1998)).
These results highlight the need for a significant increase in the number objects for which high-resolution CO maps are available together with careful case-by-case studies in the quest for evidence of AGN feeding. The scenario proposed in this work, as well as any alternative model accounting for nuclear activity in galaxies, remains to be tested using a larger sample of LLAGNs.
Acknowledgements.
We thank the anonymous referee whose comments helped to improve this paper. We would like to thank Andrew J. Baker for his careful reading of the paper and related discussions. We acknowledge the IRAM staff from the Plateau de Bure and from Grenoble for carrying out the observations and help provided during the data reduction. This paper has been partially funded by the Spanish MCyT under projects DGES/AYA2000-927, DGES/AYA2003-7584, ESP2001-4519-PE and ESP2002-01693, and European FEDER funds.References
- (1) Block, D. L., Bournaud, F., Combes, F. et al. 2002, A&A, 394, L35
- (2) Böker, T., Calzetti, D., Sparks, W., et al. 1999, ApJS, 124, 95
- (3) Bournaud, F., & Combes, F. 2002, A&A, 392, 83
- (4) Bournaud, F., & Combes, F. 2004, in Semaine de l’Astrophysique Francaise, SF2A-2004, ed. by F. Combes, D. Barret, T. Contini, F. Meynadier & L. Pagani. EdP-Sciences, Conference Series, in press
- (5) Buta, R., & Block, D. L. 2001, ApJ, 550, 243
- (6) Chandrasekhar, S. 1943, ApJ, 97, 255
- (7) Combes, F. 1988, in Galactic and Extragalactic Star Formation, ed. by R. E. Pudritz & M. Fiched, NATO Advanced Science Institutes (ASI) Series C, Volume 232, p. 475
- (8) Combes, F. 2001, in World Scientific, Advanced Lectures on the Starburst-AGN Connection, ed. by I. Aretxaga, D. Kunth, & R. Mújica, 223
- (9) Combes, F. 2003, in Active Galactic Nuclei: from Central Engine to Host Galaxy, ed. by S. Collin, F. Combes & I. Shlosman. ASP (Astronomical Society of the Pacific), Conference Series, Vol. 290, p. 411.
- (10) Combes, F., & Sanders, R. H. 1981, A&A, 96, 164
- (11) Combes, F., García-Burillo, S., Boone, F, et al. 2004, A&A, 414, 857
- (12) Contini, M. 2004, MNRAS, 354, 675
- (13) Englmaier, P., & Shlosman, I. 2000, ApJ, 528, 677
- (14) Englmaier, P., & Shlosman, I. 2004, ApJ, 617, L115
- (15) Ferrarese, L., Merritt, D. 2000, ApJ, 539, 9
- (16) Friedli, D., & Martinet, L. 1993, A&A, 277, 27
- (17) Friedli, D., & Benz, W. 1995, A&A, 301, 649
- (18) Friedli, D., Wozniak, H., Rieke, M. et al. 1996, A&AS, 118, 461
- (19) García-Burillo, S., Sempere, M. J., Combes, F. et al. 1998, A&A, 333, 864
- (20) García-Burillo, S., Sempere, M. J., Combes, F. et al. 2000, A&A, 363, 869
- (21) García-Burillo, S., Combes, F., Eckart, A. et al. 2003a, in ASP Conf. Ser., Active Galactic Nuclei: from Central Engine to Host Galaxy, ed. by S. Collin, F. Combes,& I. Shlosman, 423.
- (22) García-Burillo, S., Combes, F., Hunt , L. K., et al. 2003b, A&A, 407, 485 (paper I)
- (23) García-Burillo, S., Combes, F., Schinnerer, E. et al. 2004, in IAU Symp. 222., The Interplay among Blach Holes, Stars and ISM in Galactic Nuclei, ed. by T. Storchi-Bergmann, L. C. Ho ,& H. R. Schmitt, Cambridge University Press, 427.
- (24) Gebhardt, K., Bender, R., Bower, G. et al. 2000, ApJ, 539, 13
- (25) Guilloteau, S., & Lucas, R. 2000, in ASP Conf. Ser.: Imaging at Radio through Submillimeter Wavelengths, ed. by J. G. Mangum & S. J. E. Radford, vol. 299
- (26) Guilloteau, S., Delannoy, J., Downes, D. et al. 1992, A&A, 262, 624
- (27) Helfer, T. T., Thornley, M. D., Regan, M. W. et al. 2003, ApJS, 145, 259
- (28) Ho, L. C., & Ulvestad, J. S. 2001, ApJS, 133, 77
- (29) Ho, L. C., Filippenko, A. V., & Sargent, W. L. W. 1997, ApJS, 112, 315
- (30) Ho, L. C., Filippenko, A. V. & Sargent, W. L. W. 2003, ApJ, 583, 159
- (31) Holtzman, J. A., Burrows, C. J., Casertano, S., et al. 1995, PASP, 107, 1065
- (32) Hunt, L. K., & Malkan, M. A. 1999, ApJ, 516, 660
- (33) Hunt, L. K., & Malkan, M. A. 2004, ApJ, 616, 707
- (34) Jarrett, T. H., Chester, T., Cutri, R. et al. 2003, AJ, 125, 525
- (35) Jogee, S. 2004, in LNP Volume on AGN Physics on All Scales, Chapter 6, in press, astro-ph/0408383.
- (36) Jogee, S., Baker, A. J., Sakamoto, K. et al. 2001, in ASP Conf. Ser.:The Central Kiloparsec of Starbursts and AGN: The La Palma Connection, vol 249, 612
- (37) Junqueira, S., & Combes, F. 1996, A&A, 312, 703
- (38) Knapen, J. H. 2005, A&A, 429, 141
- (39) Knapen, J. H., Beckman, J. E., Shlosman, I. et al. 1995, ApJ, 443, 73
- (40) Knapen, J. H., Shlosman, I., & Peletier, R. F. 2000, ApJ, 529, 93
- (41) Kohno, K., Kawabe, R., & Vila-Vilaró, B. 1999, ApJ, 511, 157
- (42) Kohno, K., Matsushita, S., Vila-Vilaró, B. et al. 2001 in ASP Conf. Ser.:The Central Kiloparsec of Starbursts and AGN: The La Palma Connection, vol 249, 672
- (43) Kormendy, J., & Richstone, D. 1995, ARAA, 33, 581
- (44) Krongold, Y., Dultzin-Hacyan, D. & Marziani, P. 2001, AJ, 121, 702
- (45) Laine, S., Shlosman, I., Knapen, J. H. et al. 2002, ApJ, 567, 97
- (46) Maciejewski, W. 2004a, MNRAS, 354, 883
- (47) Maciejewski, W. 2004b, MNRAS, 354, 892
- (48) Maciejewski, W., & Sparke, L. S. 2000, MNRAS, 313, 74
- (49) Maciejewski, W., Teuben, P. J., Sparke, L. S. et al. 2002, MNRAS, 329, 502
- (50) Magorrian, J., Tremaine, S., Richstone, D. et al. 1998, AJ, 115, 2285
- (51) Márquez, I., & Moles, M. 1993, AJ, 105, 2090
- (52) Martini, P. 2004 in Coevolution of Black Holes and Galaxies, ed. by L. C. Ho, Cambridge University Press, p. 170.
- (53) Martini, P., & Pogge, R. W. 1999, AJ, 118, 2646
- (54) Martini, P., Regan, M. W., Mulchaey, J. S. et al. 2003, ApJ, 589, 774
- (55) Merloni, A. 2004, MNRAS, 353. 1035
- (56) Moles, M., Márquez, I., & Pérez, E. 1995, ApJ, 438, 604
- (57) Mulchaey, J. S., & Regan, M. W. 1997, ApJ, 482, L135
- (58) Norman, C. A., Sellwood, J. A., & Hasan, H. 1996, ApJ, 462 114
- (59) Origlia, L., & Leitherer, C. 2000, AJ, 119, 2018
- (60) Pérez, E., Márquez, I., Marrero, I. et al. 2000, A&A, 353, 893
- (61) Pfenniger, D., & Combes, F. 1994, A&A, 285, 94
- (62) Pogge, R. W., & Martini, P. 2002, ApJ, 569, 624
- (63) Pringle, J. E. 1981, ARA&A, 19, 137
- (64) Quillen, A. C., Frogel, J. A., & Gonzalez, R. A. 1994, ApJ, 437, 162
- (65) Regan, M. W., & Mulchaey, J. S. 1999, AJ, 117, 2676
- (66) Regan, M. W., Thornley, M. D., Helfer, T. T. et al. 2001, ApJ, 561, 218
- (67) Rozas, M., Relaño, M., Zurita, A. et al. 2002, A&A, 386, 42
- (68) Schinnerer, E., Eckart, A., Tacconi, L. J. et al. 2000, ApJ, 533, 850
- (69) Schmitt, H. R. 2001, AJ, 122, 2243
- (70) Sellwood, J. A., & Shen, J. 2004 in Coevolution of Black Holes and Galaxies, from the Carnegie Observatories Centennial Symposia, ed by L. C. Ho , Cambridge University Press, 204.
- (71) Shlosman, I., Frank, J., Begelman, M. C. 1989, Nature, 338, 45
- (72) Shlosman, I., Begelman, M. C., Frank, J. 1990, Nature, 345, 679
- (73) Shu, F. H., Tremaine, S., Adams, F. C., & Ruden, S. P. 1990, ApJ, 358, 49
- (74) Solomon, P. M., & Barrett, J. W. 1991 in Dynamics of Galaxies and their Molecular Cloud Distributions, from the IAU Symp. 146, ed by F. Combes & F. Casoli, Kluwer Academic Publishers, 235.
- (75) Turner, J. L., & Ho, P. T. P. 1994, ApJ, 421, 122
- (76) Wada, K. 2004 in Coevolution of Black Holes and Galaxies, ed. by L. C. Ho, Cambridge University Press, p. 187
- (77) Wada, K., Sakamoto, K., & Minezaki, T. 1998, ApJ, 494, 236
- (78) Weiler, K. W., van der Hulst, J. M., Sramek, R. A. et al. 1981, ApJ, 243, 151