The NGC 5846 Group: Dynamics and the Luminosity Function to
Abstract
We conduct a photometric and spectroscopic survey of a 10 sq. deg. region surrounding the nearby NGC 5846 group of galaxies, using the Canada-France-Hawaii and Keck I telescopes to study the population of dwarf galaxies as faint as . Candidates are identified on the basis of quantitative surface brightness and qualitative morphological criteria. Spectroscopic follow up and a spatial correlation analysis provide the basis for affirming group memberships. Altogether, 324 candidates are identified and 83 have spectroscopic membership confirmation. We argue on statistical grounds that a total galaxies in our sample are group members. The observations, together with archival Sloan Digital Sky Survey, ROSAT, XMM-Newton, and ASCA data, suggest that the giant ellipticals NGC 5846 and NGC 5813 are the dominant components of subgroups separated by 600 kpc in projection and embedded in a 1.6 Mpc diameter dynamically evolved halo. The galaxy population is overwhelmingly early type. The group velocity dispersion is 322 km s-1, its virial mass is , and . The ratio of dwarfs to giants is large compared with other environments in the Local Supercluster studied and, correspondingly, the luminosity function is relatively steep, with a faint end Schechter function slope of (statistical) (systematic) at our completeness limit of .
Subject headings:
Galaxies: clusters: individual (NGC 5846 Group); galaxies: kinematics and dynamics; galaxies: halos; galaxies: dwarf; galaxies: luminosity function; X-rays: galaxies1. Introduction
The mass function of dark matter halos (i.e., their abundance as a function of mass) is an important ingredient in constraining cosmological parameters using galaxies and clusters of galaxies (Frenk et al. 1990; Kauffmann & White 1993; Haiman et al. 2001; Reiprich & Böhringer 2002; Hoekstra et al. 2002). Very often, an assumed theoretical formula for the mass function is used to fit observations so that cosmological quantities such as the mean matter density of the universe may be constrained (Kochanek et al. 2001; Haiman et al. 2001; Henry 2004). However, almost all these methods neglect the fact that the abundance of small, halos is poorly understood. In fact, the very N-body simulations used to derive forms for this fitting function, e.g. Sheth & Tormen (1999), often produce an abundance of such halos (sometimes referred to “satellite galaxies”) that is far in excess of the observations (Moore et al. 1999; Kazantzidis et al. 2004; van den Bosch et al. 2005). One possibility is that the relationship between the light and mass distributions is poorly understood at small masses (Gao et al. 2004)—at the scale of dwarf galaxies. It is therefore critically important to constrain the luminosity function of these galaxies (Trentham & Tully 2002; Tully et al. 2002; Trentham et al. 2005), thus providing a crucial check on the simulations that attempt to model galaxy formation.
It is becoming clear that the relationship between the amount of starlight (or gas) that we see and the mass of dwarf halos is not simple. There is evidence that the amount of light associated with halo mass varies strongly with environment (Tully 2005). It may be that there are dark matter halos that have retained baryons in only undetectably small amounts. Various astrophysical processes can lead to a separation of dark matter and baryons, e.g., the ram pressure stripping processes such those observed in the famous “bullet cluster” 1E 0657-56 (Markevitch et al. 2002). The relationship between the luminosity function and the mass function might be complex, but the luminosity function may nevertheless retain signatures of specific astrophysical processes or of the underlying dark matter spectrum itself.
The present article is a contribution within a long term program to provide a better definition of the faint end of the luminosity function of galaxies. The general properties of the program are as follows. First, the observations should reach very faint absolute magnitudes. This goal can only be achieved if the targets are nearby. Second, good statistics are needed in conditions that provide control of volume completion. The issue of volume completion is addressed by obtaining complete samples to an apparent magnitude limit in groups selected to have minimal contamination problems. A single group may or may not provide adequate statistics by itself. Observations of numerous groups may be required. Third, a wide variety of environments should be sampled in order to constrain the possibility of environmental dependencies. This requirement imposes a need for many nights of observations.
The program depends critically on the recent availability of panoramic digital cameras. The imaging material discussed in this paper was acquired with the Canada-France-Hawaii Telescope (CFHT) 12K detector (the predecessor of the current MegaCam). The program also depends on some manner of confirmation that galaxy candidates are group members, hence relevant to the construction of the luminosity function. Confirmation is most reliably provided by redshifts, and this paper includes the results of spectroscopic observations of relatively faint, low surface brightness dwarfs with the LRIS instrument on the Keck I Telescope..
Initial attention was given to well populated clusters in both the high density (Trentham 1998b, 1998a) and low density (Trentham et al. 2001, hereafter TTV01) regimes. These observations suggested that there are significant variations with environment (Tully et al. 2002)—that the luminosity function of dwarf galaxies rises steeply in dense environments, but remains flat in the field. These results prompted an exploratory sampling of a wide variety of locations within the Local Supercluster with the Subaru Telescope SuprimeCam imager (Trentham & Tully 2002, hereafter TT02). It became clear that much more sky needed to be observed to build up meaningful statistics. This paper presents results from the first group in the program to receive full coverage: a tight, well defined knot of early type galaxies surrounding the elliptical galaxies NGC 5846 and NGC 5813.
2. Observations
2.1. NGC 5846: A Well-Isolated Group of Galaxies
This group is readily apparent because of its high density contrast and relatively isolated location. It has been studied as a group of galaxies in both the X-ray and the optical (Tully 1987; Haynes & Giovanelli 1991; Nolthenius 1993; Giuricin et al. 2000; Trinchieri & Goudfrooij 2002; Mulchaey et al. 2003). The distance to the system is taken to be 26.1 Mpc from an average over several sources, but most heavily reflective of the Surface Brightness Fluctuation measurement of Tonry et al. (2001). These authors give a distance to NGC 5846 itself of Mpc and a distance to NGC 5813 of Mpc, estimates we consider compatible with the two being at a common distance. The group members are overwhelmingly of early type, dominated by the ellipticals NGC 5846 () and NGC 5813 (). Within this distance, the group is the third most massive knot of early type galaxies (after the Virgo and Fornax clusters). The virial mass based on velocity information to be discussed in a later section, is , and the ratio of mass to light at R band is .
The isolation of the NGC 5846 Group is extremely favorable. It lies well off the main plane of the Local Supercluster, with no known structure to the foreground and very little in the background until the Hercules Supercluster at 10,000 km s-1. Figure 1a is a histogram of all Sloan Digital Sky Survey (Abazajian et al. 2004, hereafter SDSS) and NASA Extragalactic Database (NED hereafter) velocities of galaxies within (1.4 Mpc) of the center of NGC 5846 (not including our survey below). Remarkably, there are no galaxies at all within km s-1.
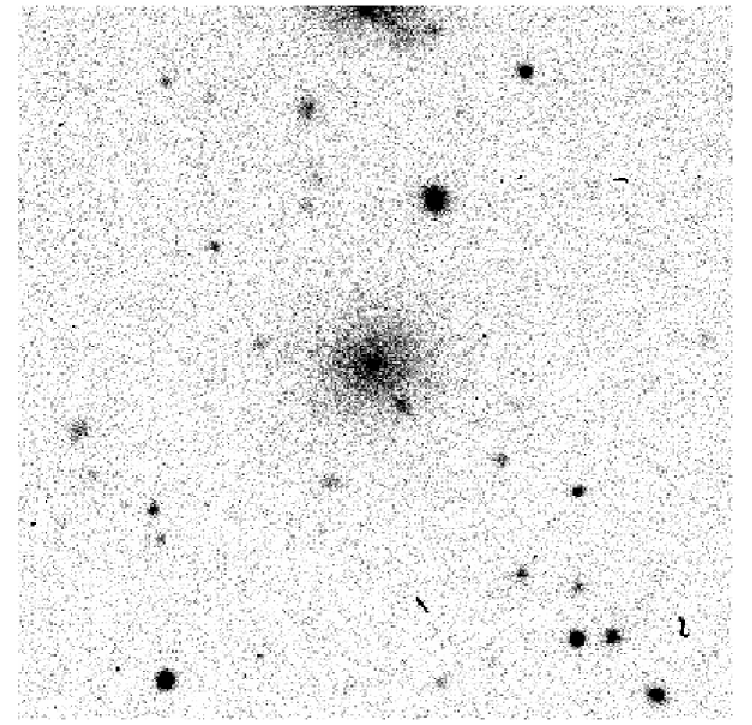
Figure 2 shows the distribution of all but two of the galaxies that are established to be within 3° of the group on the basis of a measured velocity; the two remaining objects are described only as H I detections in the literature, without optical counterparts. The shown galaxies have velocities in the range km s-1 .


![[Uncaptioned image]](/html/astro-ph/0506737/assets/x3.png)
The NGC 5846 Group. The graylevel image shows ROSAT X-ray emission with significance from 3 (the lightest features) to 5 (the darkest features). Spectroscopically confirmed, unconfirmed priority 1, and unconfirmed priority 2 member galaxies are marked with circles, squares, and diamonds, respectively. The size of each symbol is proportional to the negative of the magnitude. Unconfirmed priority 3 galaxies are marked with dots of the same size. The contours show the adaptively smoothed -band light distribution of the members, in units of 0.1, 0.5, 1, 5, and 10 pc-2. The Gaussian smoothing length for each galaxy is the distance to the third-nearest member.
Over the range of environments that will be explored in this program, the NGC 5846 Group lies in the regime of high density and intermediate mass. It possesses 4 galaxies brighter than (3 E/S0 and an Sb). In this paper, 324 galaxies are identified as probable or possible members, extending in faintness down to .
2.2. Wide Field Imaging
Observations of the NGC 5846 Group were made with the CFH12K CCD camera in queue mode during 11 nights between 16 March 2002 and 10 June 2002. An overall rectangular area of was surveyed with a small hole to avoid the glare of a 4th magnitude star. Two control fields were observed north, in a region with no known objects foreground of km s-1. The CFHT12K detector is a mosaic of 12 CCD detectors providing a field of , oriented in this experiment with the long axis E-W. The observations were tiled with half-field overlaps and dithers so that gaps between CCD chips were almost entirely covered in subsequent exposures and most of the area was observed twice. In total, 67 x 9 minute exposures were taken, all in the Cousins R band, covering 10.05 square degrees. Two of the 11 nights were non-photometric but photometry could be propagated across the entire survey region through the half-field overlaps. Seeing was 0.7–1.0 arcsec as mandated by the queue request. Images of the individual dwarfs will be available online via the CFHT image cutout service (planned for the future).
Members of the NGC 5846 Group range from spectroscopically accessible high surface brightness objects ( mag arcsec-2) to spectroscopically challenging very low surface brightness objects ( mag arcsec-2). Experience has shown that most low luminosity galaxies are low surface brightness, although there are exceptions (Drinkwater et al. 2003). Candidates can be isolated on the basis of this property. Morphological criteria can then be applied to further evaluate the probability of group membership. The details of the procedures to chose candidates have been described in TTV01 and TT02. The essence of the process is a culling of the very large background population with a concentration index threshold. Known dwarfs lie in a distinctly lower concentration index regime that giant galaxies. Nonetheless, substantial numbers of background contaminants manage to pass the concentration index screen and must be culled based on morphological criteria. This latter step requires inspection of images with the following considerations in mind. If there is evidence for a bulge or major bar, or spiral structure, or tidal disruption then such objects that pass the concentration filter are probably background. If instead an object is diffuse except possibly for a semi-stellar nucleation or patchy structure then it is probably nearby, hence a group member.
In TTV01 and TT02 there is a description of a rating scheme developed to characterize the probability of group membership for galaxies which have passed the surface brightness criterion (1: probable member; 2: possible member; 3: conceivable member; 4: almost certainly background). Additionally, a rating 0 is given to galaxies that were identified as group members on the basis of redshifts before the survey began, whatever their surface brightness, and a rating 5 is given to galaxies initially rejected as candidates because they lie above the concentration index cut but subsequently associated with the group by a redshift. The availability of velocity information for a significant fraction of the sample now permits a reevaluation of the validity of the morphology-based rating scheme. In §2.4 below we show that galaxies rated 1 and 2 are essentially always found to be group members, of order half the galaxies rated 3 are found to be group members, but almost none of the galaxies rated 4 are group members. Five high surface brightness galaxies (identified with a rating 5) are found to be members.
Before considering the SDSS and out Keck data, 318 galaxies are identified in the survey region with ratings 0-3. After including the SDSS, the number increases to 324, because 6 priority 4-5 galaxies not originally included in our sample are confirmed by the SDSS as members. These objects are identified in Table 1. The magnitudes presented in this table are isophotal -band magnitudes extracted to an isophote of 25.2 mag arcsec-1. Their distribution on the sky is shown in Figure 2.1. There is a strong enhancement in the surface number density of both confirmed members and candidates surrounding the elliptical NGC 5846 and a secondary enhancement surrounding the elliptical NGC 5813.
The two control fields N were chosen to lie off the filament containing the NGC 5846 Group and in the direction of the Local Void (Tully & Fisher 1987). No galaxies were found in these fields that could be rated 1–3. On the basis of the detection rate in the NGC 5846 area, one would anticipate 9 such candidates in these fields.
2.3. Spectrocopic Observations
The NGC 5846 Group lies within the area with published spectroscopic information from Data Release 3 of the SDSS. The NASA/IPAC Extragalactic Database (NED) and the SDSS provide velocities for 64 of our targets, all of them brighter than or . There is essentially no prior literature information for candidates at fainter magnitudes or for those with very low surface brightnesses. In order to probe these regimes, we undertook observations using the blue side of the Low Resolution Imaging Spectrograph (Oke et al. 1995, LRIS hereafter), on Keck I Telescope. The spectrograph, equipped with a 1″ slit and a 600 lines in-1 grating, has high blue quantum efficiency, with an overall system throughput of 56% at 5000 Å. Data were acquired on May 4, 2003 and June 13, 2004. Both nights were hampered by cirrus with extinction of 0.5-2 mag; nevertheless we obtained suitable spectra for 17 and 13 galaxies on the two nights, respectively, of which a total of 19 are newly reported members. The poor conditions limited attempts to observe the faintest dwarfs; however, good spectra were acquired for objects as faint as or . An LRIS spectrum and CFH 12K image are shown in Figure 3 of the faintest galaxy with a redshift.
|
|
|
2.4. Spectroscopic Membership Confirmation
The availability of a large number of new velocities provides a way of evaluating the membership rating scheme based on a concentration parameter and a qualitative judgment based on morphology. The NGC 5846 Group provides an environment that is particularly well-suited to this evaluation, because there is negligible confusion from the foreground or near background. Table 2 provides a summary of how things have turned out. We found all 26 surveyed galaxies with new velocities rated 1 (probable) and 2 (possible) to be group members. Of the galaxies rated 4 (likely background) only one relatively large galaxy has been revealed by spectroscopy to be a member. Among the thousands of galaxies in the survey region excluded by the concentration criteria, 304 have measured redshifts; of these, only 5 galaxies have been demonstrated to be group members.
Thus candidates rated 1 and 2 ought to be group members and, by contrast, very few group members emerge among galaxies rated 4 or those excluded because of high concentration. That leaves the galaxies rated 3 (conceivable member) to be considered. We find that velocity measurements confirmed 16 galaxies with rating 3 to be members and 7 galaxies to be background.
In summary, the combination of the quantitative concentration parameter and the qualitative morphological evaluation leads to good membership discrimination. There remains a grey area with the candidates rated 3. High surface brightness objects elude discovery in the imaging survey but can be found with a spectroscopic survey. Having said all this, the spectroscopic confirmation is complete only to and sampled only to . There cannot be complete confidence that the rating scheme works among the fainter galaxies that extend down to . It would be surprising, though, if there is a population of high surface brightness galaxies in the group at these faint magnitudes that makes a significant numeric contribution to the luminosity function.
Henceforth we refer to all member galaxies with redshifts as “spectroscopically confirmed members”; when we refer to priority 0-3 galaxies, we mean only those without a redshift.
2.5. Indicative Membership: Spatial Correlation
Concentrations of galaxies toward NGC 5846 and NGC 5813 are seen in the galaxy projections of Fig. 2 and in Fig. 2.1 introduced in the next section. A comparison of angular 2-point correlations among various sub-samples gives hints of different degrees of clustering. Sub-samples with relatively weak correlations are probably contaminated by non-members. The correlation that exists among all 324 galaxies rated 0-3 is shown in the upper left panel of Figure 4. The normalization in the correlation is achieved by comparison with 1000 Monte Carlo random populations of the area of the photometric survey. The entire area is overdense with respect to a fair sample of the universe so the amplitude of the normalization is given no meaning.

Next consider the correlation shown in the same panel for 199 galaxies either with membership confirmed by redshift or rated 1–2. The spectroscopic evidence suggests that most of the sample receiving these rating are members. Hence the correlation function should be fairly representative of the true global function for the group. We refer to this function as the “reference correlation” hereafter. The reference correlation is more peaked than the function describing the ensemble of the candidates. The ensemble sample must be contaminated by objects drawn from the background.
Figure 4b shows the correlation for the 83 galaxies established to be group members on the basis of velocities. This correlation function is noisier because of smaller numbers but is comparable to the function for the 199 member priority 0-2 sample. The reference correlation is actually slightly steeper which tends to confirm that the galaxies rated 1 and 2 are overwhelmingly members. A different situation is found in the correlation shown for the 125 galaxies rated 3. The much flatter distribution is evidence that quite a few galaxies rated 3 are non-members. The spectroscopic information already discussed revealed that only 16 of 23 candidates rated 3 (70%) are members.
In the Figure 4c, the correlation function is shown for the 61 galaxies with the morphological designation dE,N, nucleated dwarf ellipticals. Only 12 of these have membership confirmed by velocities. Most lie at faint magnitudes. The correlation analysis suggests that, overwhelmingly, galaxies of this morphology are members.
The spectroscopic information extends to galaxies as faint as . In total there are 38 priority 3 candidates brighter than this limit. The correlation analysis for these galaxies appears in Figure 4d. The correlation is intermediate between the reference function and that shown by the entire rating 3 sample in panel (b). We create a simple model in which 30% of the galaxies in the reference correlation are replaced by randomly distributed objects. This concoction of 70% correlated and 30% uncorrelated components provides a good description of the distribution seen in the bright priority 3 galaxies. This result agrees with the spectroscopic information available for half the objects in question.
There is no velocity information concerning the fainter candidates, and from the poorer correlation seen in Figures 4e-4f it can be inferred that many of the fainter rating 3 targets are drawn from the background. In fact, the early and late morphological types rated 3 have significantly different correlation characteristics. The distinct distributions are revealed in Figure 4e (early types) and 4f (late types). The 77 galaxies typed dE, dE,N, and dE/I show the correlation seen in panel (e) that is well described by a mix of objects that are 50% correlated and 50% uncorrelated (uncertainty ). By contrast, the late types (mostly dI, a few VLSB) show no correlation to the group. To summarize, the correlation distribution of the rating 3 candidates seen in the filled symbols in Fig. 4b can be decomposed into 70% group members among those brighter than , 50% group members among fainter early types, and essentially no group members among fainter late types.
One final consideration is morphological segregation of the galaxies. It is well known that in groups and clusters, early-type galaxies are more densely clustered than late-type galaxies (Dressler 1980; Postman & Geller 1984; Helsdon & Ponman 2003). If the fraction of early-type galaxies in the three priority groups differs greatly, the morphology-density effect would significantly influence the correlation functions. This would lead us to misinterpret differences among the correlation functions as differences in the membership probabilities of the galaxies. Fortunately, Table 2 shows that the morphological content of the three priority classes is quite similar. The weighted average early type fraction in the priority 0-2 galaxies is 0.82, and for the priority 3 galaxies it is 0.79. The difference in the correlation functions is too great to be explained just by this small difference in the early-type fraction.
Based on this simple model, we can calculate an estimate of the total group membership within our survey limits: 83 spectroscopically confirmed members; 32 priority 1 members; 84 priority 2 members; 60-80% of 14 bright priority 3 members; and 40-60% of the 84 faint early-type priority 3 members. The total estimate is group members.
3. Structure of the NGC 5846 System
3.1. Broad X-ray and Optical Picture
|
|
Combining the SDSS data with our observations, we are able to provide a broad picture of the environment of the NGC 5846 system. As evident in Figures 1 and 2.1, the system possesses complex substructure, but remains remarkably well isolated from other groups or clusters.
Another clue to the physical state of the system is the distribution of X-ray emission across the group. In elliptical-dominated groups, a hot, keV optically thin plasma often constitutes the largest baryonic component of the group’s mass. Archival ROSAT, ASCA, Chandra, and XMM-Newton observations of the NGC 5846 region exist. The ROSAT All-Sky Survey (RASS) covers the entire 10 sq. deg. field of our observations. However, with an average exposure time of only 355s, only the X-ray emission closest to the two brightest galaxies, NGC 5846 and NGC 5813, is detected in the survey. We show the 0.5-2.0 keV RASS emission in Figure 2.1. A weak X-ray source to the north of NGC 5846 is visible, but it is not associated with any group galaxies, and no optical sources in either the POSS or the SDSS appear to coincide with it. Also shown is the adaptively smoothed light distribution of the region. Each member galaxy is represented by a Gaussian on the sky with standard deviation equal to the distance to the third nearest member galaxy. The Gaussians are then added together. Figure 2.1 makes it clear that the two highest surface brightness features in the group, in both the X-ray and the optical, are the regions within kpc of the two brightest galaxies.
The broad picture revealed in both the optical and X-ray surface brightness maps is unusual. The NGC 5846 and 5813 galaxies are two roughly equal peaks of emission at both wavelengths, so the system as a whole appears binary. However, there are also other ellipticals nearly as bright, such as NGC 5838 and NGC 5831, without significant X-ray emission but with significant concentrations of smaller galaxies surrounding them. We will explore the dynamics of the system in greater detail in §3.3.
3.2. Two Subgroups: NGC 5846 and NGC 5813
A central question in understanding the NGC 5846 system regards the existence of “group-scale” X-ray emission. Both NGC 5846 and NGC 5813 possess diffuse X-ray emission from a hot, optically thin plasma, suggesting that they mark the center of the two largest dark matter concentrations in the system. But is the X-ray emitting gas confined to the galaxies only, emitting X-rays properly only as the hot interstellar medium of the elliptical galaxies (Eskridge et al. 1995), or is there evidence of a true intracluster medium (ICM) in which the galaxies are embedded? An extended ICM would make it clear that the NGC 5846 and 5813 galaxies are not only bright, X-ray emitting ellipticals; they are also the centers of much more massive dark matter halos. Previous analyses have considered ROSAT data (Böhringer et al. 2000; Ikebe et al. 2002; Osmond & Ponman 2004), but no comparisons with high-quality surface brightness profiles (such as from the SDSS) or discussions of the XMM-Newton observations of NGC 5846 exist.
To evaluate the extent of the X-ray emission, we examine XMM-Newton data for NGC 5846 (superior in sensitivity and field-of-view to the Chandra data) and the ASCA data for NGC 5813 (where neither XMM-Newton nor Chandra data is available). We extract X-ray surface brightness profiles from the available data. In the case of ROSAT and ASCA, we extract pre-calibrated photon images and exposure maps from the ROSAT All-Sky Survey Data Browser111http://wave.xray.mpe.mpg.de/rosat/data-browser and the NASA HEASARC data archive222http://heasarc.gsfc.nasa.gov/W3Browse/, respectively. For XMM-Newton, only images from the highest-sensitivity camera on board the telescope, the EPIC pn, were available. We use the XMM-Newton Software Analysis System (SAS)333http://xmm.vilspa.esa.es/sas/ to reduce these data.
In the case of NGC 5846, the RASS contributes a useful signal outside the diameter field-of-view of XMM-Newton. In the case of NGC 5813, ASCA provides superior data to the RASS. For the RASS, we use the 0.5-2.0 keV data to minimize the noise from the unrelated X-ray background. For the XMM-Newton EPIC pn we also use photons with 0.5-2.0 keV energies. For the NGC 5813 observations by the ASCA, we use the full-band images covering photon energies 0.7-10 keV. We also extract optical surface brightness profiles from calibrated -band imaging data publicly available from the SDSS.
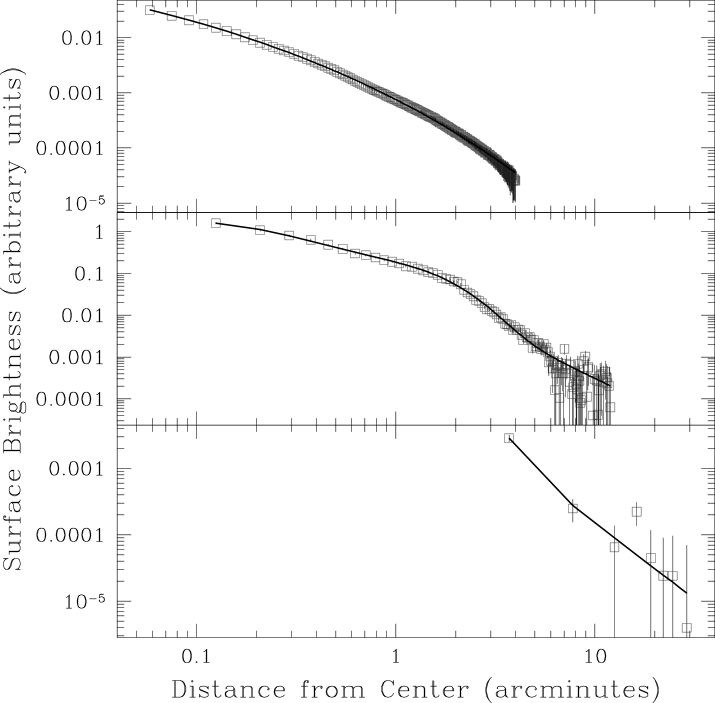
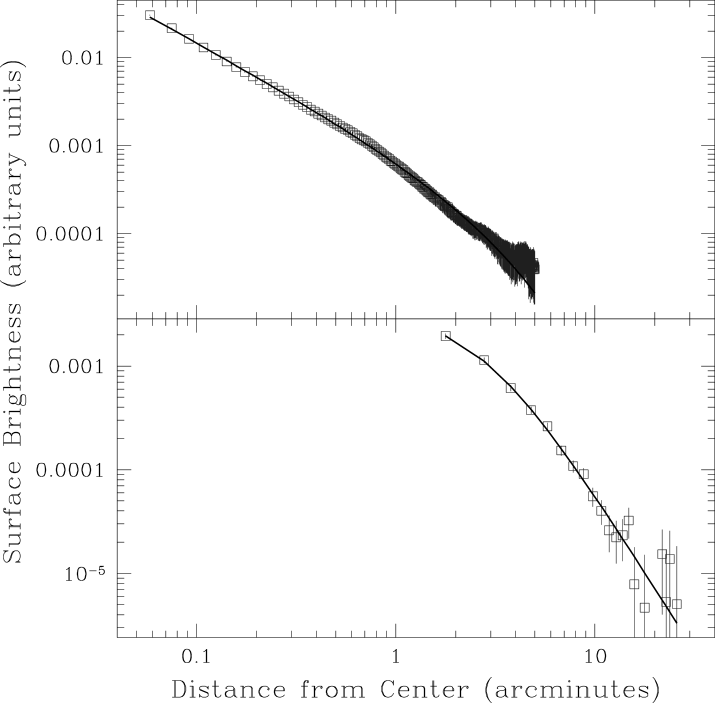
The profiles appear in Figure 5. In order that our analysis is not affected by the point spread function (PSF) of each instrument, we ignore data within a radius 4 times the full width of the PSF at half-maximum; the PSF deformation of the profiles should be negligible beyond these radii (Mohr et al. 1999). We fit the profiles with simple azimuthally symmetric models to evaluate their extent. While the models may not be correct in detail, they are useful tools in characterizing the distribution of light in the group. To fit the SDSS -band optical light distribution, we use a modified Sérsic (Sérsic 1968; Trujillo et al. 2004) profile:
| (1) |
where is the projected distance to the galaxy center, is the half-light radius, b is a constant, and and are the characteristic slopes. The case corresponds to the widely known de Vaucouleurs et al. (1976) profile. The Sérsic profile (, free) is known to fit a subset of the bright elliptical galaxies observed with the Hubble Space Telescope (HST). Others, however, require a nonzero inner slope for an acceptable fit (Trujillo et al. 2004) 444In Trujillo et al. (2004), these so-called “core-Sérsic” galaxies have inner profiles of the form . However, typical values of are pc, requiring much finer resolution to resolve than the data we discuss here possess. Therefore we approximate the inner region of the Trujillo et al. (2004) profile as a simple power law with slope ..
The X-ray light distribution is characterized by a double -model (Mohr et al. 1999):
| (2) | |||||
The single -model was originally used to describe data observed by the Einstein observatory (Jones & Forman 1984). Higher resolution Chandra observations have since revealed that emission from relaxed clusters is often more complex and requires either a broken power law or the two-component -model shown above (Buote & Lewis 2004).
The fit results in Table 3 suggest substantial differences between the two galaxies. The optical fit for NGC 5846 is of good quality. The brightest group member is consistent with being a de Vaucouleurs et al. (1976) model galaxy (). For NGC 5813 the pure Sérsic profile is not a good fit. With , the fit is rejected at better than 99.7% confidence. However, with free, we obtain a good fit. Thus, the dominant galaxies in the group, though possessing similar Hubble types (E0 and E1 for NGC 5846 and 5813, respectively), exhibit different light profiles in detail. NGC 5813’s inner stellar surface brightness profile is consistent with a power law of index , but that of NGC 5846 flattens near the center. Such variations in profile shapes are also present in field ellipticals observed by HST (Trujillo et al. 2004), though the reasons for the existence of two populations are not yet clear.
One clue to understanding the differences in the light profiles of the two galaxies may lie in their merging histories. Detailed HST observations of the central few arcsec in NGC 5813 reveal a dusty circumnuclear disk (Tran et al. 2001). The inner region of NGC 5846 contains no disk, but X-ray and optical filamentary structures instead (Goudfrooij & Trinchieri 1998; Tran et al. 2001; Trinchieri & Goudfrooij 2002). One interpretation is that the filaments in NGC 5846 are relics of interaction with smaller galaxies (Goudfrooij & Trinchieri 1998). The fact that NGC 5813 contains an undisturbed circumnuclear disk suggests that it may have had fewer recent mergers than NGC 5846. For this reason NGC 5813 retains a steeper, more undisturbed stellar profile than does its sister galaxy.
The X-ray data reveal that the intracluster medium is more extended than the optical light distribution. We obtain acceptable fits for a double -model in NGC 5846, while for NGC 5813 a single -model suffices. The ratio of the X-ray to the optical half-light radii for NGC 5846 and NGC 5813 are and , respectively; the inferred 90% light radii have ratios of and , respectively. Interestingly, though NGC 5813 is optically less bright NGC 5846, it contains a more luminous and extended X-ray halo.
3.3. Dynamics
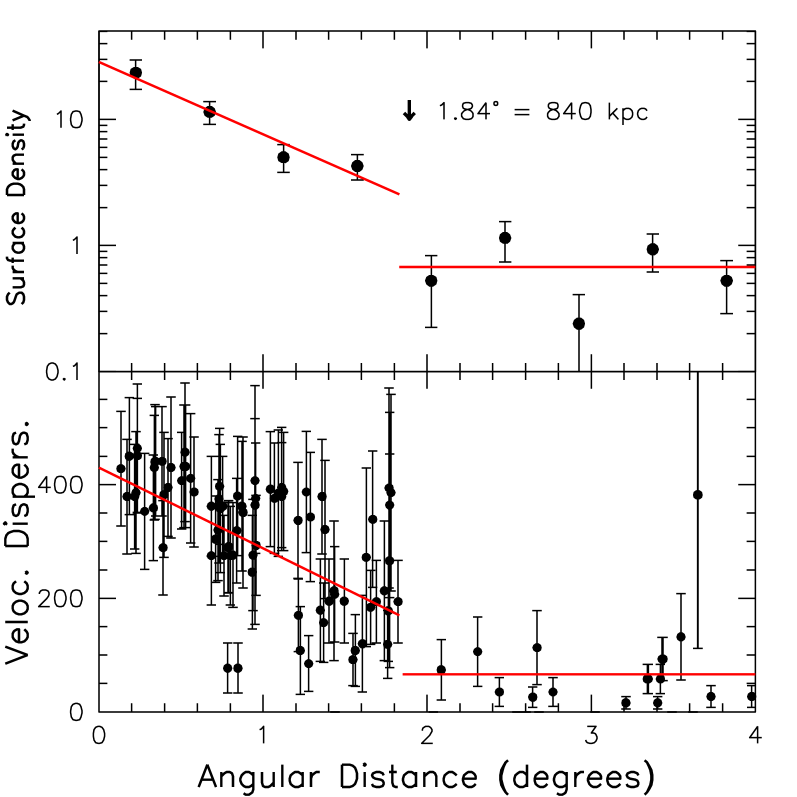
On dynamical grounds, the NGC 5846 Group can be expected to consist of an evolved core surrounded by an infall region. Given the mass of the group, the infall region is expected to extend to radius, considerably beyond the boundaries of the survey region illustrated in Fig. 2. The interest of the current study is with the dense, dynamically evolved core. The dimensions of that core can be inferred from the radial density and velocity distribution of galaxies in the vicinity of the group which are shown in Figure 6. It is seen in the top panel of that plot that the surface number density of galaxies declines smoothly with radius out to then abruptly drops a factor to a roughly constant plateau. In the lower panel it is seen that the velocity dispersion within radial shells drops by roughly a factor 2 inside . Declining velocity dispersion profiles are typical of dynamically evolved clusters (Mahdavi et al. 1999; Biviano & Katgert 2004; Sand et al. 2004; Mahdavi & Geller 2004). Beyond 1.8°, locally averaged velocity dispersions drop to the low levels see in the Local Volume (Karachentsev et al. 2003).
The properties demonstrated in Fig. 6 are as expected from a collapsed group. The dimension can be inferred to mark the caustic of second turn-around (Bertschinger 1985). Objects bound to the group decouple from the cosmic expansion at a radius of first turn-around (the zero-velocity surface around the group) (Sandage 1986), collapse then reexpand to a second turnaround, then continue to oscillate while exchanging orbital energy with other group components. An observable cusp might be anticipated from the recent arrivals that have only had time to pass once through the group and just reach second turnaround. All other galaxies that have collapsed should lie interior (with rare slingshot exceptions).
If one gives consideration to other dynamically evolved groups in the Local Supercluster in a similar manner, one can infer a plausible second turnaround caustic by looking for an outer boundary to the distribution of early type systems. One of the authors (RBT) has undertaken this task, and has determined the following unpublished relation between the group velocity dispersion, , and the radius of the apparent caustic of second turnaround, , from observations of 7 dense groups and clusters in the Local Supercluster:
| (3) |
The conditions in the NGC 5846 Group are consistent with this relationship. Because each value of can be used to define a value of using the velocity dispersion of the galaxies within , the above expression is a nonlinear equation in one variable. Solving the equation numerically, we find that 87 galaxies with velocities giving a dispersion of , defining a circle of projected radius Mpc , are included within the projected circle. This value of is consistent with the radius at which the velocity dispersion profile levels off (Figure 6).
The circle is superimposed on Fig. 2, with the center (at 226.40,+1.79) chosen to optimize the enclosure. We conduct a virial analysis based on these 87 galaxies, with no luminosity weighting. We apply the median virial mass estimator (Heisler et al. 1985), which involves no luminosity weighing and does not require the determination of a velocity or spatial center. 10000 Monte Carlo simulations of the group are used to derive the errors on the estimated mass. We find the virial mass to be .
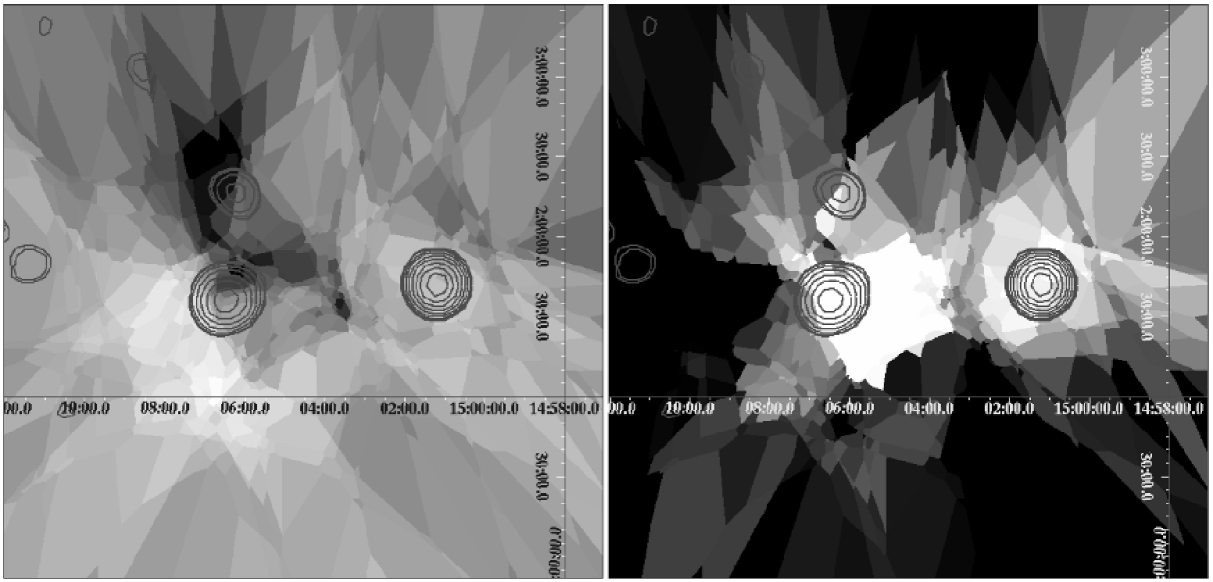
To further explore the group dynamics, we consider all 100 galaxies with known redshifts within 3° (1.8 Mpc) of NGC 5846, the galaxies plotted in Fig. 2. We construct a map of the mean velocity and velocity dispersion across the group. We define two functions on the sky: is the mean velocity of the closest group members to the position ; is the velocity dispersion of the closest members to that position. We show and along with the RASS X-ray contours in Figure 7.
The maps of and are complex in character. There is considerable structure in the velocity dispersion across the face of the group. The regions associated with the bright galaxies NGC 5846, NGC 5813, and NGC 5831 show large velocity dispersions, km s-1, while the north-south region at 15:03:30 (exactly between the NGC 5846 and NGC 5813 subgroups) shows a low velocity dispersion, km s-1. The spatial clumping and the velocity dispersion signatures suggest that NGC 5846 and NGC 5813 are the centers of distinct sub-structures. The persistence of this substructure is interesting because the characteristic crossing-time between these two centers (separation divided by mean group dispersion) is only 1.5 Gyr, the age of the universe.
The velocity map shows a general north-south trend in the mean local velocity of the galaxies: the galaxies to the north of the NGC 5846–NGC 5813 axis have lower velocities than those to the south, perhaps indicative of rotation. The complexity of the dynamical maps could not have been predicted from the featureless velocity histogram (Figure 1b). A single-peaked, regular velocity distribution is not necessarily indicative of a relaxed system. The system has almost certainly not reached virial equilibrium.
4. Properties of the Member Galaxies
4.1. Surface Brightness Scaling Relations
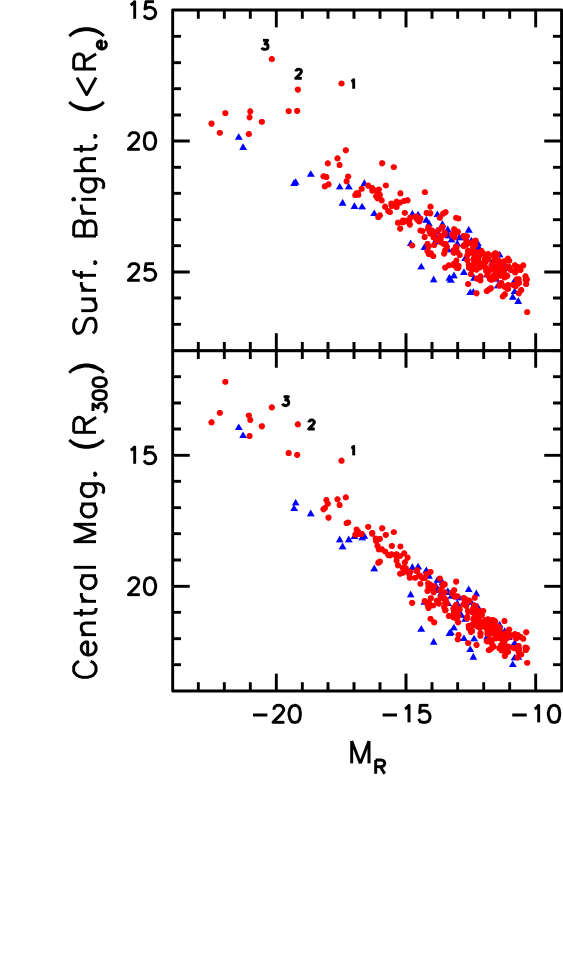
The surface brightness properties of the entire sample of confirmed group members and plausible candidates is demonstrated in Figure 8. The top panel shows the dependence with luminosity of the mean surface brightness within the radius containing half the light of a galaxy, the effective radius, while the bottom panel shows the dependence of the central magnitude through a 300 kpc radius metric aperture. In both plots there is a remarkably clean separation between high and low surface brightness systems. A modest separation is also found with morphological type in these plots. Types Sa and earlier are indicated by circles and lie slightly above types Sab and later, labeled with triangles.
The two plots carry similar information about an overall decrease in surface brightness in proceeding from giant galaxies to dwarfs. There is a small difference between the plots for systems toward the lower luminosity end of the high surface brightness group. If one splits the high surface brightness sample at , it is seen that the fainter portion have higher mean surface brightnesses within an effective radius but marginally lower metric central magnitudes than the brighter portion. The increase in mean surface brightness is consistent with the scaling relation found by Kormendy (1977). Trujillo et al. (2001) point out that the ratio of central to mean surface brightness varies in a well correlated way with the Sérsic (1968) parameterization of the radial distribution of light. The increase in mean surface brightness toward fainter luminosities reflects a trend in Sérsic parameter. As for the apparent decrease in the metric central luminosity toward fainter though high surface brightness galaxies, partly this could be an artifact of resolution. The parameter, the magnitude within a radius of 300 pc = was chosen to represent the central flux without constraining to a radius that would be affected by seeing. However, the galaxy N5846–205 at (labeled 1 in the figure) has an effective radius of only 215 pc = so the measure under-represents the central flux. With NGC 5846A and NGC 5845 (labeled 2 and 3 respectively), effective radii are pc. These unusual objects are given attention in the following section.
4.2. Small High Surface Brightness Objects
The galaxies that are identified by numbers in Fig. 8 are remarkable for their high central densities and small dimensions. They are N5846–205 (1), NGC 5846A (2), and NGC 5845 (3). They only come to our attention through spectroscopic confirmation of an appropriate redshift. Their high surface brightnesses would exclude them from our sample of group candidates. Hence, our selection criteria demonstrably fails in this occasion occasion. Is this failure common or rare?
One could ask if there is a relationship with the ultracompact dwarfs that have been found in the Fornax Cluster (Phillipps et al. 2001). Those objects are faint () and small ( pc), so small that they are indistinguishable from stars in ground-based imaging. They also only came to attention through spectroscopy. In the case of the NGC 5846 Group, SDSS spectroscopy has provided reasonable completion of non-stellar targets in the field that are brighter than (). Hence, an ultracompact dwarf population like that found in Fornax would not be accessed with the current observations in the NGC 5846 region, because such dwarfs would be both too faint and too small.
Still, the SDSS spectroscopy does extend to a faintness limit that is interesting () and precludes that there is a numerically important population of high surface brightness objects in the range . Only one high surface brightness galaxy, N5846–205, is found in this range. This system has properties similar to the Local Group elliptical M32, though N5846–205, with , is brighter by a magnitude. The other two high surface brightness objects that draw attention in Fig. 8, NGC 5846A and NGC 5845, are small in size but have luminosities that put them above the dwarf regime.
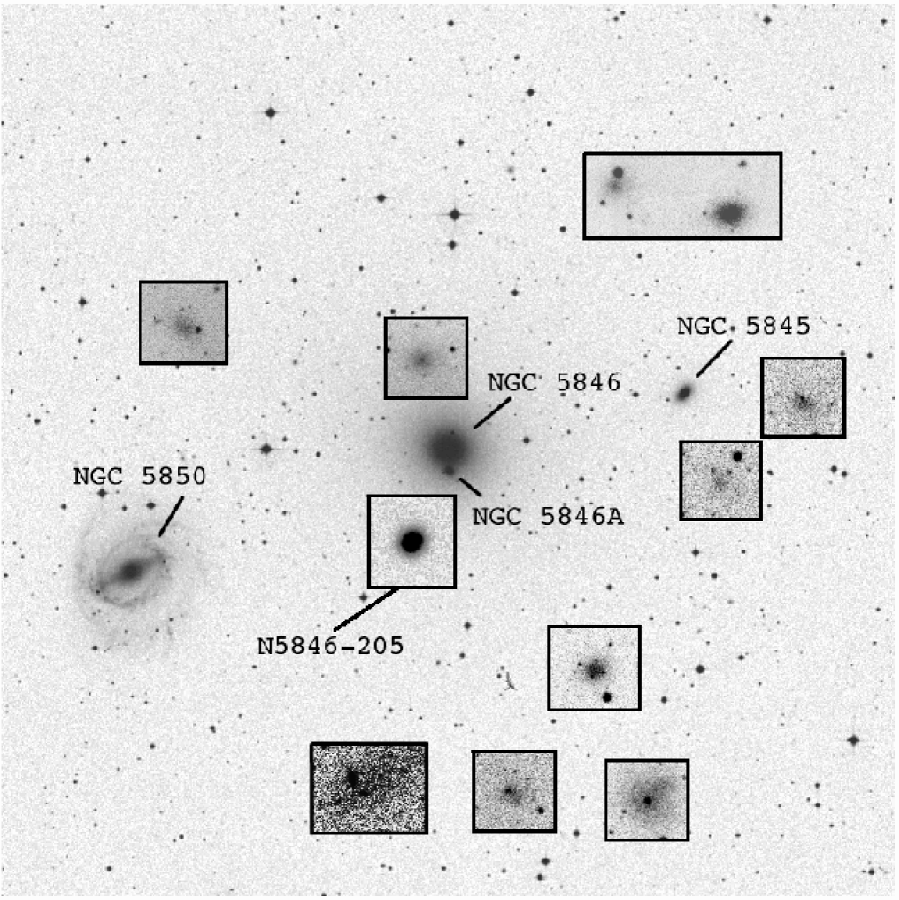
These three high surface brightness systems are very close to the core of the group! Their locations are seen in Figure 9. These three galaxies are the closest spectroscopically confirmed group members to NGC 5846, lying at 5, 25, and 55 kpc in projection (the other galaxies shown in blowup boxes in Figure 9 are low surface brightness candidate dwarfs without known velocities). This close proximity to the dominant NGC 5846 of the three most extreme objects in the surface brightness plot suggests very strongly that these objects have been tidally stripped. In this respect, these objects may be very large counterparts to the Fornax ultra compact dwarfs, suspected also to be the victims of tidal stripping or ‘threshing’ (Bekki et al. 2003).
These objects are interesting in their own right but they are a distraction from the thread of the current investigation. The SDSS velocity information assures us that high surface brightness galaxies constitute only a tiny fraction of the group population in the interval . There is no information, but no reason to suspect, that high surface brightness systems make up an important fraction of the population fainter than .

4.3. Luminosity Function
The analysis in the previous sections has provided strong constraints on the group membership down to faint levels. The group is sufficiently populated that the domain of the region that has undergone collapse is reasonably defined ( Mpc). There is confirmation of membership for essentially all galaxies brighter than so the luminosity function at the bright end is quite secure (though statistics at high luminosities are limited). At fainter magnitudes the partial velocity information and the spatial correlation information provide good constraints on membership probabilities.
To constrain the luminosity function of the galaxies, we place objects in 0.5 mag bins and calculate the surface number density per unit absolute magnitude. The result appears in Figure 10. If there is only one galaxy in a bin, we combine that bin with an adjacent one. The luminosity function is fit to a faint limit of . We assume that the dropoff faintward of that magnitude is due to incompleteness. The final luminosity function includes galaxies that are likely members according to the correlation analysis (§2.5): all galaxies confirmed by velocities as members, plus all galaxies rated 0–2, plus 70% of galaxies rated 3 brighter than , plus 50% of galaxies of early type rated 3 fainter than . Because the number of galaxies per bin is small, we use the Gehrels (1986) asymptotic formula for calculating the error in a bin with members:
| (4) |
This formula is accurate to 1.5% for all values of .
We find a striking feature: there is a plateau, or even dip, in the LF at . If real and not due to noise, this feature cannot be described by a simple Schechter (1976) function. A similar feature exists, with greater significance, in the data described by TT02. The Virgo cluster exhibits a quite significant and similar LF “bump” (Trentham & Hodgkin 2002).
We attempt to model this luminosity function using progressively more complicated fitting functions. To begin, in Figure 10a, we fit a simple power law in luminosity,
| (5) |
Where is the number density of galaxies with , and is the slope defined so that it matches the faint-end slope of a Schechter (1976) function. We find this function to be an acceptable fit to the data (see Table 4). Given, however, that a single power law mass or luminosity distribution is not anticipated by either theoretical models of structure formation or observations, we also fit a Schechter (1976) function:
| (6) | |||||
This function also yields an acceptable fit. However, the characteristic magnitude is constrained to be at 95% confidence. This value is only marginally consistent with other analyses of the local galaxy luminosity function. For example, the overall SDSS luminosity function (Blanton et al. 2001) has at the 68% confidence level (the difference between the and the band photometry is negligible given our error bars). The value of is consistent with the overall SDSS value. Figure 10a shows both the single power law and the Schechter function fits to our data.
Because the single Schechter function fit yields somewhat too bright an , it is useful to evaluate other luminosity function models. The surface brightness-magnitude diagram (Figure 8) suggests a third way to proceed. There appears to be a significant gap in the surface brightness distribution in the group population. An ensemble of high surface brightness galaxies are clustered separately from the rest of the members (chiefly low-surface brightness dwarfs). We ask whether the two populations have separate luminosity distributions, similarly to what is seen in TT02 and Trentham & Hodgkin (2002). To test this idea, we fit these two populations separately by dividing them into groups with and . In the high surface brightness population, one bin between and has zero members; the error in this empty bin is still described by the Gehrels (1986) formulation above (equation 4). The high surface brightness population is fit with a Gaussian,
| (7) |
while the low-surface brightness population is fit with a Schechter function. The results appear in Figure 10b and Table 4.
The Gaussian and Schechter functions provide a good fit to the LF of the two respective populations. The faint-end slope is consistent with the faint-end slope of the single Schechter function fit; the difference derives from the fact that the high-luminosity galaxies are excluded, leading to a much fainter . The well-known correlation between and then leads to a smaller best-fit value of .
Our method for the inclusion of the priority 3 members may lead to systematic errors in . To constrain these uncertainties, we undertake two further fits. First, we measure for only the spectroscopically confirmed plus the priority 1-2 members, obtaining . Then we measure for all the spectroscopically confirmed members plus the priority 1-3 members, obtaining . Thus, we expect both the statistical and systematic errors in to equal be . Our final adopted is an attempt to encapsulate all the complexities of the sample into a single value. We take the mean between the whole-sample and the low surface brightness fits: (statistical) (systematic).
Given the large number of free parameters and the small number of data points, the need for a Gaussian high-luminosity component is not statistically significant. However, a formulation more complicated than the Schechter function is required to describe any saddle between the giants and the dwarfs, a saddle that it seen recurrently in different samples, e.g. TT02 and Trentham & Hodgkin (2002). The present formulation may have some physical sense if the separation between high and low surface brightness systems seen in the scaling relations has some meaning. We have discussed surface brightness bimodality and a possible dynamical interpretation in the context of a sample dominated by late-type disk galaxies (Tully & Verheijen 1997). It is not clear if that discussion has relevance to this sample of predominantly early types. We do not argue that the present sample in itself provides justification for adopting a two-component luminosity function. The matter is something to review as material accumulates for more environments.
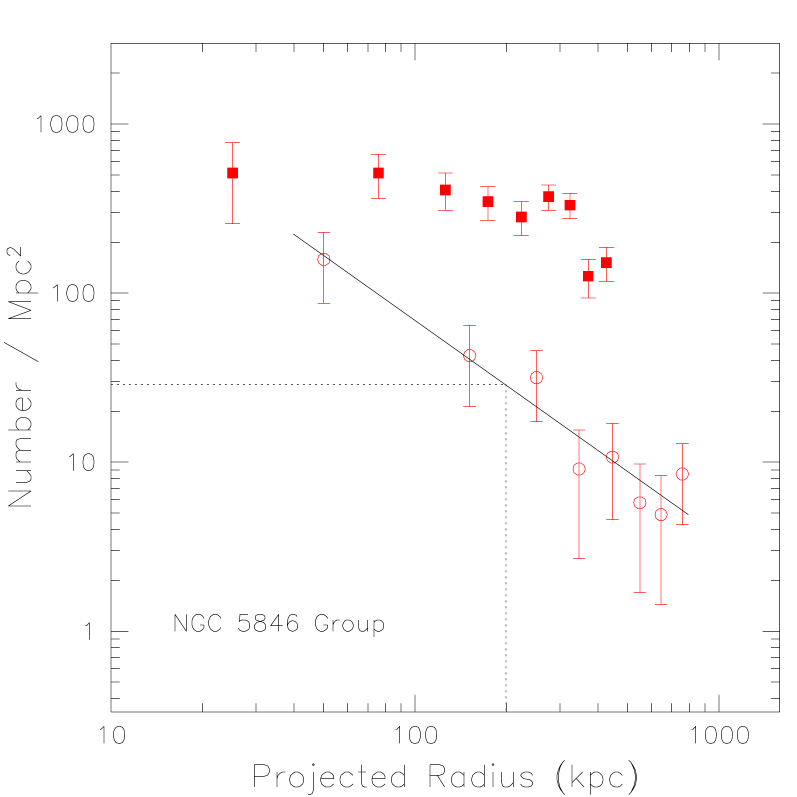
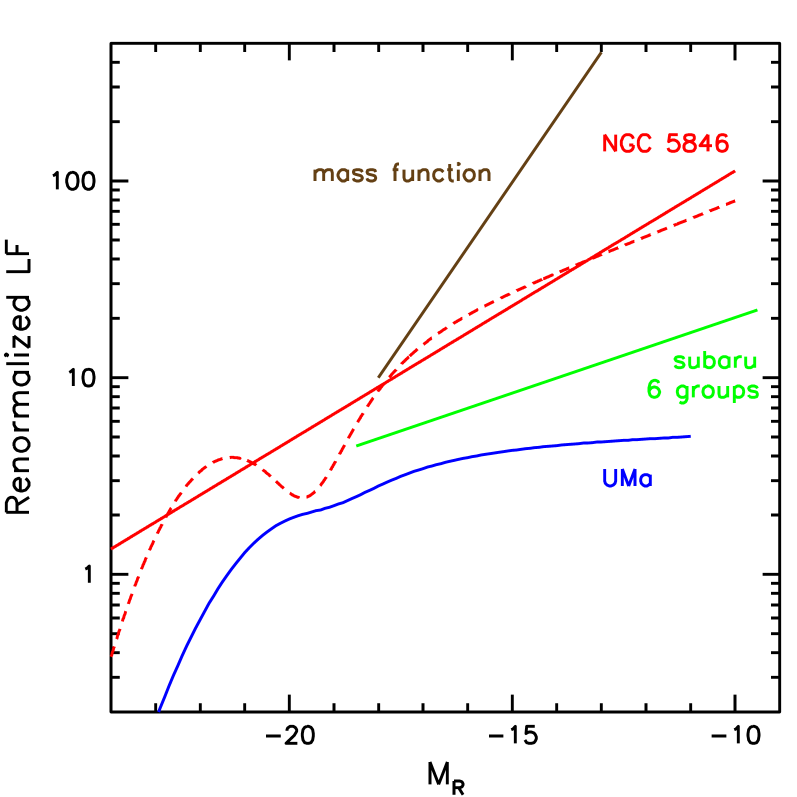
Finally, we wish to compare the luminosity function for this group with those found in other environments. To make this comparison we need a number density normalization. As a matter of convenience and to establish a convention, we determine a density in luminous galaxies () at a radius of 200 kpc from the group center. We are looking for variations in the bright/faint distributions which is why the group density definition is restricted to just the bright members. The metric radius of 200 kpc is chosen because it is representative of the core of our smallest groups. Details of the normalization procedure are discussed by TT02. Figure 11 presents the run of the density of galaxies with radius in the NGC 5846 Group in a fashion analogous to what is found in TT02. The fit to the density distribution of the luminous galaxies (open symbols) gives a normalization of 29 galaxies/Mpc2 at a group radius of 200 kpc. The resulting renormalized LF, and a comparison with other groups, appears in Figure 12.
5. Summary
The long-term goal of this project is to explore the nature of the luminosity function of galaxies over a wide range of environments. In previous studies of environments in the Local Supercluster we have not had the areal coverage to encompass substantial fractions of the target groups. This deficiency is corrected in the present study of the NGC 5846 Group. It is seen in Fig. 2 that the area of our CFHT wide field survey covers almost the entire region subsequently considered to lie within the second turnaround cusp, . Dwarf galaxies as faint as can be identified in the group, with incompletion setting in at .
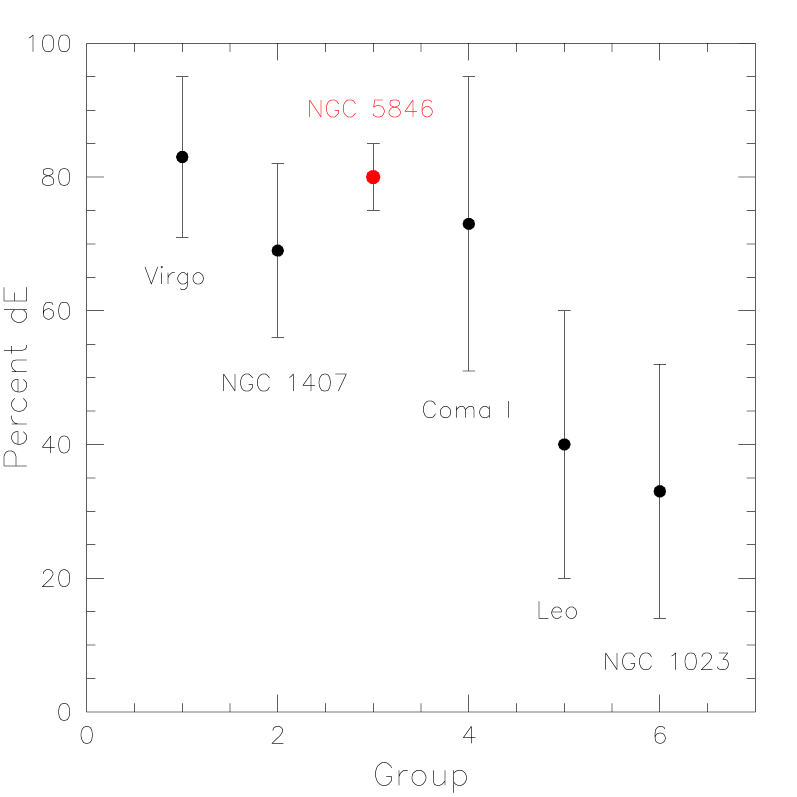
Almost all galaxies associated with the group with are spectroscopically confirmed. We identify 324 probable or plausible candidates of which 83 have redshifts. Based on redshift sampling and a correlation analysis, we suggest that of the 324 candidates are true members. The number of dwarfs in the NGC 5846 Group is very large. If, following TT02, a dwarf-to-giant ratio is defined as No. galaxies with over No. galaxies with then dwarfs / giants . The error includes the uncertainty in the rating 3 memberships and incompletion near the limit. This ratio of dwarfs to giants is larger than the values seen in any of the TT02 groups. Figure 13 compares the percentage of dwarf elliptical galaxies () in the NGC 5846 Group with the TT02 groups. The NGC 5846 Group is overwhelmingly populated by early type dwarfs, with , comparable to the situation in the Virgo Cluster. About of the early-type dwarfs are nucleated.
The large dwarf to giant ratio is reflected in the relatively steep luminosity function at faint magnitudes. The simplified single power law slope of is significantly steeper than the mean slope for 6 groups of found by TT02 ( probability). We also show the luminosity function found for the low density, spiral rich Ursa Major Cluster where the faint end slope is . All of these observed luminosity functions are much shallower than the modified Press-Schechter mass function expected from the hierarchical clustering paradigm (Sheth & Tormen 1999).
The present observations taken with the earlier work already strongly support the proposition that the faint end of the luminosity function of galaxies varies with environment. Alternatively expressed, the ratio of dwarf to giant galaxies varies with environment. The dense, dynamically evolved NGC 5846 Group has a high dwarf/giant ratio and a relatively steep faint end luminosity function. Still, even in this environment there is a dearth of dwarfs compared to the expectations of the mass spectrum. There is the implication that astrophysical processes have affected the visible manifestations of low mass halos, and in ways that are more effective at suppression of light in lower density environments.
We thank the anonymous referee for insightful comments. This program involves observations with the Canada-France-Hawaii and Keck telescopes. It is supported by NSF award AST-03-07706.
| Galaxy ID | P | Type | Notes | |||||||||
|---|---|---|---|---|---|---|---|---|---|---|---|---|
| N5846- | ||||||||||||
| 001 | 3 | 14:57:32.5 | +00:49:40 | dE,N | 21.08 | 22.54 | -11.13 | 0.12 | 3.3 | 25.65 | ||
| 002 | 3 | 14:57:40.3 | +02:46:40 | dE | 20.77 | 21.74 | -11.45 | 0.13 | 2.6 | 24.85 | ||
| 003 | 3 | 14:57:43.3 | +01:21:18 | dI | 18.83 | 20.67 | -13.37 | 0.12 | 4.9 | 24.27 | ||
| 004 | 2 | 14:57:45.1 | +03:25:56 | dE | 20.37 | 21.83 | -11.85 | 0.14 | 3.7 | 25.22 | ||
| 005 | 3 | 14:57:48.5 | +02:11:47 | dE | 21.16 | 21.92 | -11.06 | 0.14 | 1.9 | 24.60 | ||
| 006 | 3 | 14:57:52.2 | +03:03:56 | dI | 18.82 | 20.22 | -13.38 | 0.12 | 3.5 | 23.50 | ||
| 007 | 3 | 14:57:52.3 | +02:26:39 | dE | 21.52 | 22.73 | -10.70 | 0.14 | 2.6 | 25.57 | ||
| 008 | 3 | 14:57:53.0 | +01:04:48 | dE | 20.14 | 21.11 | -12.07 | 0.12 | 2.8 | 24.37 | ||
| 009 | 0 | 14:57:53.1 | +00:56:03 | E/S0 | 15.35 | 17.90 | -16.86 | 0.12 | 8.9 | 22.09 | 1886 | |
| 010 | 3 | 14:58:07.0 | +02:03:43 | dE | 18.70 | 20.23 | -13.51 | 0.13 | 4.0 | 23.68 | ||
| 011 | 1 | 14:58:12.6 | +01:59:39 | dE,N | 19.81 | 21.27 | -12.39 | 0.12 | 3.6 | 24.62 |
Note. — The full version of the table will appear in the Astronomical Journal. The morphological type is indicated as follows: dI, dwarf irregular; dE, dwarf elliptical; N, nucleated dwarf; E, elliptical; S, spiral; and VLSB, very low surface brightness galaxy. P is the original membership probability assigned to the galaxy purely from photometry and morphology (0 = non-SDSS spectroscopic redshift; 1 = probable member; 2 = possible member; 3 = conceivable member; 4 = likely not a member). , and are the measured band magnitudes, with the first being the isophotal magnitude (to 25.2 mag arcsec-1), the second being the magnitude within 300 pc (2.3″), and the third being the isophotal absolute magnitude. is the reddening, and is the half-light radius in arcseconds. The heliocentric velocity in km s-1 is . The notes give other galaxy identifications; ZM indicates data from Zabludoff98. All redshifts are from the NASA Extragalactic Database, unless the date of a Keck observation is indicated, in which case they are new. Galaxies marked with “sat” were saturated in our imaging; for these galaxies, all values were derived from SDSS public data, with appropriate conversions from the SDSS to Cousins photometric bands.
| Priority | Early-Type | Number of | Confirmed Members | Confirmed Members | Confirmed |
|---|---|---|---|---|---|
| Rating | Fraction | Candidates | In the Literature | With Keck I | Non-members |
| 0 | 0.60 | 35 | 35 | 0 | 0 |
| 1 | 0.79 | 39 | 3 | 4 | 0 |
| 2 | 0.90 | 102 | 6 | 13 | 0 |
| 3 | 0.73 | 149 | 15 | 2 | 7 |
| 4,5 | 6 | 0 |
| Parameter | NGC 5846 | NGC 5813 |
|---|---|---|
| Optical Fit using | ||
| 216/234 | 285/293 | |
| =0 | ||
| 50% light radius() | kpc | kpc |
| 90% light radiusaaThese parameters depend entirely on the other fit parameters; the quoted intervals are derived from the best fit parameters and errors using Monte Carlo simulations. | kpc | kpc |
| X-ray Fit using Models | ||
| 120/119 | 8/17 | |
| kpc | kpc | |
| kpc | ||
| 50% X-ray radiusaaThese parameters depend entirely on the other fit parameters; the quoted intervals are derived from the best fit parameters and errors using Monte Carlo simulations. | kpc | kpc |
| 90% X-ray radiusaaThese parameters depend entirely on the other fit parameters; the quoted intervals are derived from the best fit parameters and errors using Monte Carlo simulations. | kpc | kpc |
Note. — Best-fit values and 68% confidence intervals are shown.
| Data Set | Fit Type | Parameter | Best Fit |
|---|---|---|---|
| All Data | Power Law | ||
| = 8.2/15 | |||
| All Data | Schechter | ||
| Low-SB | Schechter | ||
| Galaxies | = 4.4/11 | ||
| High-SB | Gaussian | ||
| Galaxies | |||
Note. — The 95% confidence intervals take the correlation among all the parameters into account; they are reported as one-sided when the lower and upper errors are similar, and as two-sided when the lower and upper errors differ substantially. The normalizations and are in units of Galaxies Mpc-2 mag-1.