A Multi-wavelength study of the Pulsar PSR B
and its X-ray trail
Abstract
We report on the emission properties of PSR B192910 and its putative trail from a multi-wavelength study performed using optical, X-ray and radio data. XMM-Newton observations confirm the existence of the diffuse emission with a trail morphology lying in a direction opposite to the transverse motion of the pulsar. The trail spectrum is non-thermal and produced by electron-synchrotron emission in the shock between the pulsar wind and the surrounding medium. Radio data from the Effelsberg 11cm radio continuum survey show an elongated feature which roughly coincides with the X-ray trail. Three not fully resolved radio sources seen in the NVSS survey data at 1.4 GHz match with part of the elongated radio feature seen at 11cm. The emission properties observed from PSR B192910 are in excellent agreement with a non-thermal and, thus, magnetospheric radiation dominated emission scenario. The pulsar’s X-ray spectrum is best described by a single power law model with a photon index of . A flux contribution from the thermal emission of heated polar caps of at most is inferred from a best fitting composite Planckian and power law spectral model. A pure thermal emission spectrum consisting of two Planckian spectra is regarded as unlikely. A broken power law spectral model with and the photon-indexes and can describe the optical and X-ray data entirely in terms of a non-thermal magnetospheric origin. The X-ray pulse profile observed in the keV band is found to be markedly different from the broad sinusoidal pulse profile seen in the low statistic ROSAT data. Fitting Gaussians to the X-ray light curve indicates the possible existence of three pulse components. A small narrow pulse, characterized by energies greater than 1 keV, is found to lead the radio main pulse by . The fraction of pulsed photons in the keV band is . For the sub-bands keV and keV the pulsed fraction is and , respectively, indicating a mild energy dependence at a level. Simulations in the framework of an outer-gap emission model are able to reproduce the observed X-ray pulse profile and its phase shift relative to the radio pulse.
Accepted for publication in ApJ on March 16, 2006
1 INTRODUCTION
Currently, a consistent scenario for the evolution of the X-ray emission properties of aging rotation-powered pulsars does not exist yet. This surprising fact is largely due to the lack of sufficient observational data. Young111In standards of high energy astronomy rotation-powered pulsars are called young, middle aged and old if their spin-down age is of the order of few times yrs, yrs and yrs, respectively. This classification is diffuse, though, with a smooth transition in between the different groups. and middle aged neutron stars, which emit strong pulsed non-thermal and/or surface hot-spot plus cooling emission, were studied reasonably well in the X-ray band. In contrast, until recently, most old radio pulsars were too faint for a detailed examination of their X-ray emission (cf. Sun et al. 1993; Manning & Willmore 1994; Becker & Trümper 1997; Saito 1998). However, especially old rotation-powered non-recycled pulsars are of particular interest for the study of particle acceleration and high energy radiation processes near the neutron star’s surface and in its magnetosphere. This is because their ages are intermediate between those of the well-studied young and cooling neutron stars, whose surface may produce copious thermal X-ray photons, and those of very old recycled millisecond pulsars, in which thermal hot-spot and non-thermal magnetospheric X-ray production mechanisms are believed to dominate. Old, non-recycled pulsars (outside globular clusters) therefore aid in answering questions such as how do the emission properties of the younger pulsars, like Geminga, PSR B0656+14 and PSR B1055-52, change as they age from to years? Will the thermal emission simply fade away due to cooling with increasing age or will the star be kept hot (at about K) over millions of years due to energy dissipation by processes such as internal frictional heating ( erg/s) and crust cracking, as proposed by vortex creeping and pinning models? What happens to the non-thermal, hard-tail emission seen in the X-ray spectra of the middle-aged field pulsars? (See e.g. Saito 1988; Becker & Aschenbach 2002; De Luca et al. 2005). Will this emission become the dominant source or will this component also decay with time and will only thermal emission from the hot and heated polar-caps remain?
In order to address these questions, we initiated a program to study the X-ray emission properties of old rotation-powered pulsars with XMM-Newton, aiming to probe and identify the origin of their X-ray radiation. First results from parts of this project have been presented recently, reporting on the pulsars B0950+08, B0823+26, J2043+2740 (Becker et al. 2004; Zavlin & Pavlov 2004) and PSR B0628-28 (Becker et al. 2005) all of which have a spin-down age in the range from about one million to seventeen million years.
If one extrapolates the X-ray emission properties of young and cooling neutron stars to this age bracket, one may expect that the cooling emission fades away and thermal emission from heated polar caps dominates the X-rays. Surprisingly, the X-ray emission from old pulsars is largely dominated by non-thermal radiation processes. None of the pulsars’ X-ray spectra required the addition of a thermal component, consisting of hot polar cap emission, to model their energy spectra. Further support for an emission scenario dominated by non-thermal mechanisms is given by the observed temporal emission properties. The pulse profiles of PSRs B0950+08 and B0628-28 are not broad and sinusoidal as would have been expected for spin-modulated thermal X-ray emission from heated polar caps, but are double peaked with narrow pulse components and pulsed fractions in the range of .
Some models, such as those by Harding & Muslimov (2001; 2002; 2003), predicted in the framework of their revised space-charge-limited flow model that polar cap heating, as a fraction of the spin-down luminosity, increases with pulsar age and should be most efficient for pulsars of spin-down age yrs, if they are in fact producing pairs from curvature radiation photons. However, according to the Harding & Muslimov model, B0950+08 and B0823+26 cannot produce pairs from curvature radiation of primary electrons since they both lie below the curvature radiation pair death line in the - diagram of radio pulsars (cf. Becker et al. 2004 for a more detailed discussion).
A good candidate object to test these models is PSR B192910 which according to its X-ray emission properties can be considered to be prototypical of an old pulsar. With a pulse period of ms and a period derivative of , its characteristic age is determined to be years. These spin parameters imply a spin-down luminosity of and a magnetic field at the neutron star magnetic poles of G. With a radio dispersion measure of , the NE2001 Galactic free electron density model of Cordes & Lazio (2002) predicts a distance of 170 pc. However, the recent astrometric measurements by Chatterjee et al. (2004) yielded a precise proper motion and parallax determination that translates into an accurate distance measurement of pc and a transverse speed of km s-1.
Thus, PSR B192910 is among the closest pulsars known. In addition to its relatively young age it appears to be the brightest among all old non-recycled X-ray detected rotation-powered pulsars. Its X-ray emission was discovered with the EINSTEIN observatory by Helfand (1983). Pulsed X-ray emission was discovered using a deep ROSAT observation (Yancopoulos et al. 1994). The pulse profile was found to be very broad with a single pulse stretching across the entire phase cycle, markedly different from the sharp peak observed in the radio band. The fraction of pulsed photons in the keV band was determined to be . The ROSAT data were not able to constrain the nature of the pulsar emission as a blackbody spectrum (representing thermal polar-cap emission) and a power law model (representing non-thermal magnetospheric emission) fitted the data equally well (Becker & Trümper 1997). Similar results were obtained in the analysis of ASCA spectral/timing data by Wang and Halpern (1997) and Saito (1998). The broad sinusoidal pulse profile together with the higher column absorption of deduced from power law fits were taken as indirect arguments and strong indicator for a thermal polar-cap origin of the X-rays222Fitting a blackbody model resulted in a column density of which was believed to be in better agreement with the close pulsar distance of pc as believed at that time..
In contrast, Slowikowska et al. (2005) recently found that a single blackbody spectral model cannot describe the pulsar spectrum if the ROSAT and ASCA observed spectra are modeled in a joint analysis. In their work it is shown that a single power law model or a composite model consisting of a two component blackbody spectrum can successfully describe the energy spectrum up to keV. The higher column density fitted by these models is found to be in agreement with that observed for other sources located near to the pulsar’s line of sight and at comparable distances (Slowikowska et al. 2005).
Regardless of the nature of its X-ray emission, PSR B192910 seems to be special for its extended X-ray emission which was discovered by Wang, Li & Begelman (1993) in their archival study of the Galactic soft X-ray background using deep ROSAT PSPC images. They found that the orientation of the diffuse X-ray emission is almost aligned with the pulsar’s proper motion direction, suggesting an interpretation in terms of an X-ray emitting trail behind the pulsar. If indeed associated with the pulsar, the trail could account for of the pulsar’s spin-down luminosity although the effective brightness may depend strongly on the density of the ambient interstellar matter. In recent years, the lack of confirmation of the trail from a subsequent ksec deep ROSAT HRI observation casts some doubt on its existence.
Near-UV emission from PSR B192910 has been detected in three partly overlapping spectral bands using the Hubble Space Telescope’s Faint Object Camera (Pavlov et al. 1996) and the NUV-MAMA detector (Mignani et al. 2002). The nature of the optical emission is uncertain since the paucity of color information makes any spectral fit based on the optical data only merely tentative.
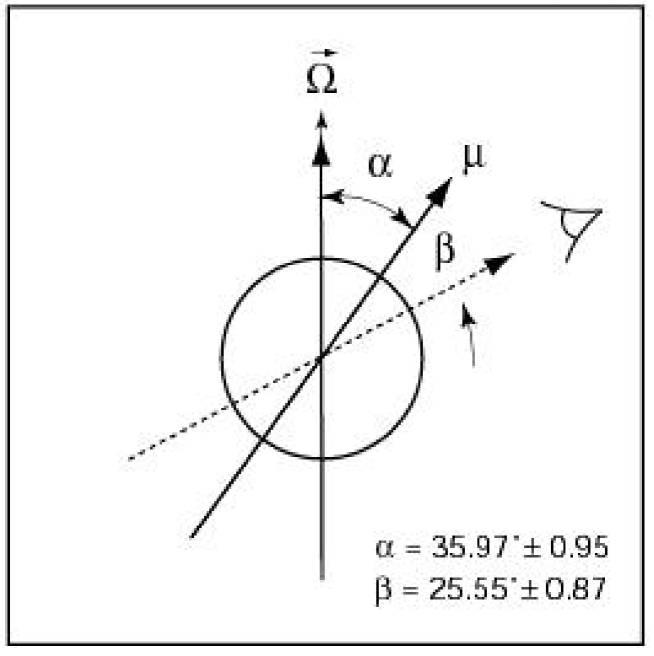
PSR B192910 has also been extensively observed at radio frequencies. The main peak of the radio profile, although much smaller than the X-ray pulse, has a substructure which can be modeled by six separate components (Kramer et al. 1994). Low-level emission connects this main pulse with an interpulse about 180 deg in longitude apart (see e.g. Everett & Weisberg 2001). The pulsar’s viewing geometry has been studied by many authors via the observed polarization angle swing, applying a rotating vector model. Everett & Weisberg (2001) reviewed the various results and concluded that both, the main and interpulse, are produced by nearly aligned rotation and magnetic axes and are emitted from nearly opposite sides of a wide, hollow cone. They derive an inclination of the magnetic axis with the spin axis of while the impact angle of the line of sight was determined to be (cf. Fig.1).
In this paper we report on X-ray, optical H-alpha and radio observations of PSR B192910 which were made with XMM-Newton, the ESO New Technology Telescope (NTT) in La Silla (Chile) and the Jodrell Bank Radio Observatory in order to explore the spectral and timing emission properties of this interesting pulsar and its environment. The paper is organized in the following manner: in §2 we describe the radio, optical H-alpha and XMM-Newton observations of PSR B192910 and its X-ray trail and provide the details of the data processing and data filtering. The results of the spatial, spectral and timing analysis are given in §3. A summary and concluding discussion is presented in §4.
2 OBSERVATIONS AND DATA REDUCTION
2.1 RADIO OBSERVATIONS OF PSR B192910
The ephemerides for the analysis of the X-ray data were obtained from radio observations and the measurement of pulse times–of–arrival (TOAs) using the 76-m Lovell radio telescope at Jodrell Bank Observatory. Table 1 summarizes the radio ephemerides of PSR B192910. A dual-channel cryogenic receiver system sensitive to two orthogonal polarizations was used predominantly at frequencies close to 1400 MHz. The signals of each polarization were mixed to an intermediate frequency, fed through a multichannel filter-bank and digitized. The data were de-dispersed in hardware and folded on–line according to the pulsar’s dispersion measure and topocentric period. The folded pulse profiles were stored for subsequent analysis. In a later off–line processing step, any sub-integrations corrupted by RFI were removed, the polarizations combined and the remaining sub-integrations averaged to produce a single total–intensity profile for the observation. TOAs were subsequently determined by convolving, in the time domain, the averaged profile with a template corresponding to the observing frequency. The uncertainty on the TOA was found using the method, described by Downs & Reichley (1983) which incorporates the off–pulse RMS noise and the ‘sharpness’ of the template. These TOAs were transferred to an arrival time at the solar system barycenter using the Jet Propulsion Laboratory DE200 solar system ephemeris (Standish 1982). More details can be found in Hobbs et al. (2004). Spectral data from PSR B192910 were obtained from the compilation of Maron et al. (2000).
2.2 OPTICAL OBSERVATIONS OF PSR B192910
We have performed optical Hα and R-band observations of the arcmin sky region around PSR B192910 using the SUperb-Seeing Imager (SUSI2) at the focus of the ESO New Technology Telescope333See http://www.ls.eso.org/lasilla/sciops/ntt/index.html for a description of the ESO NTT and its instrumentation. in La Silla (Chile).
19 exposures of 600 s each (3.2 hours total integration time) have been taken on July, 18 and 20 2004 through the Hα filter (central wavelength ; ). Additional 15 shorter exposures of s in the R-band filter (central wavelength ; ) were taken in order to discriminate Hα line emission from the continuum. In order to compensate for the gap between the two SUSI2 CCD chips, the exposure sequences were taken with a jitter pattern with typical offset steps of in RA. All observations have been performed with average airmass of 1.35, clear sky conditions and good seeing (). Single exposures were corrected for the instrumental effects (bias and dark subtraction, flat-fielding), cleaned of bad columns and of cosmic rays hits through median filter combination. To account for the uneven exposure map due to the jitter pattern, both the final Hα and R-band images were exposure-corrected.
The image astrometry was recomputed using as a reference the positions of a number of stars selected from the Guide Star Catalogue II (GSC-II), which has an intrinsic absolute astrometric accuracy of per coordinate444http://www-gsss.stsci.edu/gsc/gsc2/GSC2home.htm. The pixel coordinates of the reference stars have been computed by a two-dimensional Gaussian fitting procedure, and transformation from pixel to sky coordinates was then computed using the programme ASTROM555http://star-www.rl.ac.uk/Software/software.htm, yielding an rms of 008 in both Right Ascension and Declination, which we assume representative of the accuracy of our astrometric solution.
2.3 XMM-NEWTON OBSERVATIONS OF PSR B192910
PSR B192910 was observed by XMM-Newton666For a description of XMM-Newton, its instrumentation and the various detector modes available for observations see http://xmm.vilspa.esa.es/. as part of the European Photon Imaging Camera (EPIC) guaranteed time program. Observations were performed on 2003 November 10 (XMM rev. 718) with a duration of ksec and five months later on 2004 April 27 (XMM rev. 803) and April 29 (XMM rev. 804) for a duration of ksec and ksec, respectively. In all three observations the EPIC Positive-Negative charge depleted Silicon Semiconductor (PN camera) was used as the prime instrument. The two Metal Oxide Semiconductor cameras (MOS1 & MOS2) were operated in PrimeFullWindow mode to obtain imaging and spectral data. The EPIC-PN camera was set up to operate in SmallWindow read-out mode which provides imaging, spectral and timing information with a temporal resolution of 5.67 ms which is more than sufficient to resolve the 226 ms period of PSR B192910. The SmallWindow mode was preferred over other EPIC-PN imaging modes because of its higher temporal resolution, albeit its higher dead-time caused a decrease in the net exposure by . The medium filter was used for the EPIC-PN and MOS1/2 cameras in all observations to block optical stray light. Given the target flux, both the RGS and optical monitor are of limited use. A summary of exposure times, instrument modes and filters used for the X-ray observations of PSR B192910 is given in Table 2.
XMM-Newton data have been known to show timing discontinuities in the photon arrival times with positive and negative jumps of the order of one to several seconds (Becker & Aschenbach 2002; Kirsch et al. 2004). While an inspection of the data processing log-files reveals that none of the EPIC-PN data taken from PSR B192910 exhibit such discontinuities, we nevertheless used a release track Version of the XMM-Newton Standard Analysis Software (SAS) version 6.5 (released in August 2005) to process the EPIC-PN data. This software detects and corrects most of the timing discontinuities during data processing. In addition, known timing offsets due to ground station and spacecraft clock propagation delays are corrected by this software in using newly reconstructed time correlation (TCX) data (cf. Becker et al. 2006). Barycenter correction of the EPIC-PN data and all other analysis steps were performed by using SAS Version 6.1. Data screening for times of high sky background was done by inspecting the light-curves of the EPIC-MOS1/2 and PN data at energies above 10 keV. Apart from having a rather high sky background contribution in both April observations, very strong X-ray emission from soft proton flares is covering about half of these April data sets. The data quality of the shorter November 2003 observation is not reduced by these effects.
Using light-curves with 100 s bins, we rejected time intervals where the MOS1/2 had more than 130, 140 and 175 cts/bin in the 2003 November, 2004 April 27 and 29 observations, respectively. For the EPIC-PN data sets, we rejected times with more than 7, 12 and 40 cts/bin. The data screening reduced the effective exposure time for the MOS1/2 and PN-camera to a total of 64 ksec and 23.8 ksec, respectively.
For the spectral analysis based on the MOS1/2 data we used only those events with a detection pattern between (i.e. single, double and triple events) and the flag parameter set to less than, or equal to, 1. The latter criterion excludes events which are located near a hot pixel, or a bright CCD column, or which are near the edge of the CCD. For the EPIC-PN timing and spectral analysis, we used only single and double events, i.e. those which have a pattern parameter of less than, or equal to, 4 and a flag parameter equal to zero. The energy range of the MOS1/2 and EPIC-PN CCDs was restricted to keV for the spectral analysis due to calibration issues towards softer spectral channels and to keV for the timing analysis.
3 ANALYSIS OF THE MULTI-WAVELENGTH DATA OF PSR B192910
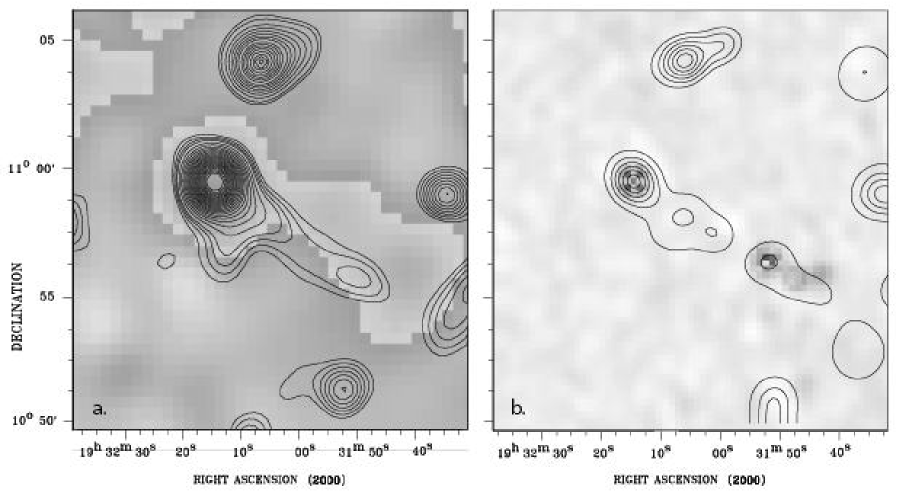
The X-ray counterpart of PSR B192910 is detected with high significance in both the MOS1/2 and EPIC-PN data. The count rates are cts/s (MOS1/2) and cts/s (EPIC-PN) within the keV band. Inspection of the MOS1/2 and EPIC-PN images revealed diffuse extended emission at the position of the putative X-ray trail seen in the ROSAT data by Wang, Li and Begelman (1993). Figure 2 shows the MOS1/2 image made with the 2003 November and 2004 April data. Contour lines indicate the diffuse X-ray trail lying in the direction opposite to the transverse motion of the pulsar ( mas yr-1 and mas yr-1, Chaterjee et al. 2004). Contour lines, obtained from a re-analysis of 45 ksec ROSAT PSPC and 350 ksec ROSAT HRI observations, are overlaid. Owing to a sensitivity ratio between the PSPC and HRI of up to a factor of (depending on the source spectrum) and a much higher detector noise the faint trail like emission is much harder to detect in the HRI data. Only after applying an adaptive kernel smoothing procedure a source structure which matches with the shape of the trail seen in the PSPC and MOS1/2 images becomes visible in this data. An interesting difference, though, is that in the HRI data the trail seems to break up into two separate pieces. In the MOS1/2 images this region is partly covered by a CCD gap. The angular resolution of the ROSAT detectors are 25 arcsec in the PSPC and 5 arcsec in the HRI, respectively, while that of XMM-Newton is 15 arcsec (Half Energy Width).
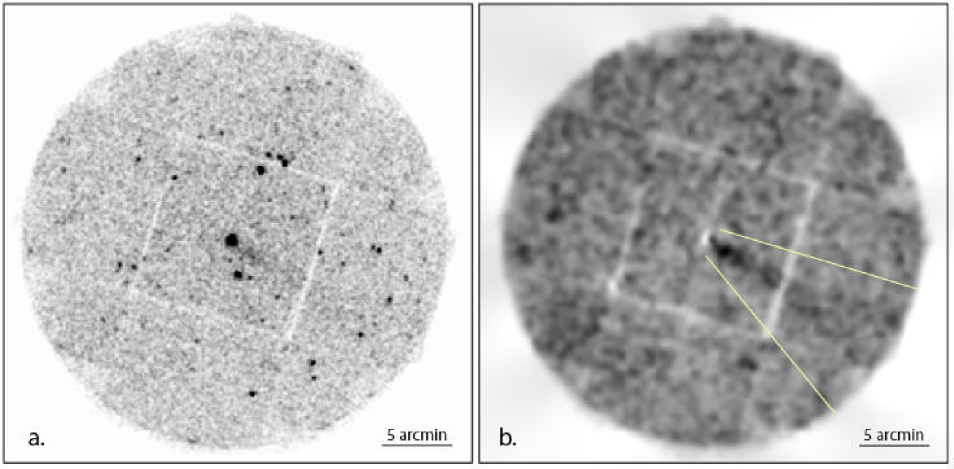
Inspecting the MOS1/2 full field of view (cf. Figure 3a) there is some indication for trail emission beyond the edge of the inner MOS CCD. To reduce the impact on the trail detection due to the presence of other X-ray point sources in the field (though no bright sources are located along the trail) we have removed point source contributions from the MOS1/2 data and corrected the image for telescope vignetting effects. The result is displayed in Figure 3b. Clearly, there is a whiff of emission which probably extends down to the edge of the detector’s field of view, but its significance at locations more distant from the pulsar is gradually fading into the background. In order to estimate the significance of the emission along the tail we extracted four circles at increased distance from the pulsar, at 1.5’, 4.5’, 7.5’, and 10.5’, respectively. The significance of the trail emission in these circles is computed to be (C1): , (C2): , (C3): , and (C4): , where scts and bcts denote the source counts and background counts measured for these four circles in the energy band keV.
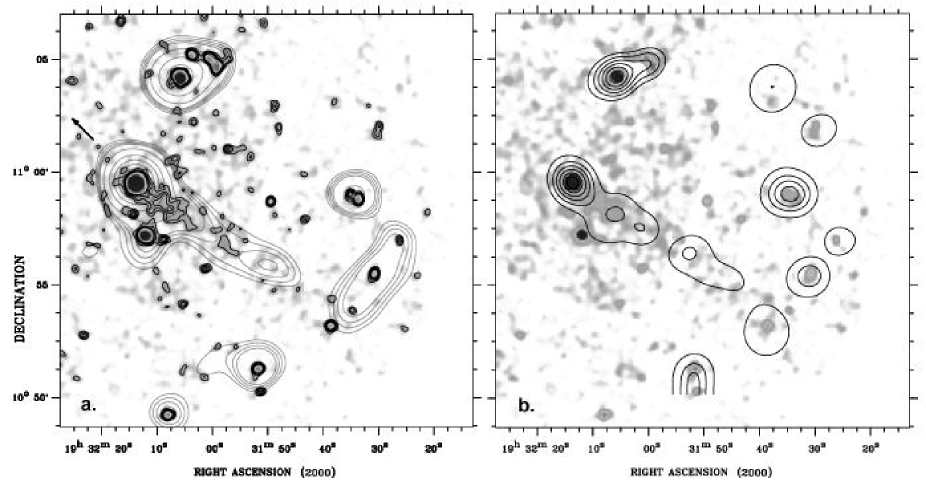
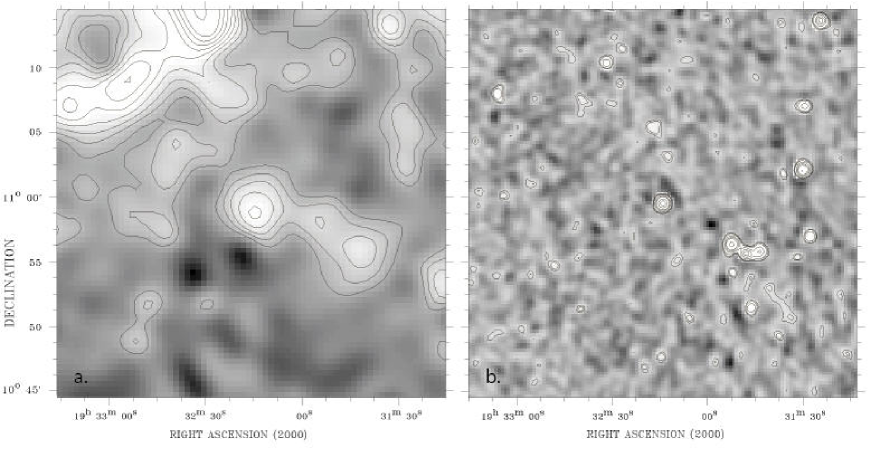
In the first half of the 80s the Effelsberg 100-m radio telescope has mapped the entire Galactic Plane in the latitude range at 11 cm wavelength (Reich et al. 1990). Inspecting this data for a possible radio counterpart of the pulsar’s X-ray trail we discovered an elongated feature which roughly matches with that observed in the X-ray band. Figure 4a shows the arcmin region centered on PSR B192910 as observed in the 11 cm Effelsberg survey. The extracted map has 140 x 140 pixels. Its resolution (HPBW) is 4.3’ with fluxes ranging from 0 to 250 mKTb (1 mKTb = 0.398 mJy). The rms of the survey was given as 20 mKTb (= 8 mJy). In the vicinity of the source we found a diffuse background of 25 mJy. The pulsar itself was evident with 25 mJy above the local background level. The radio tail was visible with fluxes of up to 15 mJy above local background and unresolved in the transverse direction. The tail was not aligned with the low level residual scanning effects. The distance to the bright node on the tail was found to be 8.8’, but more aligned features were visible further in the beam out to 12’. In order to estimate the probability of a spurious detection we derived a probability of a pixel exceeding 34 mJy as from a histogram of all pixels in our map. We made another histogram from a 33’ (78 pixel) line along the tail direction from the pulsar, excluding the first 6’ of the point source. 18 of the remaining 64 pixels were found to be above 34 mJ. The binominal distribution gives a probability of for a random occurrence of such a result along an arbitrary line of similar length in our map. Using the resolution (4.3’) for a conservative estimate of the tail width, we find that the probability of a random alignment in the direction of proper motion is about . Hence the probability of a coincidence of weak random radio sources with the observed psr tail is about
Nevertheless, inspecting the NRAO VLA Sky Survey (NVSS) which is a 1.4 GHz continuum survey mapping the entire sky north of -40 deg declination (Condon et al. 1998) we found faint not fully resolved radio sources which match in position with the brighter end of the radio tail seen at 11cm (2.72 GHz). There is no radio emission seen bridging the pulsar and these faint sources, however, this absence is likely a function of the VLA telescope configuration which affects the sensitivity of the observations to diffuse emission. The NVSS image has an angular resolution of 45 arcsec (FWHM) and is shown in Figure 4b. An elongated emission feature seen at RA(2000) 19h 31m 36s, DEC +10d 51’ 54”, and thus still located within the segment indicated in Figure 3b, roughly lines up with the pulsar’s proper motion direction. Making use of such an alignment to claim a relation with PSR B192910, however, seems premature. As there are other bright sources in the 11cm Effelsberg data which are not seen in the NVSS image (e.g. the bright circularly shaped source located in the north-east of Figure 4a) the NVSS data cannot help to constrain the nature of the elongated radio feature seen at 11cm. A comparison of the Effelsberg and NVSS radio images with the ROSAT PSPC and HRI X-ray images is shown in Figure 5. Interestingly, the part of the tail which in the HRI appears to be separated from the pulsar matches with the position of the three not fully resolved radio sources in the NVSS, suggesting that both could be related.
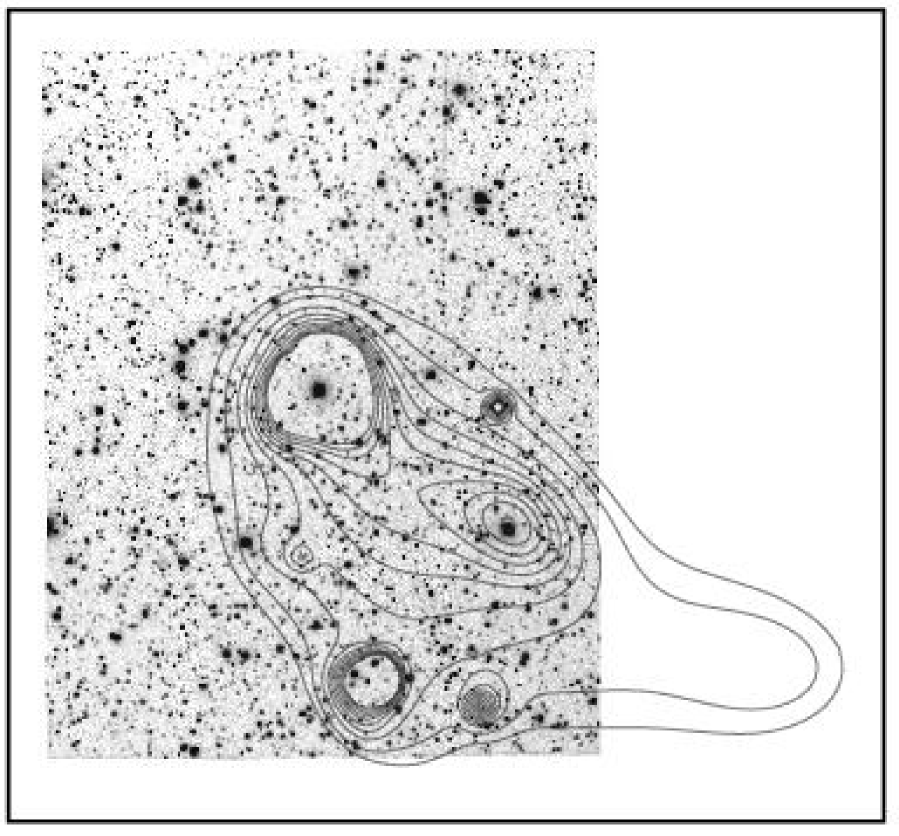
The NTT Hα image which shows the arcmin sky region around PSR B192910 is shown in Figure 6. Contour lines from the MOS1/2 image are overlaid. The inspection of the Hα image and of the ratio of the Hα to -band images does not reveal any diffuse structure that could be related to the brighter parts of the pulsar’s X-ray trail. We performed a rough flux calibration of the Hα image by computing the Hα fluxes corresponding to the R magnitudes of a sample of GSC-II stars which are included in the field assuming blackbody spectra with the appropriate stellar temperatures. We then derived the relation between the instrumental magnitude and the Hα fluxes. A flux upper limit of in the Hα band can be set for the sky region around the pulsar.
As can be seen in Figure 6, there is a bright star near to the position of PSR B192910. A second bright star seems to coincide with the brighter part of the trail near to the pulsar. In view of the density of stars in the observed field the chance probability to have a star near to the position of an X-ray source is quite high. We investigated therefore whether these stars contribute to the flux recorded from PSR B192910 and the brighter part of its trail. The bright star close to PSR B192910 has been identified to be of K(4-6)III-I type (Kouwenhoven & van der Berg 2001) and has a magnitude in B and R of and , respectively. The bright star within the trail is possibly of K2-4 class and according to the GSC-II and the 2MASS catalogues has B, R, J and K magnitudes of and , respectively. With (Krautter et al. 1999), we find for a mekal plasma model with kT=0.35, solar abundances, and a column absorption of a possible contribution from these stars to the soft channels in XMM-Newton of . Given the very large spread in the emission properties of K stars and taking its colors into account the star near to PSR B192910 is possibly a bright giant, and thus could lie towards the lower end of the range (e.g. Zickgraf et al. 2005) which then would imply a negligible flux contribution in the pulsar extraction region. As far as the pulsar’s X-ray trail is concerned it is clear from its length and from its hard X-ray spectrum (cf. §3.2.3) that this trail is not due to unresolved foreground or background sources.
3.1 TIMING ANALYSIS
We used all the EPIC-PN SmallWindow mode data for the timing analysis, including those times of high sky background which were excluded for spatial and spectral analysis. Experience has shown that this does not affect the results from the timing analysis if the sky background is properly taken into account in all pulsed-fraction estimates.
Events were selected from a circle of 20 arcsec radius centered on the pulsar radio timing position (cf. Table 1). For the barycenter correction we applied the standard procedures for XMM-Newton data using barycen-1.17.3 and the JPL DE200 Earth ephemeris (Standish 1982) to convert photon arrival times from the spacecraft to the solar system barycenter (SSB) and the barycentric dynamical time (TDB). The pulsar radio timing position (cf. Table 1) was used for the barycenter correction. The spin-parameters and of PSR B192910 are known with high precision from our contemporaneous radio observations, covering all XMM-Newton orbits relevant for our analysis. PSR B192910 is not known to show timing irregularities (glitches) so that we can fold the photon arrival times using the pulsar’s radio ephemeris. The statistical significance for the presence of a periodic signal was obtained from a -test with harmonics in combination with the H-Test to determine the optimal number of harmonics (De Jager 1987; Buccheri & De Jager 1989). The optimal number of phase bins for the representation of the pulse profile was determined by taking into account the signal’s Fourier power and the optimal number of harmonics deduced from the H-Test (see Becker & Trümper 1999 and references therein).
Within the keV energy band, 5736 events were available for the timing analysis of which are estimated to be instrument and sky background. The -test gave 82.14 for harmonics (). According to the H-Test, the probability of measuring by chance is . The significance of the pulsed signal thus is comparable with that found recently in the other old pulsars B0950+08 (Becker et al. 2004) and PSR B0628-28 (Becker et al. 2005).
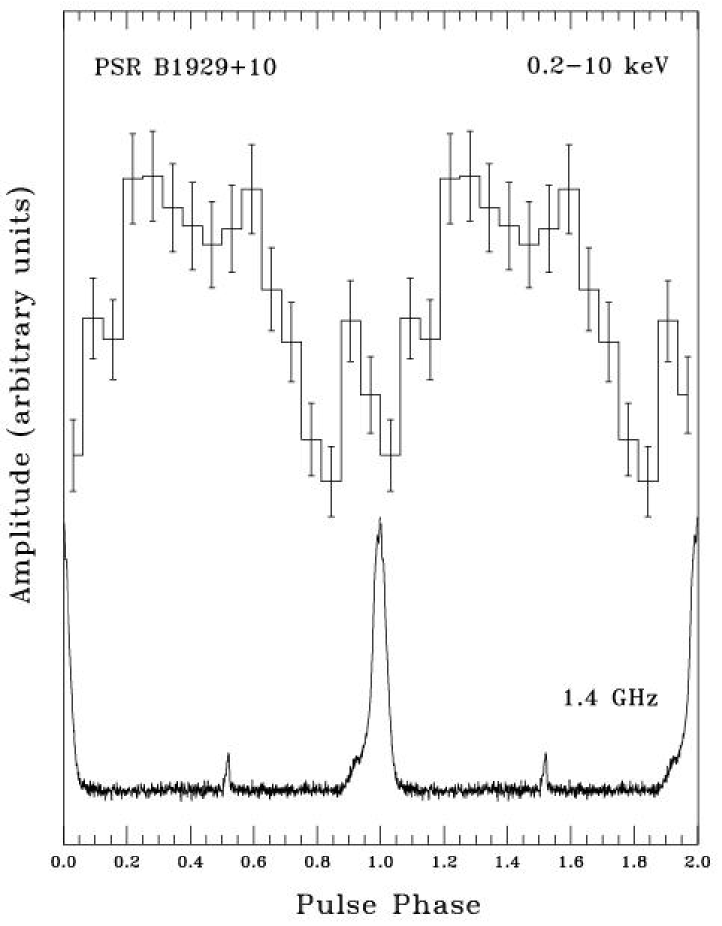
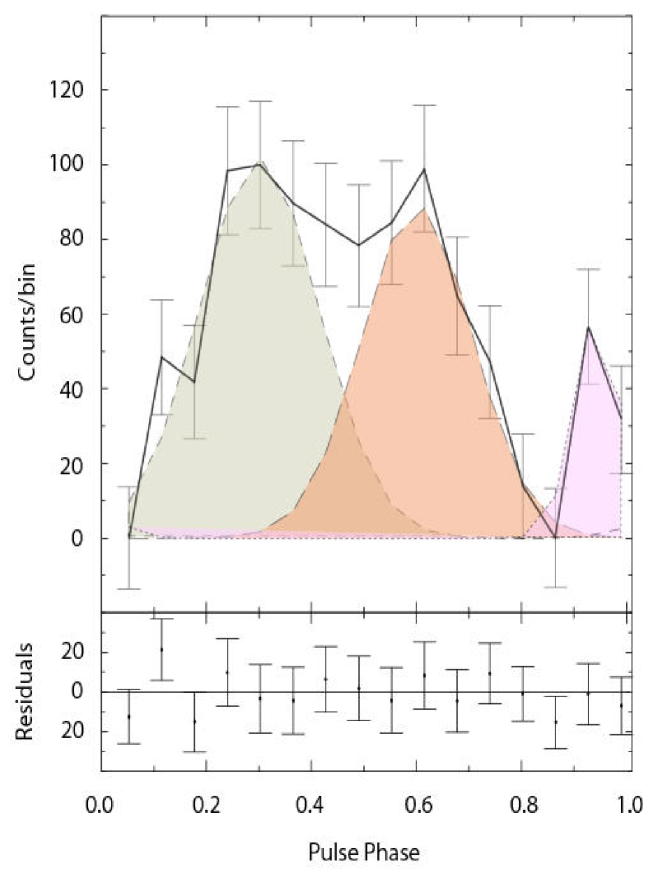
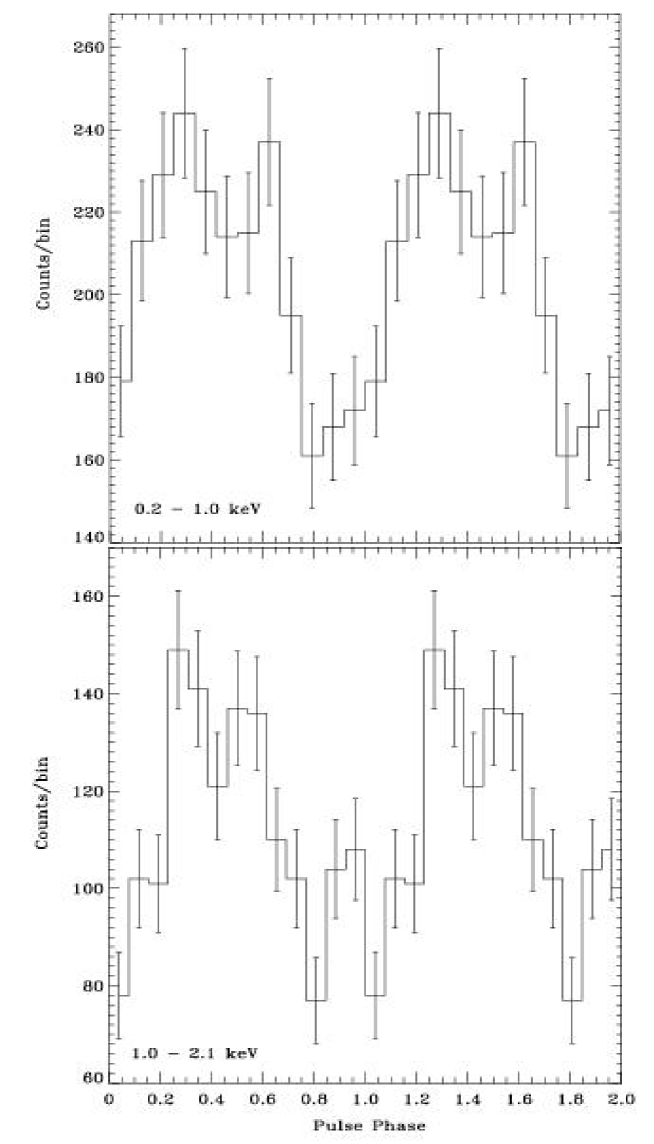
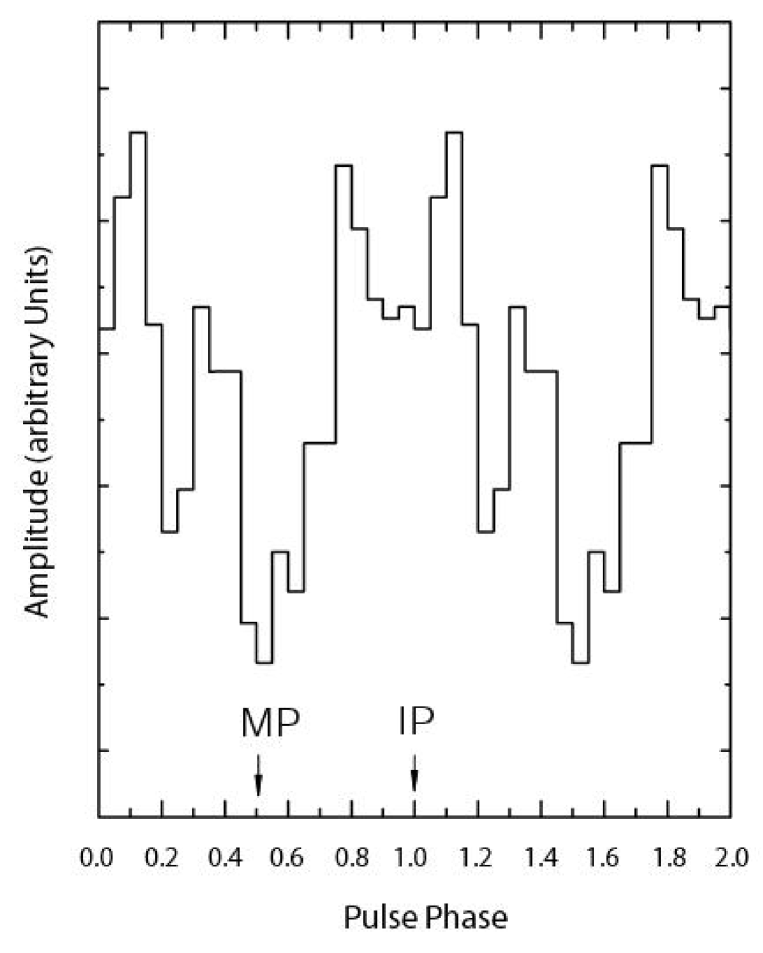
The keV pulse profile is shown together with a radio profile observed at 1.4 GHz in Figure 7. It reveals a significant deviation from a sinusoidal pulse shape. The X-ray pulse profile is found to consist of at least two pulse peaks, a broader component of width, plus a narrow component of width. Taking the center of mass of the pulse as a reference point, the narrow X-ray pulse appears to be slightly phase shifted (by ) from the location of the main radio peak, although both components overlap well in phase. The broader pulse appears to have substructures hinting the presence of two narrower pulse peaks which are not fully resolved by the available data. Indeed, modeling the profile with three Gaussians yields acceptable results, supporting such an interpretation. The fitted functions together with the post-fit residuals are shown in Figure 8. The centers and widths (FWHM) of each of these three components obtained from the fit are, in pulse longitudes, , , and , respectively. The uncertainty in the center position of each component is estimated as ).
In order to search for any energy dependence in the pulsar’s temporal X-ray emission properties, we restricted the timing analysis to the keV, keV, and keV energy bands. This analysis shows that the pulsed signal appears to be most significant if we consider only events which are recorded at energies below keV. The maximum -values found for the pulsed signal in the three energy bands are , , and , respectively. The fact that the pulsed signal is less significant beyond keV can be explained by an increase of instrumental background along with a decrease of pulsar signal, yielding a lower signal-to-noise ratio compared to the keV and keV energy bands. An inspection of the pulse profiles for these two energy bands reveals that the emission from the narrow pulse peak appears only in the profile beyond keV. Computing the fraction of pulsed photons (pulsed fractions, hereafter), we find for the total keV energy band. The pulsed fractions in the sub-bands keV, keV, and keV are , , and , respectively (errors represent the confidence limits). For the narrow peak which appears at energies keV, the pulsed fraction in the keV band is slightly higher than within the keV band, although the significance for this is at the level only.
Computing the TOAs of the X-ray pulse we note that uncertainties of the XMM-Newton clock against UTCs are not relevant as those are on a scale of (Becker et al. 2005 in prep.) and thus are a factor of smaller than the bin width of the X-ray pulse profile shown in Figure 7. The largest uncertainty from comparing radio with X-ray pulse arrival is the definition of a suitable reference point which we choose to be the center of mass of a pulse peak.
3.2 SPECTRAL ANALYSIS
3.2.1 PSR B192910
The energy spectrum of PSR B192910 was extracted from the MOS1/2 data by selecting all events detected in a circle of 40 arcsec radius, centered on the pulsar position. According to the XMM-Newton/EPIC-MOS model point spread function, of all events of a point source are within this region. The background spectrum was extracted from a source-free circular region of 30 arcsec radius, northwest from the pulsar at RA(2000) , DEC . A second background spectrum was extracted from a circle of the same size but centered east from the pulsar at the position RA(2000) , DEC . This second background spectrum was used to check the independence of the spectral results with respect to the selected background region.
For the EPIC-PN data we used an extraction radius of 30 arcsec centered on PSR B192910. This selection region includes of the point source flux. Out-of-time events and a gradient of decreasing background towards the PN-CCD readout node requires that the background spectrum be selected from regions located at about the same CCD row level as the location of the pulsar. We therefore extracted two background spectra from source-free circular regions of radius 30 arcsec about 1.5 arc-minute east and west of the pulsar position. The spectral results were found to be independent of the specific background region used.
Because of its unique soft response we made use of archival ROSAT PSPC data and extracted the pulsar spectrum from a 60 arcsec circular region in the PSPC. The background spectrum was extracted from an annulus of 70 arcsec and 100 arcsec inner and outer radius, respectively, centered on the pulsar.
In total, the extracted spectra include 2405 EPIC-PN source counts and 1536 EPIC-MOS1/2 source counts. The PN and MOS1/2 spectral data were dynamically binned so as to have at least 30 counts per bin. 462 additional source counts, recorded within keV by ROSAT, were available for the joined ROSAT plus XMM-Newton spectral analysis of PSR B192910. As the energy resolution of the ROSAT PSPC was only at 1 keV (Briel et al. 1989) we binned the ROSAT data so as to have 4 independent spectral bins. Owing to its unique soft response, ROSAT data contribute information primarily to the lowest spectral channels.
Model spectra were then simultaneously fitted to the ROSAT and XMM-Newton pulsar data. An anomaly in the MOS2 spectral data below keV, which probably is related to the MOS redistribution problem in which events from higher energies incorrectly are redistributed downwards (cf. Sembay et al. 2004), required exclusion of those MOS2 spectral bins from the analysis.
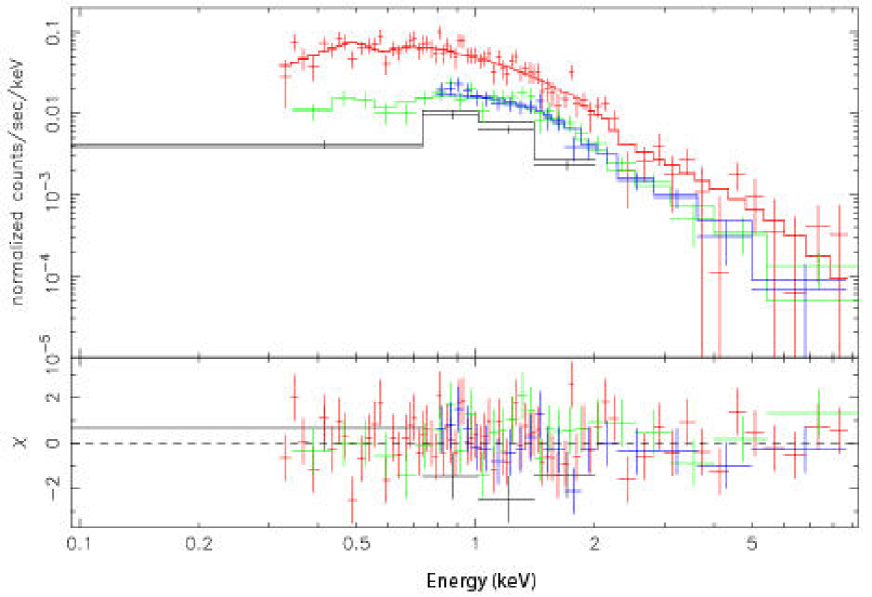
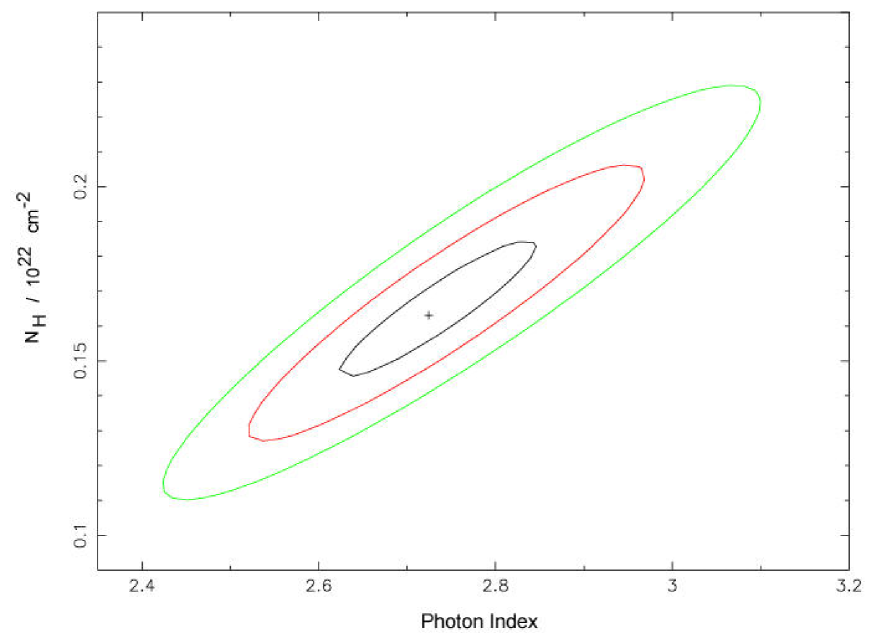
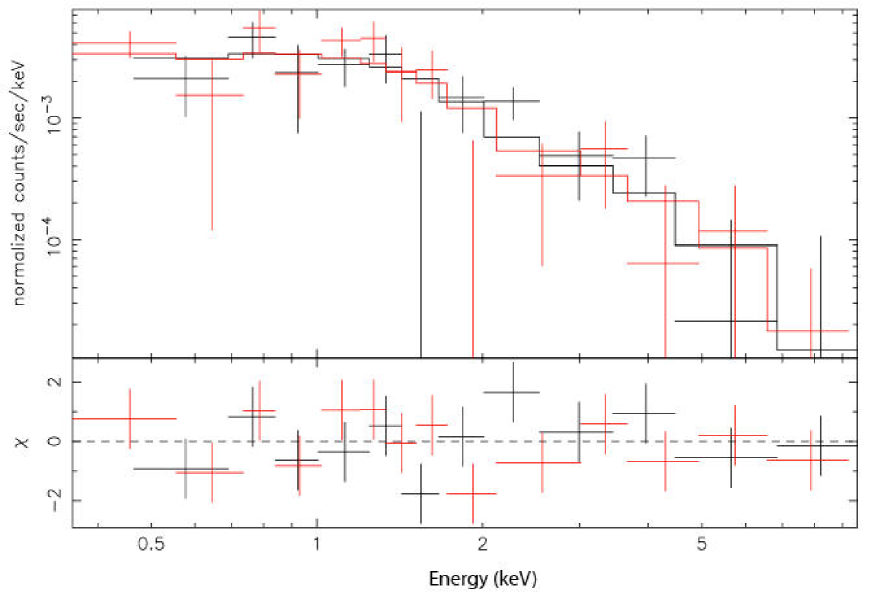
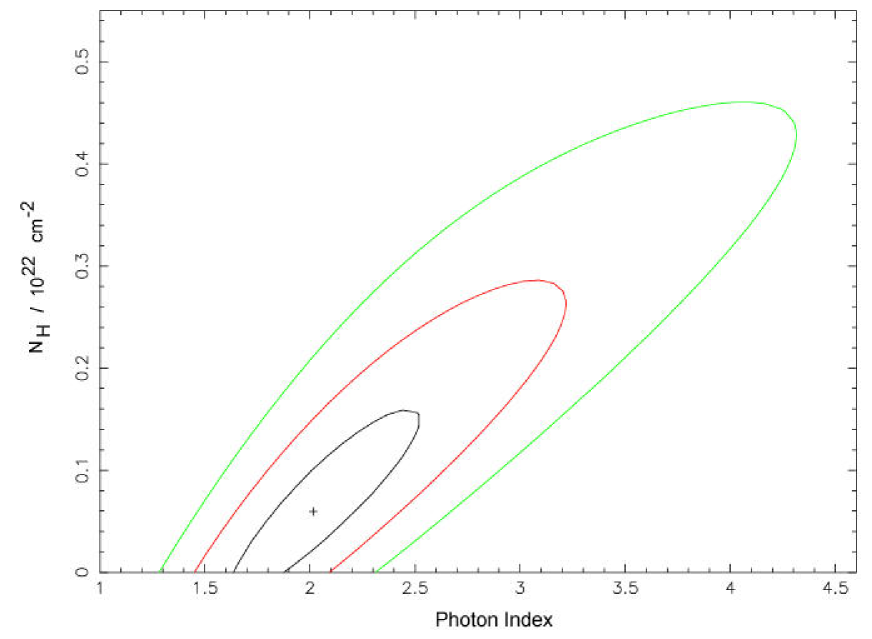
Amongst the single component spectral models, a power law model was found to give the statistically best representation (=119.6 for 121 dof) of the observed energy spectrum. A single blackbody model (=246.9 for 121 dof) which was used by Yancopoulos et al. (1994) and Wang & Halpern (1997) to describe the ROSAT and ASCA observed pulsar spectrum did not give acceptable fits and is finally rejected. The best-fit power law spectrum and residuals are shown in Figure 10. Contour plots showing the relationship between the photon index and the column absorption for various confidence levels are shown in Figure 11.
In the following, we describe various models fitted to the energy spectrum of PSR B192910. The resulting spectral parameters are summarized in Tables 3 and 4 where all errors represent the confidence range computed for one parameter of interest. The power law model yields spectral parameters which are in good agreement with the results obtained by Slowikowska et al. (2005) based on their joint analysis of ROSAT plus ASCA data. The unabsorbed energy fluxes and luminosities (see Table 4) imply a rotational energy to X-ray energy conversion efficiency of within keV and of within the ROSAT band (cf. Becker & Trümper 1997).
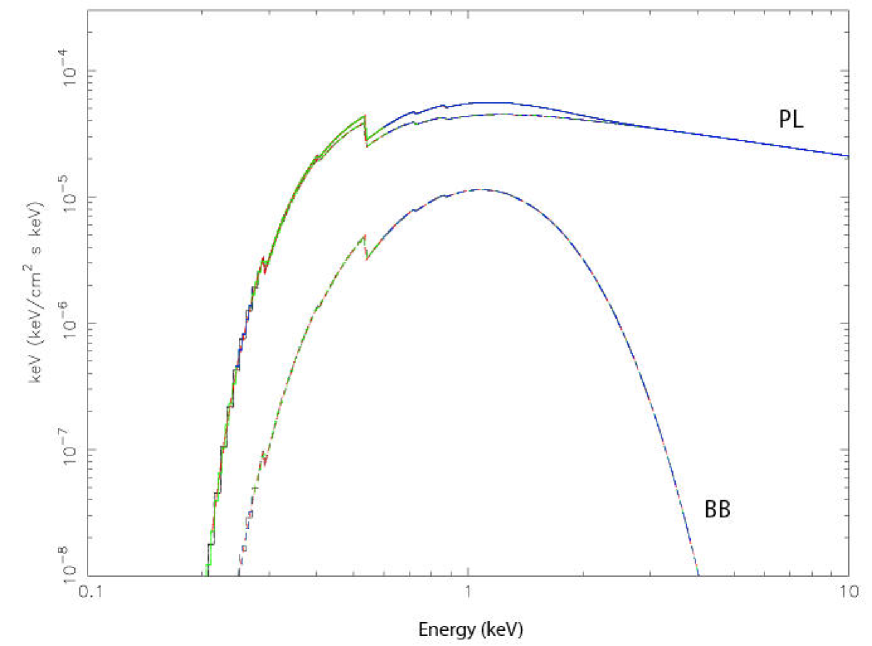
In addition to the single component spectral models we tested two composite models consisting of either a blackbody plus power law component or of two blackbody components, respectively. The first model represents the scenario in which the X-ray emission of PSR B192910 originates from heated polar caps and from magnetospheric radiation processes. The double blackbody model implies that its X-ray emission would be entirely of thermal origin, e.g. with all the X-rays being emitted from heated polar caps with an anisotropic temperature distribution for which the model is approximated by two Planckian spectra with different emitting areas and temperatures.
Clearly, the statistical motivation to include an additional thermal component to the already excellent power law fit is very small. All combinations of blackbody normalizations and temperatures that were fitted gave reduced -values which are not better than the fits to a power law model of the pulsar spectrum. The F-test statistic for adding the extra blackbody spectral component to the power law model, thus, is very low. Based upon the errors of the fitted spectral components all fits of this composite model yield only upper limits for a maximum thermal component which the power law model ”accepts” before the fits become statistically unacceptable. The parameters obtained for the thermal component are thus intrinsically upper limits. The fitted parameters are shown in Tables 3 and 4. The resulting blackbody temperature and the size of the projected emitting area are keV and m, assuming a pulsar distance of 361 pc.
In computing the relative contributions of the thermal and non-thermal spectral components and stretching the errors to the limits for the composite blackbody plus power law model, we find that no more than of the detected X-ray flux could come from heated polar caps. For the best fit parameters only could be emitted from these caps. However, the radius of m which we computed for the maximum projected emitting area is not too different from the expected size of a polar cap. For comparison, defining the size of the presumed polar cap as the foot points of the neutron star’s dipolar magnetic field, the radius of the polar cap area is given by with being the neutron star radius, c the velocity of light and P the pulsar rotation period (see e.g. Michel 1991). For PSR B192910 with a rotation period of 226 ms this yields a polar cap radius of . A plot of the thermal and non-thermal spectral components and the combined model is shown in Figure 12.
With a spin-down age of years PSR B192910 should still have some residual heat content from its birth event. Depending on the equation of state the surface temperature could still be in the range K (cf. Becker & Pavlov 2001 and references therein) and could contribute on a low level to the detected soft X-ray emission. To estimate the upper limit for the surface temperature of PSR B192910 we have fixed the blackbody normalization so that the emitting area corresponds to the surface of a km neutron star and calculated the confidence ranges of the blackbody temperature by leaving all other parameters free. We find a surface temperature upper limit of K which is somewhat above the temperatures predicted by cooling models (e.g. Page & Applegate 1992; Tsuruta 1998; Yakovlev et al. 1999) and, thus, may constrain only those thermal evolution models which predict extreme reheating.
The spectral model consisting of two thermal components describes the observed spectrum formally with comparable goodness of fit as the blackbody plus power law model. In comparison with a single blackbody fit the F-test statistic thus supports an addition of a second thermal component to the single blackbody model. However, inspection of the fit residuals shows that the double blackbody model falls off rapidly beyond keV which causes the residuals beyond that energy to systematically lie above the zero line, albeit error bars are large. The fitted model parameters are a column absorption of , temperatures , , and projected emitting areas and , respectively.
3.2.2 PHASE RESOLVED SPECTRAL ANALYSIS
In order to investigate a possible variation of the pulsar emission spectrum as a function of pulse phase we selected the events from phase intervals and from (cf. Fig.7) for a spectral analysis. The source counts are from a circle of radius centered on the target coordinates (the extraction region was smaller than the one used for the phase-integrated case in order to improve the signal-to-noise in the lower-statistics phase-resolved spectra). The spectra were binned in order to have at least 30 counts per channel. Allowing both the and the photon index to vary we obtained for the phase cm-2, , (; 44 dof) and for cm-2, (, 36 dof). Fixing the interstellar column to the phase-averaged value, the best fit values for the photon indices are (, 45 dof) and (, 37 dof) for the peak and off-pulse, respectively. Using composite (blackbody + power law) models for both and did not yield better results. Within the statistical uncertainties there are therefore no spectral changes observed as a function of pulse phase.
3.2.3 Diffuse emission from the X-ray trail of PSR B192910
The large collecting area of XMM-Newton allows, for the first time, a spectral analysis of the emission from the pulsar’s X-ray trail. The satellite roll-angle and the EPIC-PN reduced field of view of arcmin in SmallWindow mode caused only a small portion of the trail to be observed by the PN CCD #4 in the short November 2003 observation. During the April 2004 observations the trail is outside the PNs field of view. Due to the increased instrument background towards the PN’s readout node which is near to the location of the trail region in the CCD #4 we did not include the PN data in the analysis of the diffuse emission. Both MOS cameras have covered a large portion of the trail in all observations (cf. Figure 3) so the analysis was restricted to the MOS1/2 data only.
The photon statistic of the diffuse trail emission is sufficient for a detailed spectral modeling only near to the pulsar. We, therefore, extracted the X-ray spectrum from a circular region of 1 arcmin radius centered at RA(2000) , DEC . The background spectrum was extracted from a source-free region located at RA(2000) , DEC . About 800 counts ( background contribution) were available for the spectral analysis of the diffuse trail emission. We binned the spectrum dynamically so as to have at least 30 counts per bin.
The pulsar’s X-ray trail is likely formed by a ram-pressure confined pulsar wind. Its X-ray emission should arise from synchrotron radiation of relativistic electrons with a spectral shape characterized by a power law. To test this hypothesis we fitted a power law to the extracted trail spectrum and found the model describes the observed spectrum well (=20.4 for 23 dof). The best-fit power law spectrum and residuals are shown in Figure 13. Contour plots showing the relationship between the photon index and the column absorption for various confidence levels are shown in Figure 14. Details of the spectral fits are again listed in Tables 3 and 4. Accordingly, the 1 arcmin size portion of the diffuse nebula radiates into the keV X-ray band and into the keV soft X-ray band.
For a second circular region which is located arcmin behind the pulsar along its proper motion direction we converted the background and vignetting corrected counting rate to an energy flux by assuming that the power law photon index is similar to the one we modeled from region one. This assumption may not be justified. For example, Willingal et al. (2001) found in a detailed spectral analysis of the Crab nebula that its outer regions show the steepest spectrum. This indicates enhanced synchrotron losses of the electrons during their passage from the pulsar to the outskirts of the nebula. It is conceivable that a similar behavior is valid for the electrons radiating in the trail of PSR B192910. The energy fluxes and luminosities we obtain for the second region are upper limits in this respect. For the keV and keV bands we find , and , , respectively, which is .
Wang, Li & Begelman (1993) investigated the trail emission by assuming a synchrotron emission spectral shape for which they simulated a spectrum and compared model predictions vs. ROSAT observed counting rates. Our findings based on a more detailed spectral modeling agree well with their results.
3.3 MULTI-WAVELENGTH SPECTRUM
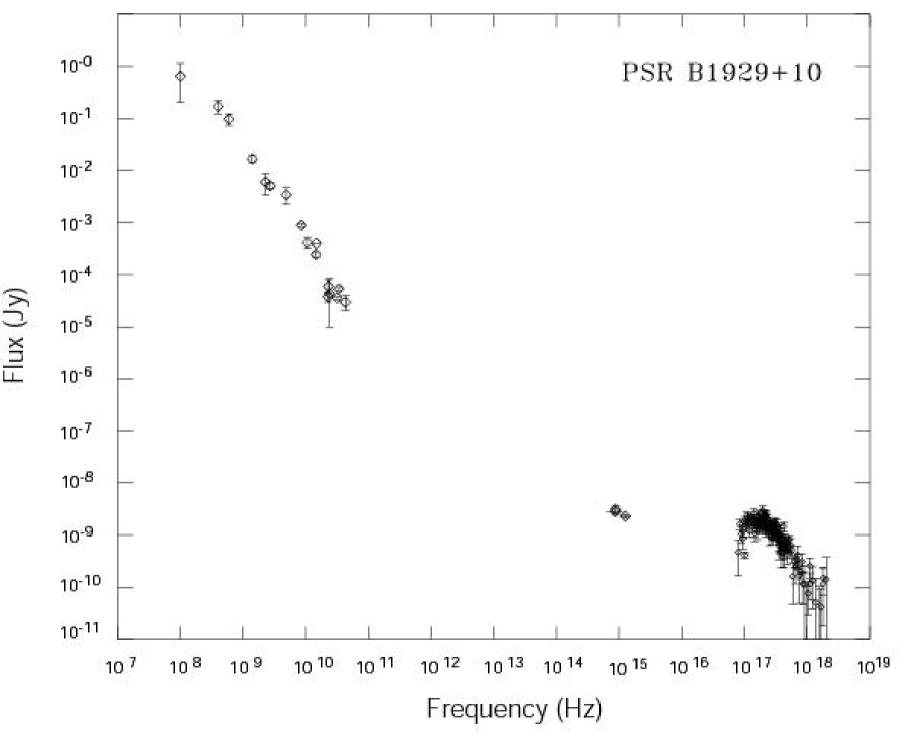
In order to construct a broadband spectrum combining all spectral information available from PSR B192910 we adopted the radio spectrum from Maron et al. (2000) and plotted it in Figure 15 together with the XMM-Newton observed pulsar spectrum and the optical fluxes obtained from the Hubble Space Telescope observations by Pavlov et al. (1996) and Mignani et al. (2002).
PSR B192910 belongs to the small group of pulsars for which radio emission was detected up to 43 GHz (Kramer et al. 1997). The radio spectrum of PSR B192910 is a power law with a photon index of in the frequency range GHz (Maron et al. 2000). Its energy flux at 100 MHz is 950 mJy 600 mJy, but at 43 GHz it is still 0.18 mJy 0.05 mJy (which is slightly more than extrapolated from the lower frequency data). The flux density in the radio part of the spectrum, which should be due to coherent radiation, is therefore several orders of magnitude greater than the extrapolated optical or X-ray flux densities.
Extrapolating the power law spectrum which describes the XMM-Newton data to the optical bands yields a photon flux which exceeds the flux measured in the near-UV bands by more than an order of magnitude. While the pulsar was clearly detected in the U-band (m) and with the F130LP (m) and STIS F25QTZ filters, only an upper limit is available in B (m) (Pavlov et al. 1996; Mignani et al. 2002). This suggests that the broadband spectrum, if entirely non-thermal, has to break somewhere before or in the soft channels of the X-ray spectrum. To test this hypothesis we have fitted a broken power law model to the XMM-Newton and optical data. A broken power law model, with , provides an excellent description (= 121.16 for 120 dof) of both spectral data sets. The photon index for energies below and above the break , is found to be and , respectively (with a normalization of photons cm-2 s-1 keV-1 at 1 keV). The model predicted column absorption value of , somewhat smaller than the single power law model prediction, but is still compatible with our fit to the diffuse trail emission.
4 SUMMARY & DISCUSSION
We have investigated the emission properties of PSR B192910 and its X-ray trail in a multi-wavelength study using XMM-Newton, the ESO New Technology Telescope (NTT) in La Silla (Chile), the Hubble Space Telescope, the Effelsberg 100-m Radio Telescope and the Jodrell Bank Radio Observatory.
In X-rays, PSR B192910 is the brightest pulsar among the old rotation-powered pulsars. Therefore, for about 10 years it was the only member of its class detected in X-rays and for which some details on its emission properties were known – though this picture has been revised thoroughly in our multi-wavelength study of the old rotation-powered pulsars (cf. Becker et al. 2004; 2005).
Clearly, the study of old rotation-powered pulsars is in the domain of XMM-Newton which was designed and built to study faint sources in the X-ray sky. Its sensitivity allowed, for the first time, a more detailed study of this interesting group of pulsars. As for PSR B0628-28 (Becker et al. 2005), PSR B0950+08, PSR B0823+26 and PSR J2043+2740 (Becker et al 2004; Pavlov & Zavlin 2004) recently observed by XMM-Newton, we found the temporal and spectral X-ray emission properties of PSR B192910 to be in excellent agreement with a non-thermal, magnetospheric emission scenario. Its X-ray spectrum is best described by a single power law model with a photon index of . Using the best fit composite Planckian power law model, the contribution from thermal emission of heated polar caps is inferred to be at most . However, a pure thermal emission spectrum consisting of two Planckian spectra is regarded as unlikely. Taking the optical spectral data into account a broken power law with and the photon-index and is able to describe the emission in both spectral ranges entirely in terms of a non-thermal magnetospheric origin.
The X-ray pulse profile observed in the keV band is found to be markedly different from the broad sinusoidal pulse profile seen in the low statistic ROSAT data. Fitting Gaussians to the X-ray light curve indicates the possible existence of three pulse components. A small narrow pulse, characterized by energies greater than 1 keV, is found to lead the radio main pulse by . Two larger pulses, observed in all three energy bands, follow this small pulse. These three pulses are roughly separated by about the same phase cycle (cf. Figure 8). The fraction of pulsed photons in the keV band is . For the sub-bands keV and keV the pulsed fraction is and , respectively, indicating a mild energy dependence at a level.
Various theoretical models have been developed to explain the observed non-thermal high energy emission properties of younger pulsars like those in the Crab and Vela supernova remnants. They all appear to be seen not only in X-rays but also in the gamma-ray band. Can the generic features of these models also explain the emission properties we observe from PSR B192910?
It is commonly believed that the non-thermal X-ray photons are emitted by relativistic charged particles in the pulsar magnetosphere. These relativistic particles could be accelerated in a polar cap region (e.g. Harding 1981; Zhang & Harding 2000) or in the outer-magnetosphere (e.g. Cheng, Ho & Ruderman 1986). In order to calculate the non-thermal spectrum and the energy dependent light curves, the amount of current flow and detailed three dimensional geometry of the accelerator are required. To fix these parameters, gamma-ray data is normally required. However, if the inclination and viewing angles of a specific pulsar are known, the qualitative features of the light curve can be predicted according to the three dimensional magnetospheric models (e.g. Yadigaroglu & Romani 1995; Cheng, Ruderman & Zhang 2000; Dyks, Harding & Rudak 2004).
Everett & Weisberg (2001) have reported from radio polarization data that the inclination and viewing angles of PSR B192910 are and , respectively. For such small inclination and viewing angles, at most two pulses with a phase separation of can be produced if there is only outgoing current. In this case, one pulse arises from a region near one polar cap and another pulse arises from a region near the light cylinder, but associated with another magnetic pole. In Figure 9, the first narrow peak only appears in the band keV and could be associated with a heated polar cap of kT 1keV. However, this is very unlikely by its narrowness as strong gravitational light bending would smear out the thermal pulse from the surface (e.g. Page 1995). Cheng, Ruderman & Zhang (2000) have shown that incoming current must exist from null charge surface to the stellar surface due to pair creation in the outer magnetosphere accelerator.
Here, we can simulate the light curves of PSR B192910 by using its observed inclination and viewing angles, and the three dimensional outer gap model (Cheng, Ruderman & Zhang 2000). Since the radiation is expected to be emitted from open field lines, the coordinate values () of the last closed field lines at the stellar surface must be determined. The coordinate values (), where =, = and =, then represent an open field line surface for a given value of . For simplicity, we choose , which is very close to the first open field lines (). In Figure 16, we show that two large pulses and one small pulse can be simulated. The first large pulse is the result of the incoming current toward the south pole while another pulse is produced by the outgoing current from the north pole. The small pulse is produced by outgoing current near the light cylinder. We note that the phase separation of these three pulses roughly corresponds to the phase separation of the three pulse components observed in the X-ray light curve. Here, the (x,z) plane is chosen to lie at the zero-phase position in Figure 16. On the other hand, in Figure 7, the (x,z) plane should lie in the middle between the two radio pulses. Therefore, the simulated X-ray light curves roughly reproduce the phase relative to the radio pulses within a phase error of about which is well within the observed uncertainties.
THE TRAIL OF PSR B192910
The existence of diffuse emission with a trail morphology lying in the direction opposite to the motion of the pulsar is confirmed in our XMM Newton observation and provides a unique opportunity to probe the pulsar and its environment. The extended diffuse emission associated with this old pulsar (with spin down energy less than ergs s-1) indicates that spin down power is not the sole criterion for its detection. In addition to distance, the detectability may also be dependent on the pulsar’s transverse velocity (see Chatterjee & Cordes 2002). The existence of a possible radio counterpart in the 11 cm Effelsberg data is exciting and, if confirmed in subsequent observations, can provide important information on the trail properties. No diffuse emission from the pulsar trail is detected in perhaps suggesting that the neutral component of the interstellar medium is low (see Chatterjee & Cordes 2002) in the environment surrounding PSR B192910.
Since the trails X-ray emission near to the pulsar has a hard spectrum characterized by a power law photon index of , the emission is non-thermal and is likely to be produced from the synchrotron process of highly relativistic electrons in the shocked region between the pulsar wind and surrounding interstellar medium. A physical description of PSR B192910’s X-ray trail based on the ROSAT findings has been discussed by Wang, Li, & Begelman (1993) in terms of an outflow collimated within the pulsar’s cavity created by its motion.
Alternatively, the properties of the distorted wind nebula can be inferred under the assumption that the electron lifetime due to synchrotron losses, , is comparable to the timescale for the passage of the pulsar over the length of its X-ray trail. Such a hypothesis has also been considered, for consistency, by Caraveo et al. (2003) in their model analysis of a similar X-ray trail observed in the Geminga pulsar. For PSR 1929+10, the angular extent of the trail can not be definitively determined with the present data, but it is likely greater than 4 arcmin. For an assumed distance of 361 pc, the linear scale, , corresponding to this angular scale is greater than about 0.4 pc. An estimate of the flow time, , can be obtained, for the proper motion measured by Chatterjee et al. (2004) and resulting velocity of of 177 km s-1, leading to yrs. This lower limit is about a factor of 2.3 times longer than the comparable timescale found for the Geminga pulsar (see Caraveo et al. 2003). To determine the consistency of our interpretation, the magnetic field in the shocked region can be estimated by equating to . Here yr where is the Lorentz factor of the wind, taken to be equal to , is the Thompson cross section, and is the magnetic field in the emission region in micro gauss. The inferred magnetic field strength in the emitting region is G. Given the magnetic field strength estimates in the interstellar medium (G; see Beck et al. 2003), and the expected compression of the field in the termination shock by about a factor of 3 (Kennel & Coroniti 1984), our estimates for the magnetic field in the emitting region of the pulsar wind nebula are in approximate accord.
The X-ray luminosity and the spectrum of the emitted radiation can be estimated using a simple, one-zone model for the emission nebula powered by the pulsar wind as developed by Chevalier (2000). To determine the characteristic properties of the emission a comparison of the cooling frequency, , for which the electrons can radiate their energy in the pulsar trail, with the observing frequency, is necessary. The cooling frequency can be expressed as . Substitution of the inferred magnetic strength and the electron cooling timescale due to synchrotron radiation yields Hz. Since , the electrons are able to radiate their energy in the pulsar trail and the photon index, , is related to the power law index, , of the electron energy distribution, , in the form . Based on the theoretical work on highly relativistic shocks (Bednarz & Ostrowski 1998, Lemoine & Pelletier 2003), we adopt , yielding . To be consistent with our interpretation of emission taking place in the fast cooling region, the observed value of should exceed 2, which is consistent with the observed value of .
The luminosity of the radiating electrons in the nebula can be calculated from the luminosity per unit frequency given by
| (1) |
where is the distance of the shock from the pulsar expressed as . Here is the velocity of the pulsar in units of 100 km s-1, is the spin down power of the pulsar in units of ergs s-1, and is the number density of the interstellar medium in units of 1 cm-3. The spin down power of ergs s-1 and a density of 1 cm-3 yields a shock radius of cm. Assuming energy equipartition between the electron and proton fractional energy densities so that , and a fractional energy density of the magnetic field (see Cheng, Taam, & Wang 2004), the corresponding luminosity given as is ergs s-1 or . In view of the observational uncertainties, this is consistent with the observed values of ergs s-1 ( keV) and ergs s-1 ( keV).
Future theoretical investigations should be carried out to confronting the observed X-ray lightcurves and spectra having even better photon statistics than the ones which we have obtained in this first XMM-Newton observations of PSR B192910. The results we obtained from the X-ray trail along with the possible discovery of its radio counterpart are exciting. Follow up radio observations of the trail region at different wavelengths are currently scheduled for fall 2006 in order to further constrain its existence and, if detected, provide polarization information and the spectral index in the radio regime from it.
References
- (1) Beck, R., Shukurov, A., Sokoloff, D., & Wielebinksi, R. 2003. A&A, 411, 99
- (2) Becker, W., Jessner, A., Kramer, M., Testa, V., Howaldt C., 2005, ApJ, 633, 367
- (3) Becker, W., Weisskopf, M.C., Tennant, A.F., Jessner, A., Dyks, J., Harding, A.K., Zhang, S.N., 2004, ApJ, 615, 908
- (4) Becker, W., Aschenbach, B., 2002, in Proceedings of the WE-Heraeus Seminar on Neutron Stars, Pulsars and Supernova remnants, Eds. W.Becker, H.Lesch & J.Trümper, MPE-Report 278, 64, (available from astro-ph/0208466)
- (5) Becker, W., Pavlov, G.G., 2001, in The Century of Space Science, Eds. J.Bleeker, J.Geiss & M.Huber, Kluwer Academic Publishers, p721 (available from astro-ph/0208356).
- (6) Becker, W. & Trümper, J. 1999, A&A, 341, 803
- (7) Becker, W., Trümper, J., 1997, A&A, 326, 682
- (8) Bednarz, J. & Ostrowski, M. 1998, Phys. Rev. Lett., 80, 3911
- (9) Briel, U.G., Burkert, W., Pfeffermann, E., 1989, in EUV, X-ray, and Gamma-ray Instrumentation for Astronomy and Atomic Physics, eds C.J. Hailey & O.H.W. Siegmund, SPIE Vol. 1159, 263
- (10) Buccheri R., De Jager O.C., in Timing Neutron Stars, Eds. H.Ögelman, E.P.J. van den Heuvel, p95, Kluwer Academic Publishers, 1989
- (11) Caraveo, P. A., Bignami, G. F., DeLuca, A., Mereghetti, S., Pellizzoni, A., Mignani, R., Tur, A., & Becker, W. 2003, Sci., 301, 1345
- (12) Chatterjee, S., Cordes, J.M., Vlemmings, W.H.T., Arzoumanian, Z., Goss, W.M., Lazio, T.J.W., ApJ, 2004, 604, 339
- (13) Chatterjee, S., Cordes, J. M., 2002, ApJ, 575, 407
- (14) Cheng, K. S., Ho, C., Ruderman, M. 1986, ApJ, 300, 500
- (15) Cheng, K. S., Ruderman, M. A., Zhang, L. 2000, ApJ, 537, 964
- (16) Cheng, K. S., Taam, R. E., Wang, W., 2004, ApJ, 617, 480
- (17) Chevalier, R. A., 2000, ApJ, 539, L45
- (18) Chiang, J., & Romani, R. W., 1992, ApJ, 400, 629
- (19) Condon, J.J., Cotton, W.D., Greisen, E.W., Yin, Q.F., Perley, R.A., Taylor, G.B., Broderick, J. J. 1998, AJ, 115, 1693
- (20) Cordes, J.M., Lazio, T.J.W., 2002, astro-ph/0207156
- (21) De Jager O.C., 1987, thesis, Potchefstromm University for Christian Higher Education, South Africa
- (22) De Luca, A., Caraveo, P.A., Mereghetti, S., Negroni, M., Bignami, G.F., 2005, ApJ, 623, 1051
- (23) Downs, G.S., Reichley, P.E., 1983, ApJS, 53,169
- (24) Dyks, J., Harding, A. K., & Rudak, B. 2004, ApJ, 606, 1125
- (25) Dyks, J., & Rudak, B. 2004, AdSpR, 33, 581
- (26) Everett, J.E., Weisberg, J.M., 2001, ApJ, 553, 341
- (27) Harding, A.K., Muslimov, A.G., 2003, in the proceedings of Pulsars, AXPs and SGRs Observed by BeppoSAX and Other Observatories, astro-ph/0304121
- (28) Harding, A.K., Muslimov, A.G.,2002, ApJ, 568, 862
- (29) Harding, A.K., Muslimov, A.G.,2001, ApJ, 556, 1001
- (30) Harding, A. K. 1981, ApJ, 245, 267
- (31) Helfand, D.J., 1983, in Supernova Remnants and Their X-ray Emission, Eds. J.Danziger and P.Gorenstein, Proceedings of the IAU Symposium No. 101, p471
- (32) Hobbs, G., Lyne, A. G., Kramer, M., Martin, C. E., Jordan, C. A., 2004, MNRAS, 353, 1311
- (33) Kennel, C.F., Coroniti, F.V. 1984, ApJ, 283, 694
- (34) Kirsch, M.G.F., Becker, W., Benlloch-Garcia, S., et al., in X-Ray and Gamma-Ray Instrumentation for Astronomy XIII, eds Flanagan, K.A. & Siegmund, O.H.W., SPIE, Volume 5165, 85, 2004
- (35) Kramer, M., Jessner, A., Doroshenko, O., Wielebinski, R., 1997, A&A, 488, 364
- (36) Kramer, M., Wielebinski, R., Jessner, A., Gil, J.A., Seiradakis, J.H., 1994, Astr. & Astrophys. Suppl., 107, 515
- (37) Krautter, J., Zickgraf, F.-J., Appenzeller, I., Thiering, I., Voges, W., Chavarria, C., Kneer, R., Mujica, R., Pakull, M.W., Serrano, A., Ziegler, B., 1999, A&A, 350, 743
- (38) Kouwenhoven, M.L.A., van den Berg, M.C., 2001, A & A, 367, 931
- (39) Lemoine, M., Pelletier, G. 2003, ApJ, 589, L73
- (40) Manning, R., Willmore, P., 1994, MNRAS, 266, 635
- (41) Maron, O., Kijak, J., Kramer, M., Wielebinski, R., Astron. Astrophys. Suppl. Ser. 147, 195, 2000
- (42) Michel, F.C., 1991, Theory of Neutron Star Magnetospheres, University of Chicago Press, Chicago, IL
- (43) Mignani, R.P., De Luca, A., Caraveo, P.A., Becker, W., ApJ, 2002, ApJ, 580L, 147
- (44) Page, D. 1995, ApJ, 442, 273
- (45) Page, D., Applegate, J.L. 1992, ApJ, 394, L17
- (46) Pavlov, G.G., Stringfellow, G.S., Cordova, F.A., 1996, ApJ, 467,370
- (47) Reich, W., Fuerst, E., Reich, P., Reif, K., 1990, A&A, Suppl. 85, 633
- (48) Saito, Y., 1998, PhD Thesis, ISAS Research Note 643
- (49) Sembay, S., Abbey, A., Altieri, B., Ambrosi, R., Baskill, D., Ferrando, P., Mukerjee, K., Read, A.M., Turner, M.J.L., 2004, Proceedings of the SPIE, 5488, 264
- (50) Seward, F.D., Wang, Z.R., 1988, ApJ, 332, 199
- (51) Schlegel, D., Finkbeiner, D., Davis, M., ApJ, 1998, 500, 525.
- (52) Slowikowska, A., Kuiper, L., Hermsen, W., 2005, A&A, 434, 1097
- (53) Standish, E.M., 1982 A&A, 114 ,297
- (54) Sun, X., Trümper, J., Dennerl, K., Becker, W., 1993, IAU circ. 5895
- (55) Tang, A. P. S., & Cheng, K. S. 2001, ApJ, 549, 1039
- (56) Tepedelenlioglu, E., Ögelman, H.B., 2005, ApJ, submitted (astro-ph/0505461)
- (57) Tsuruta, S., 1998, PhR, 292, 1
- (58) Wang, D., Halpern, J.P., 1997, ApJ, 482, L159
- (59) Wang, Q. D., Li, Z. Y., & Begelman M. C. 1993, Nature, 364, 127
- (60) Willingale, R., Aschenbach, B., Griffiths, R. G., Sembay, S., Warwick, R. S., Becker, W., Abbey, A. F., Bonnet-Bidaud, J.-M., 2001, A&A, 365, L212
- (61) Yadigaroglu, I.-A., & Romani, R. W. 1995, ApJ, 449, 211
- (62) Yakovlev, D.G., Levenfish, K.P., Shibanov, Yu.A. 1999, Physics-Uspekhi, 169, 825
- (63) Yancopoulos, S., Hamilton, T.T., Helfand, D.J., 1994, ApJ, 429, 832
- (64) Zavlin, V.E., Pavlov, G.G., 2004, ApJ, 616, 452
- (65) Zickgraf, F.-J., Krautter, J., Reffert, S., Alcala, J.M., Mujica, R., Covino, E., Sterzik, M.F., 2005, A&A, 433, 151
- (66) Zhang, B., Harding, A.K., 2000, ApJ, 532, 1150
| Right Ascension (J2000) | |
|---|---|
| Declination (J2000) | |
| First date for valid parameters (MJD) | 52929 |
| Last date for valid parameters (MJD) | 53159 |
| Infinite-frequency geocentric pulse arrival timea (MJD, UTC) | 53120.000002393 |
| Pulsar rotation period () | 0.2265182954 |
| Pulsar rotation frequency () | 4.4146544466756 |
| First derivative of pulsar frequency () | |
| Second derivative of pulsar frequency () | |
| Spin-down age (yr/) | 3.09 |
| Spin-down energy () | 3.89 |
| Inferred Magnetic Field () | 0.5129 |
| Dispersion Measure () | 3.178 |
| Distanceb (pc) |
Note. —
a The integer part of this time is the barycentric (TDB) epoch of RA, DEC, f, .
b Distance based on radio parallax according to Chatterjee et al (2004).
| Detector | Duration | eff. Exposure |
| sec | sec | |
| SEQ: 0718_0113051301 / 2003-11-10 | ||
| EMOS1 | 10677 | 7345.1 |
| EMOS2 | 10668 | 7893.3 |
| EPN | 10470 | 6994.0 |
| SEQ: 0718_0113051401 / 2004-04-27 | ||
| EMOS1 | 21665 | 13499.2 |
| EMOS2 | 21676 | 14351.9 |
| EPN | 21470 | 10556.0 |
| SEQ: 0718_0113051501 / 2004-04-29 | ||
| EMOS1 | 22673 | 10271.6 |
| EMOS2 | 22678 | 6353.6 |
| EPN | 22471 | 6268.3 |
Note. — MOS1/2 observations were performed in FullWindow mode while the PN camera was setup to operate in SmallWindow mode. The medium filter was used in all observations.
| modela | Normalization at 1 keV | Radiusc | ||||
|---|---|---|---|---|---|---|
| Photons/keV/cm2/s | m | |||||
| PL | 0.989 | 121 | ||||
| BB+PL | 0.997 | 119 | ||||
| BB+PL | 0.996 | 120 | ||||
| BKNPLd | 1.010 | 120 | ||||
| BB+BB | 1.069 | 119 | ||||
| Diffuse emission from the pulsar’s X-ray trail | ||||||
| PL | 0.8853 | 23 | ||||
Note. —
a BB = blackbody, PL = power law, BKNPL = broken power law
b The entry in this column depends on the spectral model — it is the temperature in keV or the photon index .
c For thermal models for which we computed or fixed the radius of the emitting area we assumed a pulsar distance of 361 pc.
d The broken power law model has been fitted to the combined X-ray and optical spectral data. The break energy is fitted to be keV
| model | Energy band | ||
|---|---|---|---|
| keV | erg s-1 s-2 | erg s-1 | |
| PL | |||
| BB+PL | |||
| Diffuse emission from the pulsar’s X-ray trail | |||
| PL | |||