Two 2MASS-Selected Young Stellar Clusters: Photometry, Spectroscopy, and the IMF
Abstract
We present near-infrared , , and images and -band spectroscopy of two newly discovered stellar clusters at different stages of evolution. Our spectra suggest the presence of massive YSOs in the heavily embedded cluster in the star-forming region near radio source G353.4-0.4 and an O5-O6V star in the cluster near radio source G305+00.2. We determine a -band luminosity function (KLF) for both clusters and an initial mass function (IMF) for the cluster near G305+00.2. The derived IMF slope is if the KLF is used to derive the IMF and is if the color-magnitude diagram and spectra are used. The more reliable CMD-based slope is flatter than the Salpeter value usually found for stellar clusters. We find that using the KLF alone to derive an IMF is likely to produce an overly steep slope in stellar clusters subject to variable extinction.
Subject headings:
open clusters and associations: general — stars: formation — stars: luminosity function, mass function1. INTRODUCTION
Despite their intrinsic rarity and short lifetimes, massive stars are extremely important in the evolution of galaxies. They play an important role in determining the course of the formation of less massive stars, though the nature of this role is still uncertain, and their stellar winds and eventual supernovae shape the interstellar medium. They produce most of the heavy elements in the universe, as well as much of the UV radiation in galaxies. Their rarity, combined with the effects of large Galactic extinctions, often results in the availability of more comprehensive studies of massive stars in external galaxies, where the entire stellar population can be observed at once, than within our own where massive stars must be studied individually and the census of massive stars is still very incomplete. High optical extinction within the galactic plane () has limited optical studies of massive stars to relatively nearby regions (R kpc, Massey, 2003). Even within that radius, optically selected catalogs of O stars have been found to be incomplete, especially in star-forming regions and young clusters (e.g. Hanson & Conti, 1995). This incompleteness necessitates the use of infrared, radio and X-ray observations, particularly in the inner regions of the Galaxy and in star formation regions. The near-infrared (NIR, 1-5 µm) is an especially useful regime for the study of massive stars; the stellar atmosphere is still observed directly, but since for example , we can observe these stars in regions where dust, either along the line of sight or local to the star-forming region, makes them inaccessible at optical wavelengths. The discovery and characterization of stellar clusters observable only in the infrared can significantly enhance our understanding of obscured Galactic regions which harbor embedded massive stars or massive protostars.
Recent studies indicate that clusters may account for 70-90% of star formation and that embedded clusters (those still partially or fully enshrouded in their natal molecular cloud) may exceed the number of more traditional open clusters by a factor of 20 (Elmegreen et al., 2000; Lada & Lada, 2003). In the last decade, advancements in NIR observational capabilities resulted in the discovery and classification of some of the most massive young stellar clusters in the Galaxy, each containing dozens of O and WR stars (e.g. Nagata et al., 1995; Cotera et al., 1996; Figer, Morris, & McLean, 1996). Recent studies (Figer et al., 1999) have suggested that within these clusters, the initial mass function (IMF) does not follow the canonical Salpeter form with a slope , but instead is more heavily weighted toward massive stars; mass segregation has been proposed as a solution (Stolte et al., 2002). In the last several years a number of studies of well-known star formation regions have also been carried out in the NIR, (e.g Okumura et al., 2000; Blum, Damineli, & Conti, 2001; Conti & Blum, 2002; Figuerêdo et al., 2002). These studies have in most cases found an IMF consistent with the Salpeter value, and have uncovered candidate massive YSOs. In addition, within the past ten years, massive YSOs within molecular clouds have been studied in the NIR, (e.g. Chakraborty et al., 2000; Ishii et al., 2001) and in young stellar clusters (e.g. Hanson, Hayworth, & Conti, 1997). Massive YSOs, however, remain significantly less studied and are poorly understood in comparison with their lower-mass counterparts; many more must be identified and studied before we can adequately address how the formation of massive stars differs from that of low-mass stars.
The final release of the Two Micron All Sky Survey (2MASS) has fostered studies which can probe the entire Galaxy for previously unknown stellar clusters. Initial attempts were made which searched for stellar density enhancements, (e.g. Dutra & Bica, 2000, 2001; Dutra et al., 2003), but the identification of previously unknown clusters has met with limited success. For example, Dutra & Bica (2000) identified 52 candidate clusters, which subsequent observations (Dutra et al., 2003) indicated were in fact 10 confirmed clusters, 3 “probable” clusters, and 11 “dissolving cluster candidates”; the remainder were not clusters. Our observations of at least one of the Dutra et al. (2003) “confirmed clusters”, however, indicates that the “cluster” is most likely a region of low extinction rather than a true cluster (Cotera & Leistra, 2005). We have performed an independent search of the 2MASS archive, using color criteria in addition to stellar density enhancements. We have searched in the vicinity of regions identified as likely sites of star formation based on radio and IRAS far-infrared flux ratios, and are currently conducting a search of the entire 2MASS Point Source Catalog. We search the Point Source Catalog for regions of higher stellar density than the background (determined locally within a 5′radius) which are redder in than the local field. This selects for embedded clusters, with the color criteria helping to eliminate chance superpositions and regions of low extinction. In contrast, Dutra & Bica (2000,2001) use only stellar density to select clusters. Our method has been relatively successful to date; correctly selecting 7 clusters out of 9 potential targets, including 4 candidates toward the inner Galaxy. We present NIR imaging and spectroscopy of the two confirmed clusters in the inner Galaxy in this paper, and discuss the two unconfirmed targets in detail in Cotera & Leistra (2005). The cluster near G305.3+0.2 was independently discovered by Dutra et al. (2003b). The additional 5 outer-galaxy targets are described in Paper II.
NIR imaging and spectroscopy of both young stellar clusters and nascent stellar clusters enables us to expand the study of the IMF in objects where there has been little to no stellar evolution off the main sequence or cluster evaporation, and where the cluster age can be constrained to within Myr. Spectral typing of the most massive stars in the cluster allows their masses to be determined relatively precisely, and when combined with photometry it facilitates a reliable determination of the masses of stars throughout the entire cluster (Massey, Johnson, & DeGioia-Eastwood 1995; Massey 2002), allowing the initial mass function of the cluster to be determined more accurately than photometry alone would permit. In this paper we present the results of NIR observations of two clusters found toward the inner Galaxy, which we designate by the Galactic coordinates of their centers, G353.4-0.36 (17:30:28 -34:41:36 J2000) and G305.3+0.2 (13:11:39.6 -62:33:13 J2000). In Paper II we will present the results of similar observations of five clusters in the outer Galaxy.
2. OBSERVATIONS & DATA REDUCTION
We observed candidate young stellar clusters with the facility instrument IRIS2 on the 3.9m Anglo-Australian Telescope (AAT) on July 12-15, 2003. IRIS2 is an imaging spectrometer which uses a 1024x1024 Rockwell HAWAII-1 HgCdTe array with a platescale of 045/pixel, resulting in a 7777 field of view. Images were obtained in (1.25 µm), (1.63 µm), and (2.14 µm) filters. spectra of selected stars in each cluster candidate were obtained in for all candidates.
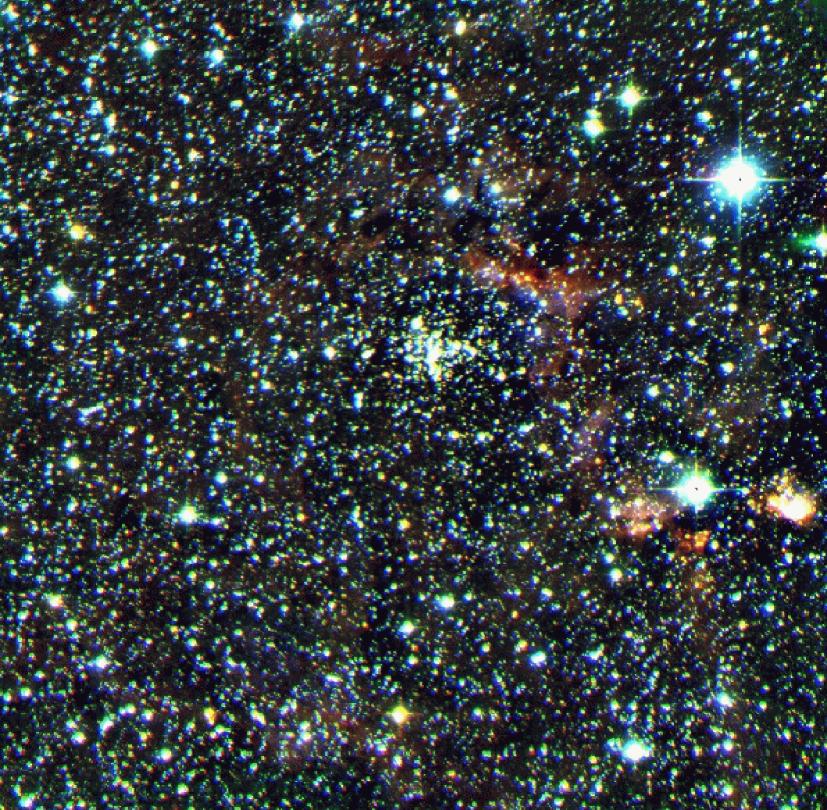
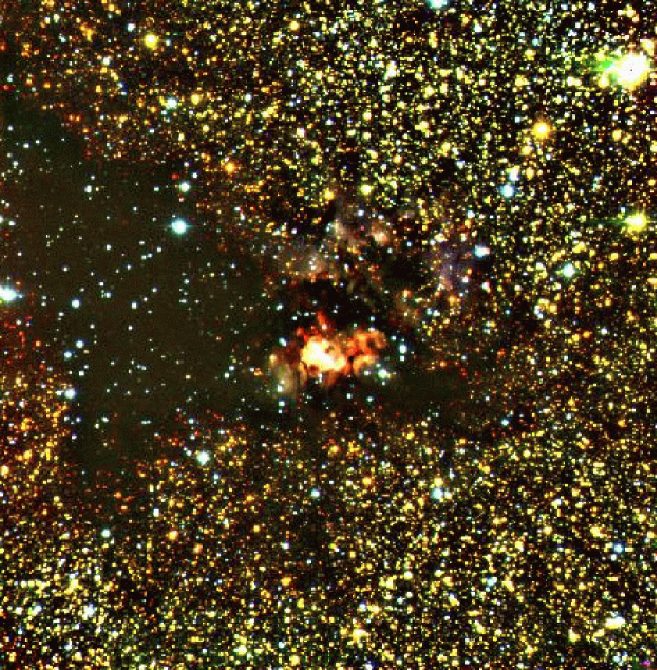
We selected a total of four cluster candidates in the southern hemisphere using the 2MASS Point Source Catalog based on color and density criteria. Two of the candidates observed appear to be regions of low extinction and are discussed elsewhere (Cotera & Leistra, 2005). The two confirmed clusters are near radio H II regions designated G305.3+00.2 and G353.4-0.4. We present three-color composites of the 8′8′ images of the G305.3+00.2 and G353.4-0.36 clusters in Figures 1 and 2 respectively.
G305.3+00.2 is an H II region which has been previously observed using radio recombination lines (Wilson & Mezger, 1970), C I emission in the submillimeter (Huang et al., 1999), and in the mid-infrared (MIR) by the Midcourse Space Experiment (MSX). The kinematic distance of kpc obtained for this H II region (Wilson & Mezger, 1970) agrees well with the distance of 3.3 kpc for masers several arcminutes away (Caswell et al., 1995), suggesting they may be part of a single star-formation complex. A distance of 4 kpc is adopted as an upper limit to the radio kinematic distance by Clark & Porter (2004) in a study of the star clusters Danks 1 and 2 in this region. The situation is more complex for the G353.4-0.36 cluster, which is in a region known to be a site of massive star formation. There are numerous radio sources located within 1′ of the NIR cluster, which we discuss in detail in §3.2.2.
All photometric observations were done in excellent seeing conditions: 07-09. The images were reduced and combined automatically at the telescope using the ORAC-DR pipeline. ORAC-DR is a generic data reduction pipeline created at the Joint Astronomy Centre in Hawaii, originally for use with various UKIRT and JCMT instruments. Subsequent reprocessing did not noticeably improve the images, therefore the pipeline processed data has been used throughout. Source detection, PSF fitting, and photometry was carried out using IRAF-DAOPHOT, and is discussed in detail in §3.2.
All spectra were obtained with a 1″ 77 slit. The long-slit format combined with the high stellar density within the FOV resulted in the simultaneous observation of multiple stars. Total integration times ranged from 10 minutes to 30 minutes, and were chosen to provide adequate S/N for NIR spectral classification as described in Hanson, Conti, & Rieke (1996). After the data was flat-fielded, grism curvature was removed using the FIGARO111FIGARO is part of the Starlink software package available at http://star-www.rl.ac.uk/ tasks cdist and sdist. Wavelength calibration was performed using the the OH- night sky lines and the FIGARO task arc. The uncertainty in the wavelength calibration fit was determined to be 2.18 Å. The FIGARO task irflux was used both to flux-calibrate the spectra and remove the telluric absorption using the G2V standards HD157017 and HD115496. Both of the standards had intrinsic Br in absorption, with equivalent widths of 5.7 Å for HD157017 and of 5.6 Å for HD115496; in each case, the absorption line was removed by fitting a line to the continuum in the region of the line in the standard star spectrum prior to flux calibration. The individual spectra were obtained by extracting apertures 4-5 pixels wide from the full spectral array, then performing background subtraction using apertures of the same width on either side of the source, separated by 2 pixels (09). We also extracted off-source spectra in each cluster to characterize any nebular emission.
3. Analysis
3.1. Spectroscopy
The development of NIR spectral atlases of nearby massive stars of known spectral type (Hanson et al. 1996; Morris & Serabyn 1996; Blum et al. 1997), provides a valuable classification scheme for stars too heavily obscured by dust to permit optical spectroscopy. In the band, in addition to the Br (2.165 µm) line, massive O stars have helium (He I 2.058 µm, He I 2.112 µm, He II 2.189 µm), carbon (C IV 2.078 µm), and nitrogen (N III 2.116 µm) lines in their spectra which allow for the determination of the spectral type to within a subtype if there is adequate () line signal to noise. Table 6 of Hanson et al. (1996) indicates that in many cases the mere presence of these lines in emission or absorption (without considering equivalent width) is sufficient to determine spectral type to within two subtypes for O stars. The situation is more complicated for B stars, which have fewer features in this part of the spectrum; however, they are still classifiable using only -band spectra.
We obtained -band spectra of five stars in the G305.3+0.2 cluster field and three stars in the G353.4-0.36 cluster. In order to reduce the level of foreground contamination, we imposed a color cut of based on the 2MASS magnitudes and selected the brightest stars meeting this requirement. Despite this cutoff, two of the five stars observed in the G305.3+0.2 cluster proved to be foreground contaminants with sufficient line-of-sight extinction to push them over our threshold. The cluster sequence was much narrower and more well-separated from the foreground in the G353.4-0.36 cluster, and no obvious foreground contaminants were present in our spectroscopic sample. The G353.4-0.36 cluster was sufficiently red (), that the time required to obtain a useful signal-to-noise in -band spectra would have been prohibitively large, so only -band were obtained.
3.1.1 G305.3+0.2 Cluster
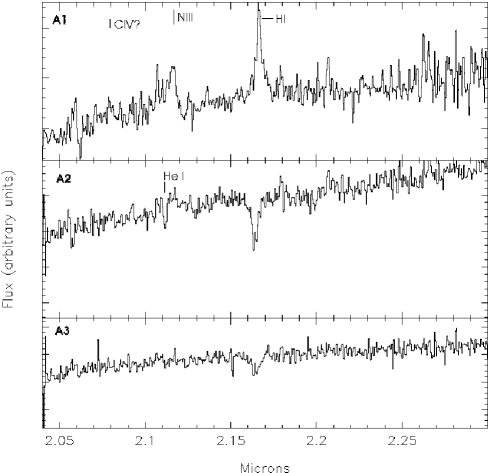
We present spectra for the three cluster members, which we label A1–A3, in Figure 3.
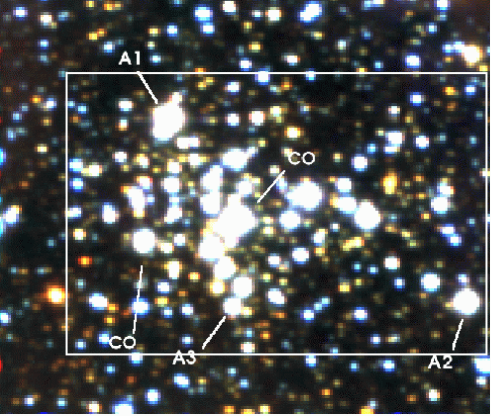
In Figure 4 we present a 106″ 120″ image of the cluster and label the positions of sources A1–A3.
The measured magnitudes (see §3.2) and observed spectral lines for A1–A3 are presented in Table 1. The other two stars for which we obtained high S/N spectra have late-type spectra, as indicated by strong CO absorption at 2.29 and 2.32 µm, suggesting they are either foreground objects or YSOs. The lack of nebular emission in the cluster and the presence of weak (nearly the same as in the G2V spectral standard) Br absorption in one of the spectra suggest that these are foreground objects rather than YSOs. In addition, the magnitudes of these objects ( and ) make them too bright to be low-mass YSOs at the cluster distance, and the presence of main-sequence O and B stars argues against identifying these objects as massive YSOs. We thus conclude that these two stars are most likely late-type foreground stars, and excluded them from further analysis.
Although nebular emission can be seen in the full image (Figure 1), it is significantly removed (1′) from the cluster. Nevertheless, in order to ensure that any measured Br (2.166 µm) is stellar in origin and not contaminated by nebular emission within the cluster, we extracted a local background spectrum for the cluster. There were no features apparent in the resulting spectrum; we thus conclude that nebular emission within the cluster is negligible. This conclusion is supported by an apparent bubble of MIR emission seen in the MSX Band A image (see Figure 5); the MIR emission avoids the cluster itself.
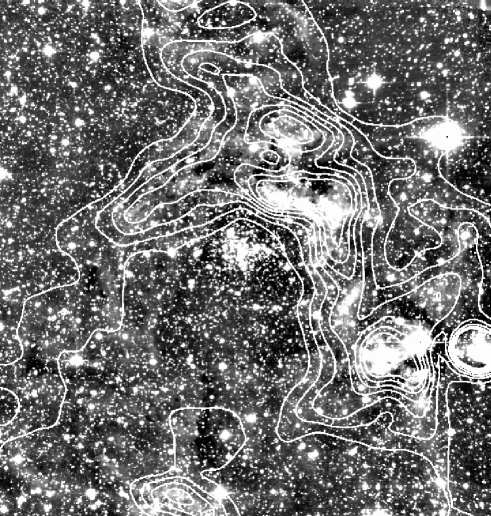
Figure 3 shows that source A1 has emission lines with equivalent widths stronger than -2 Å at 2.116 µm and 2.166 µm (see Table 1). The line at 2.166 µm is immediately identifiable as Br. We identify the line at 2.116µm as N III, which is consistent with the lines used in the the classification system presented in Hanson et al. (1996); the broad nature of this line is due to the multiplet nature of the transition responsible rather than broadening by stellar winds. The presence of Br and N III 2.116µm in emission, without further information and without equivalent widths, is sufficient to identify the star as being an early to middle O supergiant; the broad Br, produced in the stellar winds, is not observed in main-sequence O stars (Hanson et al., 1996). There is a possible weak detection () of C IV in emission at 2.078 µm. This line only appears in O stars ranging from O5 to O6.5 (Hanson et al., 1996), and if real, significantly constrains the stellar type. Helium lines are often observed both in emission and absorption in the spectra of massive stars: He I (2.058 µm), He I (2.112 µm), and He II (2.189 µm), are all absent from the spectrum of A1. Poor removal of the telluric features near the 2.058 µmfeature prevents us from drawing any conclusions based on our non-detection. If real, the absence of the He I (2.112 µm) line restricts the spectral type to O6 or earlier. A He II line is expected in an O star; by estimating the strength of possible features dominated by the noise (as described in detail in § 3.1.2) we can place an upper limit of 0.5 Å on the equivalent width of any potential He II (2.188 µm) feature. This is consistent with the width of the feature in the stars observed by Hanson et al. (1996), so the non-detection does not rule out an O star identification for this source. Taken together, these spectral characteristics suggest a spectral type of O5Ib-O6Ib for Source A1. If the weak detection of C IV is discounted, the presence of the N III line and the limit on an He II line at 2.188 µm allows an O7-O8 identification as well. Even when present, however, the C IV line is weak, with an equivalent width weaker than -2 Å; thus, while a positive detection of this line would allow for definitive classification of this source as an O5Ib-O6Ib star, a non-detection at the given S/N does not preclude the same classification.
The intrinsic NIR colors of O and B stars range from -0.08 to -0.01 (Wegner, 1994); this small range allows an extinction to be derived even without knowing the precise spectral type of a massive star. For source A1, the extinction thus derived based on the observed color is assuming the extinction law of Rieke & Lebofsky (1985). However, the large range in absolute for O supergiants prevents us from making a distance determination based on Source A1. We can only say the distance is greater than kpc, which would be the distance for a main-sequence O5-O6 star. Clark & Porter (2004) adopt a distance of 4 kpc to the Danks 1 and 2 clusters in the same star formation complex, calling it an upper limit to the values allowed by the radio and H observations, and we will follow suit, acknowledging that the uncertainties in this value are kpc.
Source A2 shows a strong Br (2.166 µm) line in absorption with an equivalent width of Å and a probable weak He I (2.112 µm) line in absorption with EW = Å. This combination of features occurs only in B stars; a comparison of the equivalent width of the lines with the B stars of Hanson et al. (1996) suggests an spectral type in the range of B2-B4. If the He I line is considered only as an upper limit, the classification becomes more problematic, and the star could range from B2-A2. The star has , which for any star in this range of spectral type excludes a foreground object. Unlike for A1, the luminosity class of these sources cannot be determined from these spectral features; as Hanson et al. (1996) points out, the -band spectra of early B supergiants are indistinguishable from those of early B main-sequence stars about half the time, and those of late-B supergiants cannot be distinguished from early-B dwarfs.
If we assume that A2 is a cluster star, we can constrain the absolute magnitude, and thus the spectral type, by requiring the distance to be the same as for the O star. Since the intrinsic near-infrared colors vary by less than 0.1 magnitude for stars in the range of spectral types allowed by the spectrum (Wegner, 1994), we can derive a extinction for this source rather than use that derived from the O star, thus reducing the effects of differential extinction. This gives an extinction to source A2 of , or using the reddening law of Rieke & Lebofsky (1985). At the distance of kpc, we obtain an absolute magnitude for Source A2 of , roughly that expected for an O8V star. This identification is not consistent with the spectral features of A2; a smaller distance, or an identification of A2 as an early-B supergiant, could explain the spectrum of A2. If the radio distance of kpc is used instead, we obtain an absolute magnitude of for Source A2, making it a B0V-B1V.
Source A3 shows only Br in absorption with an EW of Å. We place an upper limit on an He I absorption line at 2.112 µm of 0.6 Å. As discussed above, this width for Br only constrain the classification of the star as main sequence B or early A. The observed magnitude is , which corresponds to an absolute assuming the extinction and distance of an O5Ib-O6Ib star for source A1; this is consistent with an identification of A3 as a main-sequence B1V star. The radio distance would imply a B2V identification, also consistent with the spectral features of A3. Source A3 is not among the brightest stars in the cluster region; it happened to fall in the same long slit as one of the foreground contaminants we had targeted for observation. This suggests that the other cluster members brighter than A3 are also late O or early B stars.
3.1.2 G353.4-0.36 Cluster
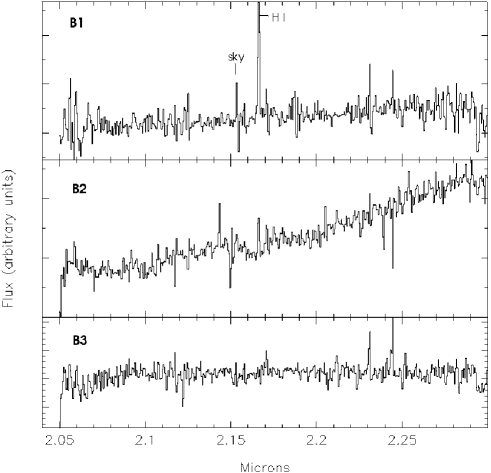
Spectra for the three sources observed in this cluster are presented in Fig. 6.
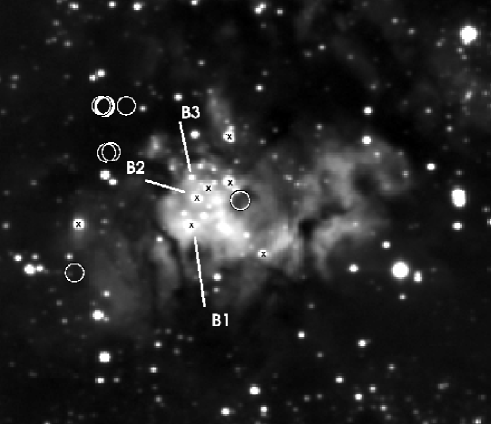
An enlarged version of the relevant portion of Fig. 2 is presented in Fig. 7, with the positions of the spectroscopic targets indicated with arrows and labels.
The only non-nebular feature which we detect is CO absorption in Source B1; the Br emission observed in all three spectra is contaminated by nebular emission to such a degree that we cannot disentangle any stellar component that may be present. While this line is much stronger in B1 than in the other two sources, the nebular emission is highly spatially variable in the cluster region and this does not demonstrate a stellar origin for the line. Additionally, the line width is significantly narrower than that of Source A1 and is similar to that observed in the off-source nebular spectrum (Fig. 8).
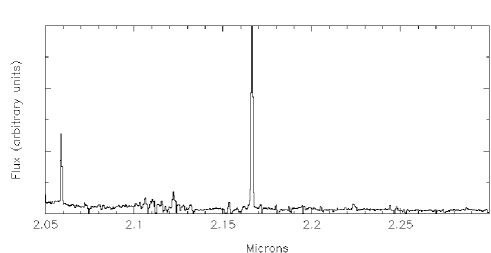
The CO absorption in Source B1 in combination with the red colors (Table 3) are similar to those associated with solar-mass young stellar objects (YSOs) (Greene & Lada, 1996), or a cool giant or supergiant. If B1 is a YSO, the CO absorption is from the circumstellar material; otherwise it is photospheric in nature. Using the radio kinematic distance (Forster & Caswell, 2000) of 3.6 kpc to the cluster, we derive an for Source B1 of -0.8 without correcting for extinction. Correcting for extinction is difficult to do accurately in this region of highly variable extinction, especially when the intrinsic colors are not known since the nature of the object is uncertain. Nevertheless, limits can be placed on the amount of extinction present, and thus the absolute magnitude of Source B1. The lower limit is given by the uncorrected value of , which assumes the color observed is the intrinsic color, while the bright limit can be derived assuming an intrinsic , characteristic of late-type stars; this gives an extinction to source B1 of magnitudes and an extinction-corrected absolute of . This is several magnitudes brighter than the expected magnitude of YSOs of approximately a solar mass at the distance and extinction of this cluster, (Oasa, Tamura, & Sugitani, 1999), and somewhat lower than the for massive YSOs, to (Ishii et al., 2001). Finally, we note that this is consistent with that for a YSO (Chakraborty et al., 2000). We conclude that if Source B1 is a YSO, it has a mass greater than a few solar masses based on its absolute magnitude in , but observations of more massive YSOs are still sufficiently few that a more accurate mass determination based solely on the absolute magnitude is not possible. Given the nebular emission, seen as He I (2.058 µm), H2 (2.12 µm), and Br (2.166 µm) emission off the stellar sources (see Figure 8), G353.4-0.36 is obviously a region of current star formation; therefore, the identification as a massive YSO is more probable than a late type cool giant or supergiant located in the cluster itself.
Since Source B1 was not detected in , it cannot be placed on a color-color diagram to determine whether a NIR excess is present, which could help to discriminate between the YSO and cool field star possibilities. For B1 to be a cool giant, it would need to be a foreground star with the appropriate color and magnitude, which falls by chance in the cluster region. Rather than use the entire 8′ 8′ field to determine the field star density, as we did for the G305.3+0.2 cluster (§3.2), we used only the heavily extincted region surrounding the cluster. This is because the molecular cloud in which the cluster is embedded extinguishes the background stars to such a degree that using the entire field would significantly overestimate the level of field star contamination in the immediate region of the cluster. We estimate the probability of a field source as bright as or brighter than Source B1 and red enough to satisfy the color cut falling within the cluster region to be approximately 18%. This is a conservative estimate, since at the edges of the cloud reddened sources become visible and increase the field star density, especially of red objects, over what it would be at the location of the cluster. Nevertheless, we cannot rule out either a foreground giant or a YSO explanation for Source B1.
As with Source B1, the non-detection of Sources B2 and B3 in prevents us from using a color-color diagram to measure NIR excess. No photospheric features are detected in the spectra of either Source B2 or B3; Source B2 shows a rising spectrum in suggesting a strong NIR excess, while the spectrum of B3 is essentially flat in this region. In order to determine whether the spectra were truly featureless or merely had a signal-to-noise too low to see expected features, we fit a continuum to the spectra and examined all excursions above and below the fit. 90% of these deviations had an equivalent width less than 1.7 Å. For comparison, the detected absorption lines tabulated by Greene & Lada (1996) for low-mass YSOs range in equivalent width from 0.3-5.6 Å for Na I and Ca I, with CO usually exceeding 2 Å when present. Ishii et al. (2001) conducted a similar survey of massive YSOs; the only emission lines other than Br detected in a significant number of sources are CO (with an equivalent width exceeding 4 Å) and H2 (with an EW Å in all cases, and Å in most cases). We thus conclude that Source B2 is genuinely featureless, but cannot classify it. The final source, Source B3, had no reliably detected features but the signal-to-noise was low enough that we cannot reliably call it featureless.
The observed magnitudes are consistent with a B star identification for sources B2 and B3; however, the extincted but distance-corrected magnitudes of to are also similar to those observed for the massive YSO () 05361+3539 (Chakraborty et al., 2000). Thus, although these sources are massive, we cannot distinguish based on their NIR spectra or magnitudes between shrouded B stars and less-evolved YSOs. Mid-IR observations with sufficient resolution to resolve the individual sources (separated by ″) would aid in this determination; deeper J-band photometry, detecting more of the cluster stars, would also be useful. We note that although we see ionized gas suggesting the presence of O stars, we have not detected any O stars which would be the source of the ionizing radiation in this cluster.
Due to the young age of the sources observed in this cluster and the lack of photospheric features in their spectra, the spectra were unsuitable for determining a reliable distance. Thus, the kinematic distance to the associated maser and UCHII (Forster & Caswell, 2000) was used instead, adjusted to a distance to the Galactic Center of 8 kpc from the original 10 kpc. This gave a distance to the cluster of 3.6 kpc. Assuming an intrinsic , we estimate the reddening to the cluster at based on the narrow cluster sequence at and assuming the extinction law of Rieke & Lebofsky (1985). This estimate is highly uncertain due to the young age of the sources; many are likely to have a near-infrared excess leading to an overestimate of the line-of-sight extinction to the cluster.
3.2. Photometry
We obtained images in , , and of both clusters to a limiting magnitude of approximately , , , with total integration times of 12 minutes in each band. The limiting magnitude was brighter than expected due to confusion, which is most noticeable in due to the slightly larger PSF and the greater sensitivity of the instrument at shorter wavelengths. Seeing was 07–08, which, since the IRIS2 platescale is 045/pixel, resulted in a slight undersampling of the point spread function (PSF), thus making PSF fitting more uncertain. Our individual images were taken using a random dither pattern with sub-pixel dithers employed to improve the PSF. In an effort to better understand our errors we performed both PSF fitting and aperture photometry for each source. There was no systematic offset between the two methods, but the errors were times larger for the aperture photometry due to the crowded fields.
Photometric calibration was performed using the 2MASS magnitudes of field stars, after correcting from the IRIS2 filter system to the 2MASS filter system as described in Carpenter (2003). The calibrated magnitudes for the stars in the cluster area are presented in Table 2. The large field of view and location in the Galactic Plane provided over 100 stars in each pointing which were bright enough to have good photometry with 2MASS, but faint enough to be unsaturated in our IRIS2 images . Those stars which were relatively isolated in the IRIS2 images were used as the photometric calibration set. We chose to use a relatively large number of calibration stars rather than selecting the few most isolated stars to reduce effects of potential variability and photometric outliers among the calibration stars. The scatter in the photometric calibration derived from comparison to 2MASS is the dominant source of photometric error, contributing two to three times the measurement errors as reported by DAOPHOT. DAOPHOT errors were mag while the calibration uncertainties were (, and mag). Quoted errors in the 2MASS photometry were negligible, with most stars having an error of mag or less in all bands. Thus, the quoted error should be considered an overestimate when considering the relative photometry of stars within either cluster; the calibration errors from comparison to the 2MASS photometry will shift all our measurements by the same amount. No trend in the photometric errors, either internally or relative to the 2MASS data, was observed with location. Finally, the positions of the stars were also adjusted to agree with 2MASS by minimizing the offsets between the 2MASS and IRIS2 positions allowing for pointing offset and rotation.
3.2.1 G305.3+0.2
The color composite of the full , , and images is presented in Fig. 1; the cluster alone is shown in Fig. 4, with the spectroscopic targets marked.
The cluster is clearly visible in the full-size image with a concentration of nebular emission to the northwest. In order to help determine whether the nebular emission is physically associated with the cluster, we overplotted the contours at 8 µm from the MSX mission222On-line data are available from http://www.ipac.caltech.edu/ipac/msx/msx.html. (Fig. 5). The ridge of near-IR nebulosity corresponds to the brightest portion of a roughly circular structure of mid-IR emission, with the cluster located in the interior where there is no mid-IR emission present. The general appearance is that of a wind-blown bubble, and the 8 µm emission wraps entirely around the cluster at a lower level. The cluster is located off-center in this structure, near the brightest portion of the mid-IR emission, but there is no mid-IR emission and no near-IR nebulosity present in the area of the cluster itself. The cluster is dense and well-defined, with stellar density much higher than in the field.
The versus color-magnitude diagram of the cluster region is shown in Figure 9.
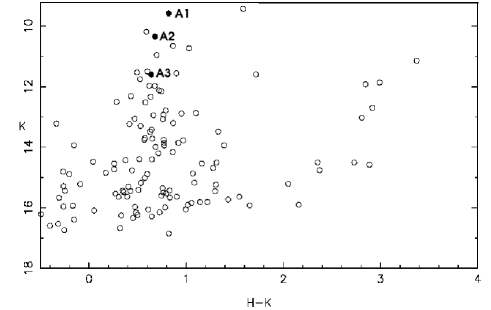
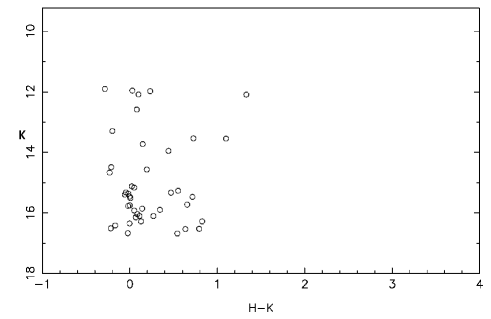
At radii of approximately 30″ in the east-west direction and 20″ in the north-south direction from the cluster center the stellar density has fallen to that of the field, which we used to define the cluster region. Foreground stars are apparent in the color-magnitude diagram at ; in this cluster there is no clear separation in color between cluster and field stars, just an overdensity of redder stars in the cluster; as a result, we cannot impose a firm color cut to separate field stars from cluster stars. A color-magnitude diagram of a randomly selected control field with the same area as the cluster is shown in Fig. 10; many fewer stars are present, especially at bright magnitudes and moderately red colors.
In order to account for field star contamination within the cluster region, we determined the average number of stars per square arcminute in the image outside the cluster region in color-magnitude bins of , and randomly selected the appropriate number of stars from the cluster field for removal. This is similar to the procedure employed by, among others, Blum, Conti, & Damineli (2000) and Figuerêdo et al. (2002). In cases where less than one star was expected in the cluster field in a particular color-magnitude bin, the number expected was used as a probability for removing a star. A total of 24 “field” stars were removed, leaving 115. The main concentration of cluster stars is at about , with a gradually declining number present out to . The resulting cluster CMD with the field stars statistically removed is shown in Fig. 11.
Given the spectroscopically confirmed presence of OB stars in the cluster, as well as the lack of an obvious color gap, we consider it more likely that these very red sources are either background sources or sources with a near-IR excess due to local dust than that they represent a separate cluster giant branch. The red sources are not concentrated toward any part of the cluster, though they may occur more frequently on the outskirts (as would be expected if they are background objects). Sources redder than were excluded from analysis of the cluster KLF and IMF; they are unlikely to be main-sequence cluster members. If they are included and assumed to be on the main sequence, the resulting extinction correction would give very large values for the masses and an overly flat slope to the IMF. If these sources are cluster members, they are pre-main-sequence objects, and their masses are difficult to determine from and photometry alone. Thus, including them in the IMF determination would give an inaccurate result whether or not they are cluster members, and they have been excluded. Finally, the crowded nature of the cluster region means that these very red sources may suffer from poor photometry.
The vs. color-color diagram (Fig. 12) is of limited utility in identifying cluster members or determining whether some cluster members are pre-main-sequence objects.
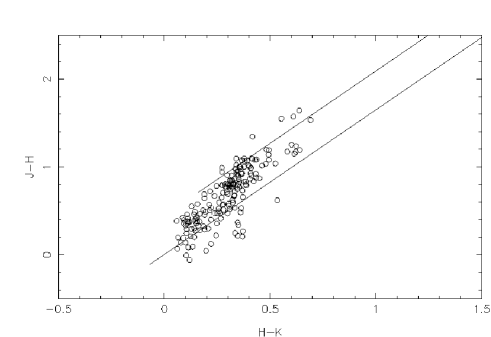
Since many sources were undetected in , it will not represent all cluster members, and faint red sources (where we would expect to find the relatively low-mass, pre-main-sequence objects) would be most commonly missed in the color-color diagram. A cut based solely on must still be applied to exclude background sources. Fig. 12 shows few sources in the area occupied by pre-main-sequence objects. Of those sources separated from reddened main-sequence stars by more than 3, three are relatively faint sources adjacent to bright sources and one is in a particularly crowded region. The remaining three could potentially be pre-main-sequence objects. However, due to the lack of observed gaseous emission from the cluster, we consider it unlikely that these are truly pre-main-sequence stars, and exclude them from the analysis along with the objects in the unphysical blue region of the color-color diagram as likely suffering from blending or a mismatch between sources in the different bandpasses. There are few enough sources in this region that we do not expect their inclusion or exclusion to greatly affect the IMF determination.
3.2.2 G353.4-0.36
The , , and color composite of G353.4-0.36 is presented in Fig. 2. The youth of this cluster is immediately apparent from its heavily embedded nature and the dense molecular cloud that surrounds it. This region has long been known to be a site of massive star formation, and it has been studied extensively in the radio and sub-mm, including continuum observations at 1.5 GHz, 5 GHz (Becker et al., 1994), and 850 µm (Carey et al., 2000) as well as molecular line observations in CS (Gardner & Whiteoak, 1978), CO (Whiteoak, Otrupcek, & Rennie, 1982), H2CO (Gardner & Whiteoak, 1978), HNCO (Zinchenko, Henkel, & Mao, 2000) (identified as a dense molecular core), and SiO (Harju et al., 1998). These signatures of ongoing star formation, combined with the strong nebular emission still present around the sources observed spectroscopically, suggest that the cluster is quite young, without main-sequence stars. Many of the continuum and molecular line observations quote slightly different positions for the source peak, and sources separated by several tens of arcseconds are all identified with the IRAS point source 17271-3439. Since the beam sizes in many instances are comparable to the size of the NIR-bright nebulosity and to the separation between sources, it is likely that the extended source measurements are observing the same complex, which may peak at different locations in different wavelengths. Many of the radio data are tabulated by Chan, Henning, & Schreyer (1996), who identify a massive YSO in the region based on the IRAS colors. It is obvious from the NIR imaging that this source is not a single point source; in addition to the NIR sources, there are at least four separate sets of masers (e.g. Caswell et al., 2000; Argon et al., 2000; Val’tts et al., 2000), one of which is associated with an UCHII (Forster & Caswell, 2000). Positions of the masers are indicated in Fig. 7. We note that the masers occur in regions which are heavily extincted in the near-IR. OH, H2O, and CH3OH masers are all known in the region; the latter in particular are indicative of ongoing massive star formation. Clearly the sources visible in the near-infrared are only the tip of the iceberg, with other massive stars still in the process of formation. Higher-resolution maps at radio and sub-mm wavelengths are necessary to obtain a full understanding of this region.
In the region of the large dark molecular cloud, only foreground stars are visible. This implies in order to completely obscure the stars even in , assuming a -band detection limit of 17 and a distribution of magnitudes similar to the rest of the field. The less heavily extincted region in which the cluster is visible in the near-IR must have been partially cleared out by stellar winds and ionization from massive stars. The relative position of the NIR stars and the methanol masers (which lie in regions of higher extinction) suggest that we are observing stars nearer the main sequence which are emerging from the dust, while objects at an earlier evolutionary state are offset from this region, indicating ongoing star formation.
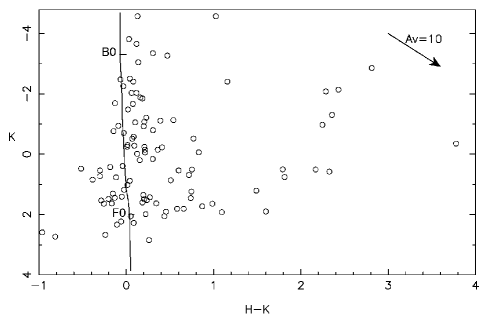
The color-magnitude diagram of the G353.4-0.36 cluster is presented in Figure 13.
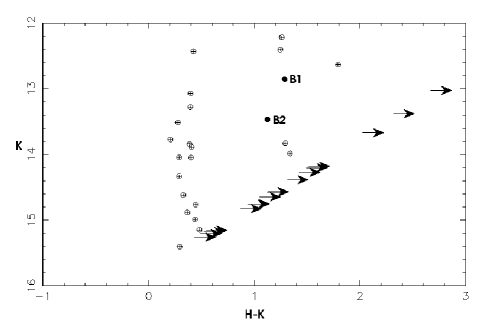
The cluster sequence is much narrower and more well-separated than in the G305.3+0.2 cluster, allowing for reliable separation of foreground objects based solely on . Thus, we did not carry out a statistical removal of foreground objects for this cluster, instead considering only the objects well-separated from the foreground sequence. Due to the high extinction toward this cluster, a large number of objects in the cluster area were detected only in (shown as limits in Figure 13). The KLF is thus likely to be more reliable than the color-magnitude and color-color diagrams in determining cluster characteristics.
4. The K Band Luminosity Function and the Initial Mass Function
Once field stars have been rejected as described in §3.2.1, we can compute the KLF for both clusters. For the G305.3+0.2 cluster, which has more than 100 stars remaining, we additionally compute the initial mass function (IMF) using two different techniques, the first using the KLF and the second using the color-magnitude diagram and the spectroscopy of the massive stars. The KLF is commonly used to determine the IMF even when multi-color photometry is available; we take this opportunity to test the robustness of this method and compare the results between this simple and commonly used method and the more involved method using the color-magnitude diagram. This will help to understand the uncertainties and systematic errors that may be a factor when only the KLF method can be used to derive an IMF. There were too few stars to robustly compute the IMF for the G353-0.4 cluster, so we compute only the KLF in this case.
4.1. The G305.3+0.2 Cluster
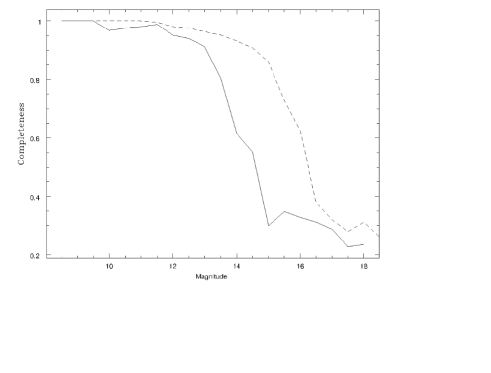
To provide a robust determination of the KLF and the IMF, we must determine the completeness of our data, which we established by performing artificial star tests. Five artificial stars at a time were inserted into the cluster region; the small number was chosen to avoid significantly changing the crowding characteristics. IRAF-DAOPHOT was then run on the images to determine the number of artificial stars that were successfully recovered. The procedure was repeated 50 times for each magnitude bin (), for a total of 250 artificial stars added in each bin in and in . Figure 14 shows the results; completeness falls sharply to about 25% at , . We can compare these magnitudes with the turnover in the “field luminosity function”, which also probes incompleteness. The counts in the field turned over sharply at , in reasonable agreement with the artificial star estimate of incompleteness.
4.1.1 The Luminosity Function
Knowing our incompleteness, we can calculate the KLF for the cluster. Figure 15 shows the uncorrected data, with the field “luminosity function” normalized to the same total number of stars overplotted for comparison. Figure 16 shows the results after correcting for incompleteness by dividing the number of stars in each magnitude bin by the recovered fraction of artificial stars.
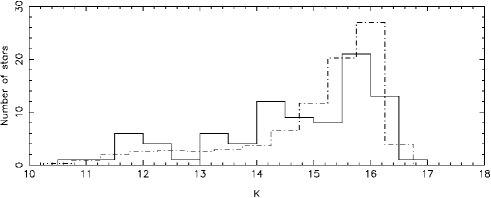
As expected, there is an overabundance of bright stars () in the cluster region relative to the field. This is not an artifact of incompleteness; the completeness fraction at this magnitude is , and we expect incompleteness to be higher in the cluster than the field due to the effects of crowding. Using the number counts corrected for field star contamination (as discussed in §3.2.1) and incompleteness, we fit a slope to the number counts in bins of . We excluded sources fainter than from the fit since errors in the incompleteness determination are likely to dominate the number counts. We derived a slope of for log . This slope is somewhat flatter than the KLFs derived for more massive embedded clusters (e.g. for NGC 3576 from Figuerêdo et al. (2002), for W42 from Blum et al. (2000)). This suggests that this cluster is more weighted toward massive stars than the norm.
4.1.2 The Initial Mass Function
In order to better compare our results with the literature, and to explore how much of a difference the use of multi-color photometry and spectra of the massive stars make in the determination of the IMF, we used two methods to derive an IMF for the G305+00.2 cluster. For both methods we use a distance to the cluster of 4.0 kpc (as discussed in §3.1.1). The first IMF-determination method, which uses only the KLF, is commonly employed even when multi-color photometry and spectra are available (e.g. Figuerêdo et al., 2002; Blum et al., 2000). This method is simply a transformation from magnitude bins to mass bins. To make this transformation, we first correct the observed for distance and extinction as discussed in §3.1.1. Using the stellar evolutionary models of Meynet & Maeder (2003) for solar metallicity, we relate the mass for each track to an absolute magnitude for a star on the ZAMS. We transformed to using the bolometric corrections from Vacca, Garmany, & Shull (1996) for the early spectral types and Malagnini et al. (1986) for later spectral types. We then use the intrinsic colors from Bessell & Brett (1988) for A-M stars and from Wegner (1994) for O and B stars. Finally we interpolate linearly between the masses available on the evolutionary tracks to find the masses corresponding to our magnitude bins, and fit a power law to the resulting mass function. Our resulting IMF slope is , excluding the two lowest-mass bins where incompleteness is significant.
Our second method of determining the IMF made use of our multi-color photometry and spectra to estimate individual extinctions and masses for cluster members. Spectral typing of the brightest cluster stars allows their mass to be determined fairly accurately for a given stellar evolutionary model. For the models described above, the mass of an O6V star is approximately 40 M⊙, that of a B0V star is 15 M⊙, and that of a B2V star is 8 M⊙. Although spectra are not available for most of the cluster stars, their masses, as well as extinctions to the individual stars, can be estimated from the accurate relative photometry. The presence of an O supergiant in the cluster suggests that, while the most massive stars have begun to evolve away from the main sequence, none have yet gone supernova, and less massive stars should still be on the zero-age main sequence. Therefore, with the exception of the few most massive stars (for which we can estimate masses from their spectral types) the cluster stars should be scattered around the zero-age main sequence (ZAMS) primarily by differential extinction and rather than the effects of stellar evolution. We can then use the same models and conversions from theoretical to observed quantities described for the KLF method, with additional transformations from to using intrinsic colors from from Bessell & Brett (1988) and Wegner (1994) and from to spectral type from Repolust et al. (2004) or Johnson (1966).
This transformation from theoretical to observed quantities allows us to place the ZAMS on our CMD. If the cluster is sufficiently young that we can neglect the effects of stellar evolution, as discussed in the previous paragraph, we expect the ZAMS will lie in the middle of the distribution of cluster stars. The ZAMS derived from the evolutionary tracks of Meynet & Maeder (2003) is overplotted on the distance and extinction-corrected CMD in Figure 11. A significant number of stars are bluer than the ZAMS on this plot. We interpret these as stars which are less extincted than those used to determine the average cluster extinction and thus have been over-corrected by using the mean extinction. The scatter of stars around the ZAMS suggests that the extinction varies across the cluster region. To correct for this, we move the stars along the direction of the reddening vector until they lie on the ZAMS. If the resulting extinction differs from the mean cluster value by more than for a given star, we exclude the star from the analysis, as it probably suffers from poor photometry. Examination of the color image of the cluster region (Figure 1) suggests that the variation in internal extinction in this region is relatively small; no dust lanes or color variations across the cluster are visible to the eye. The exact value selected for the cutoff is somewhat arbitrary, but does not greatly affect the results; most of the sources thus excluded have derived extinctions that differ from the median value by or more.
Using the positions of the extinction-corrected photometry along the ZAMS, we are able to more accurately place stars in mass bins. The endpoints of the bins were determined by the masses for which theoretical tracks are present in the models we used. In order to have an adequate number of stars in each bin we constructed bins using alternate tracks for the endpoints, rather than every track. The analysis was repeated for three different metallicities () using the evolutionary tracks of Mowlavi et al. (1998, Z = 0.1), Schaller et al. (1992, Z=0.02); Meynet & Maeder (2003, Z=0.02) and Schaller et al. (1992, Z=0.001). For the solar-metallicity case the high-mass points () are from Meynet & Maeder (2003) while the lower-mass points are from Schaller et al. (1992). The difference in for the two solar-metallicity tracks is always less than 0.1 magnitudes for the masses where the two sets of tracks overlap and for most masses is less than 0.03 magnitudes. The high metallicity model should be considered only as a limiting case since such a high metallicity is not expected. The use of such a wide range of metallicities allows us to estimate the importance of this parameter on the final IMF determination.
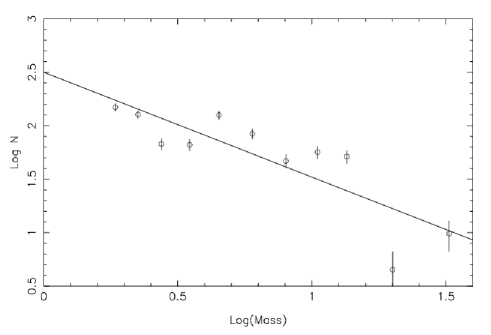
Given these sets of mass bins, for each metallicity we determine the number of stars per unit logarithmic mass interval after correcting for completeness. We then fit a power law to the data. The two lowest-mass bins (), where incompleteness was significant, were excluded from the fit; uncertainty in the completeness correction applied could significantly influence the results in these mass bins. The resulting completeness-corrected IMF for the cluster is plotted in Figure 17. The solar-metallicity models yield an IMF slope , where the quoted errors are only the formal fit errors and should be considered an underestimate. The low-metallicity tracks yield for the same distance, suggesting that the cluster IMF determination is insensitive to metallicity for solar and sub-solar values. The tracks give .
4.1.3 Comparison of the IMF Methods
The IMF slopes we derive using these two methods are marginally consistent within the error bars: for the KLF method, and for the CMD + spectroscopy method assuming solar metallicity. Comparing these results individually to the Salpeter slope would lead to different conclusions, however. The KLF method produces a slope that is very close to the Salpeter value, while the slope from the CMD + spectroscopy method differs from Salpeter by about 2. While this difference in slopes could arise purely from statistical uncertainty, various systematic effects should cause the KLF-derived slope to be steeper than the CMD-derived slope, as we observe. If the more massive stars are preferentially located toward the center of the cluster, as expected due to mass segregation, and if the extinction is higher in the center of the cluster, the mean extinction used in the KLF determination would be systematically low for the more massive stars. This method would then underestimate the masses the highest mass stars, thus steepening the slope of the IMF. Evidence that this effect may be at work is provided by the six brightest cluster members, all of which lie redward of the ZAMS in Figure 11 while the fainter members are scattered more evenly. A difference in (and thus ) of 0.2 corresponds to 1-2 subtypes for massive stars and thus to a difference in the derived mass of at least 2 M⊙.
However, mass segregation can only provide a partial explanation for the difference in the IMF slopes; the stars for which we obtained spectra are not in the very center of the cluster (since crowding in the 2MASS image used to select spectroscopic targets prevented us from selecting targets in the cluster core). An additional possible source of systematic error in the KLF method relative to the CMD method lies in field star rejection. In addition to the statistical field star rejection described in §3.2.1, which was done before any further analysis and thus applies to both methods, the CMD method has color-based field star rejection. The CMD method can reject foreground objects, which due to lower extinction are bluer than cluster objects, as well as background objects which are redder than the cluster. The KLF method includes these objects, which tend to be fainter on average than the cluster stars (since they are either at a greater distance or are low-mass foreground stars) and thus finds an artificially high number of low-mass stars. We find the use of photometry alone to derive the IMF is likely to produce an overly steep IMF in regions with significant field contamination or variable extinction.
4.1.4 Comparison With Other Young Stellar Clusters
Most studies of young star clusters have found an initial mass function consistent with the Salpeter slope of , generally with uncertainties of 0.1-0.2 (e.g. Figuerêdo et al., 2002; Massey & Hunter, 1998; Hillenbrand & Carpenter, 2000; Okumura et al., 2000), including the extremely massive R136 cluster in the LMC (Massey & Hunter, 1998). A review of the results is provided in Massey (2003). In the case of NGC 6611, reanalysis of the same data by different authors has produced dramatically different results; an IMF of was found by Hillenbrand et al. (1993), while a reanalysis with different treatment of extinction produced (Massey et al., 1995), suggesting that the systematic effects are at work in IMF determinations that are at least as important as the statistical errors, as we see in this work. Slopes significantly flatter than Salpeter have been reported for the Arches cluster near the Galactic Center (Figer et al., 1999), though later work suggests that this result is an artifact of mass segregation; Stolte et al. (2002) found a very flat IMF in the core of the Arches Cluster with a steeper IMF at larger radii, with an overall slope consistent with a Salpeter value. The flatness we observe in both the KLF and the IMF for the G305+00.2 cluster using the CMD + spectroscopy method may similarly be due to mass segregation. In addition to the extinction effects mentioned previously, fainter stars in the outskirts of the cluster could be indistinguishable from the field star density (especially given the high field star density due to the location of the cluster in the Galactic plane) and not fall within the cluster boundaries we employ.
4.2. The KLF for the G353.4-0.36 cluster
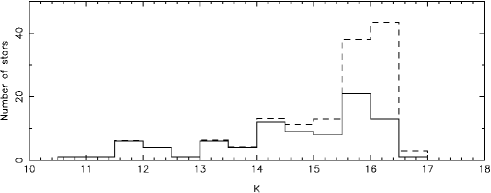
Completeness tests were performed for the G353.4-0.36 cluster using artificial stars as discussed above, and the completeness-corrected KLF is plotted in Figure 18. Since the cluster is significantly less crowded and faint cluster stars less common, our detections in this cluster are nearly complete in K, even though our detection limit is brighter than in the G305.3+0.2 cluster. The turnover at appears to be genuine rather than an artifact of completeness. Perhaps lower-mass stars in this cluster are still more deeply embedded in the gas and dust, and thus we observe only the massive objects.
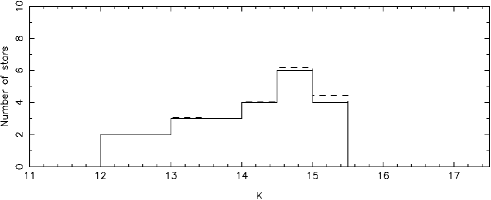
Due to the small number of stars detected in this cluster (, only 7 of which were detected in ) and to the early evolutionary stage of the objects, we did not attempt to determine an IMF for this cluster or to place objects on the ZAMS. While the individual objects we observed in the G353.4-0.36 cluster were intriguing and worthy of further study, we cannot analyze the cluster as a whole because there are so few objects.
This cluster is a very promising target for study at other wavelengths more suited than the NIR to the study of YSOs and even earlier stages of star formation; the methanol masers and likely presence of massive YSOs suggest that several stages of massive star formation can be studied in this region.
5. Summary
We present NIR images and spectroscopy of two young stellar clusters near radio sources G353.4-0.36 and G305+00.2. Our -band spectrum of the brightest cluster star in the G305+00.2 cluster show it to be an O5Ib-O6Ib star. Although the range of luminosities of supergiants prevents us from determining an exact distance, this identification suggests a larger distance than radio distance to the nearby methanol masers (Walsh et al., 1997) of 3.3 kpc. We also obtained spectra of early two B stars in the cluster. There was no nebular emission present in the G305+00.2 cluster, though a ridge of nebular emission, coinciding with 8 µm emission and masers, is present 1′ away and may indicate sequential star formation, with the masers and gas indicating ongoing star formation and the cluster the result of earlier star formation. We computed the KLF and IMF of this cluster, and found them to be steeper than that reported for most young clusters ( for the more reliable CMD-based method) but generally consistent with the Salpeter value. We find that computing the IMF based only on a single color of photometry is prone to systematic errors when differential extinction and field-star contamination are significant.
Our -band spectra of two of the three stars we observed in the G353.4-0.36 cluster were featureless, while the other showed CO absorption, which is consistent either with a cool foreground giant or a YSO. The absolute magnitudes derived based on the distance to the radio sources are too bright for these objects to be solar-mass YSOs. None of the objects were detected in our -band photometry, making identification as YSOs based on NIR excess impossible. They remain candidate massive YSOs, and observations at other wavelengths are needed to make a positive identification. The images of this cluster showed a region with intense nebular emission embedded in a very dark cloud where earlier stages of star formation are progressing.
| RA | DEC | Photometry | Spectral Properties | Spectral | |||||
|---|---|---|---|---|---|---|---|---|---|
| Star | 13 | -62o | J | H | K | Species | (m) | EW (Å) | Type |
| A1 | 41s.04 | 32′ 56″.8 | 11.75(1) | 10.39(3)aa2MASS magnitude | 9.58(3)aa2MASS magnitude | Br | 2.166 | -5.70.6 | O5V-O6V |
| N III | 2.116 | -2.70.7 | |||||||
| C IV | 2.078 | -0.8 | |||||||
| A2 | 33s.88 | 33′ 27″.1 | 12.310(1) | 11.02(3)aa2MASS magnitude | 10.34(2)aa2MASS magnitude | Br | 2.166 | 6.21.2 | B0V-B1V |
| He I | 2.112 | 0.70.2 | |||||||
| A3 | 39s.50 | 33′ 28″.2 | 14.063(4) | 12.646(4) | 11.97(2) | Br | 2.166 | 5.91.3 | B2V-B3V |
| RA (J2000) | DEC (J2000) | J | J | H | H | K | K |
|---|---|---|---|---|---|---|---|
| 13:11:41.040 | -62:32:56.77 | 11.751 | 0.010 | 10.394 | 0.027 | 9.575 | 0.029 |
| 13:11:33.877 | -62:33:27.12 | 12.310 | 0.001 | 11.020 | 0.027 | 10.342 | 0.023 |
| 13:11:39.503 | -62:33:28.17 | 14.063 | 0.004 | 12.646 | 0.004 | 11.969 | 0.018 |
| 13:11:37.680 | -62:33:09.60 | 11.949 | 0.041 | 10.776 | 0.047 | 10.185 | 0.037 |
| 13:11:36.286 | -62:33:13.30 | 12.488 | 0.010 | 11.519 | 0.001 | 10.655 | 0.037 |
| 13:11:41.620 | -62:33:17.40 | 12.936 | 0.029 | 11.650 | 0.038 | 10.953 | 0.034 |
| 13:11:41.111 | -62:33:18.39 | 16.309 | 0.036 | 14.514 | 0.018 | 11.142 | 0.002 |
| 13:11:39.268 | -62:33:24.85 | 13.467 | 0.003 | 12.095 | 0.003 | 11.494 | 0.018 |
| 13:11:39.439 | -62:33:03.63 | 13.218 | 0.003 | 12.018 | 0.002 | 11.524 | 0.018 |
| 13:11:43.767 | -62:33:26.39 | 16.065 | 0.104 | 13.312 | 0.003 | 11.594 | 0.018 |
| 13:11:40.045 | -62:33:18.89 | 13.549 | 0.006 | 12.236 | 0.006 | 11.596 | 0.018 |
| 13:11:38.141 | -62:33:13.66 | 13.428 | 0.003 | 12.270 | 0.003 | 11.745 | 0.018 |
| 13:11:39.493 | -62:33:10.25 | 16.021 | 0.129 | 14.851 | 0.116 | 11.860 | 0.004 |
| 13:11:40.458 | -62:33:03.65 | 15.989 | 0.019 | 14.766 | 0.029 | 11.920 | 0.003 |
| 13:11:40.021 | -62:33:07.26 | 13.884 | 0.004 | 12.591 | 0.003 | 11.970 | 0.018 |
| 13:11:40.992 | -62:33:07.86 | 14.258 | 0.005 | 12.845 | 0.005 | 12.123 | 0.018 |
| 13:11:36.748 | -62:33:11.14 | 14.115 | 0.010 | 12.898 | 0.005 | 12.153 | 0.053 |
| 13:11:34.747 | -62:33:24.02 | 14.067 | 0.010 | 12.742 | 0.002 | 12.311 | 0.029 |
| 13:11:34.525 | -62:33:11.13 | 14.362 | 0.010 | 12.969 | 0.004 | 12.334 | 0.044 |
| 13:11:40.031 | -62:33:11.38 | 14.315 | 0.010 | 13.098 | 0.014 | 12.518 | 0.018 |
| 13:11:40.433 | -62:33:23.29 | 17.628 | 0.108 | 15.615 | 0.049 | 12.698 | 0.005 |
| 13:11:39.217 | -62:33:08.44 | 14.799 | 0.010 | 13.578 | 0.007 | 12.789 | 0.164 |
| 13:11:38.080 | -62:32:59.21 | 16.267 | 0.017 | 13.972 | 0.005 | 12.872 | 0.018 |
Note. — The complete version of this table is in the electronic edition of the Journal. The printed edition contains only a sample.
| ID | RA (2000) | DEC (2000) | J | H | K |
|---|---|---|---|---|---|
| B1 | 17:30:27.8 | -34:41:28.1 | 14.14 | 12.85 | |
| B2 | 17:30:27.9 | -34:41:34.7 | 14.59 | 13.47 | |
| B3 | 17:30:27.8 | -34:41:40 | 14.38 |
References
- Argon et al. (2000) Argon, A. L., Reid, M. J., & Menten, K. M. 2000, ApJS, 129, 159
- Becker et al. (1994) Becker, R. H., White, R. L., Helfand, D. J., & Zoonematkermani, S. 1994, ApJS, 91, 347
- Bessell & Brett (1988) Bessell, M. S. & Brett, J.M. 1988, PASP, 100, 1134
- Blum et al. (1997) Blum, R. D., Ramond, T. M., Conti, P. S., Figer, D. F., & Sellgren, K. 1997, AJ, 113, 1855
- Blum et al. (2000) Blum, R. D., Conti, P. S., & Damineli, A. 2000, AJ, 119, 1860
- Blum, Damineli, & Conti (2001) Blum, R. D., Damineli, A., & Conti, P. S. 2001, AJ, 121, 3149
- Bloom et al. (2002) Bloom, J. S. et al. 2002, ApJ, 572, L45
- Carey et al. (2000) Carey, S. J., Feldman, P. A., Redman, R. O., Egan, M. P., MacLeod, J. M., & Price, S. D. 2000, ApJ, 543, L157
- Carpenter (2003) Carpenter, J. 2003, http://www.astro.caltech.edu/ jmc/2mass/v3/transformations/
- Caswell et al. (1995) Caswell, J. L., Vaile, R. A., & Forster, J. R. 1995, MNRAS277, 210
- Caswell et al. (2000) Caswell, J. L., Yi, J., Booth, R. S., & Cragg, D. M. 2000, MNRAS313, 599
- Chakraborty et al. (2000) Chakraborty, A., Ojha, D. K., Anandarao, B. G., & Rengarajan, T. N. 2000, A&A, 364, 688
- Chan, Henning, & Schreyer (1996) Chan, S. J., Henning, T., & Schreyer, K. 1996, A&AS, 115, 285
- Clark & Porter (2004) Clark, J.S. & Porter, J.M. 2004, A&A, 427, 839
- Conti & Blum (2002) Conti, P. S. & Blum, R. D. 2002, ApJ, 564, 827
- Cotera et al. (1996) Cotera, A. S., Erickson, E. F., Colgan, S. W. J., Simpson, J. P., Allen, D. A., Burton, M. G. 1996, ApJ, 461, 750
- Cotera et al. (1999) Cotera, A. S., Simpson, J. P., Erickson, E. F., Colgan, S. W. J., Burton, M. G., & Allen, D. A. 1999, ApJ, 510, 747
- Cotera & Leistra (2005) Cotera, A. S. & Leistra, A. L. 2005, in prep.
- Dutra & Bica (2001) Dutra, C. M. & Bica, E. 2001, A&A, 376, 434
- Dutra & Bica (2000) Dutra, C. M. & Bica, E. 2000, A&A, 359, 9
- Dutra et al. (2003) Dutra, C. M., Ortolani, S., Bica, E., Barbuy, B., Zocalli, M., & Momany, Y. 2003, A&A, 408, 127
- Dutra et al. (2003b) Dutra, C.M., Bica, E., Soares, J., & Burbuy, B. 2003, A&A, 400, 533
- Elmegreen et al. (2000) Elmegreen, B. G., Efrernov, Y., Pudritz, R. E., & Zinecker, H. 2000, in Protostars & Planets IV: University of Arizona Press; eds. Mannings, V., Boss, A. P., & Russell, S. S., 841
- Figer, Morris, & McLean (1996) Figer, D. F., Morris, M., & McLean, I. S. 1996, in The Galactic Center: Astronomical Society of the Pacific Conference Series; ed Grebel, R., 263
- Figer et al. (1999) Figer, D. F., Kim, S. S., Morris, M., Serabyn, E., Rich, R. M., & McLean, I. S. 1999, ApJ, 525, 750
- Figuerêdo et al. (2002) Figuerêdo, E., Blum, R. D., Damineli, A., & Conti, P. S. 2002, AJ, 124, 2739
- Forster & Caswell (2000) Forster, J. R. & Caswell, J. L. 2000, ApJ, 530, 371
- Gardner & Whiteoak (1978) Gardner, F. F. & Whiteoak, J. B. 1978, MNRAS, 183, 711
- Gardner & Whiteoak (1978) Gardner, F. F. & Whiteoak, J. B. 1984, MNRAS, 210, 23
- Greene & Lada (1996) Greene, T. P. & Lada, C. J. 1996, AJ, 112, 2184
- Hanson & Conti (1995) Hanson, M. M. & Conti, P. S. 1995, ApJ, 448, L45
- Hanson et al. (1996) Hanson, M. M., Conti, P. S., & Rieke, M. J. 1996, ApJS, 525, 750
- Hanson, Hayworth, & Conti (1997) Hanson, M. M., Howarth, I. W., & Conti, P. S. 1997, ApJ, 489, 698
- Harju et al. (1998) Harju, J., Lehtinen, K., Booth, R. S., & Zinchenko, I. 1998, A&AS, 132, 211
- Hillenbrand et al. (1993) Hillenbrand, L. A., Massey, P., Strom, S. E., & Merril, M. K. 1993, AJ, 106, 1906
- Hillenbrand & Carpenter (2000) Hillenbrand, L. A. & Carpenter, J. M. 2000, ApJ, 540, 236
- Huang et al. (1999) Huang et al. 1999, ApJ, 517, 282
- Ishii et al. (2001) Ishii, M., Nagata, T., Sato, S., Yao, Y., Jiang, Z., & Nakaya, H. 2001, AJ, 121, 3191
- Johnson (1966) Johnson, H. L. 1966, ARA&A, 4, 193
- Lada & Lada (2003) Lada, C. J. & Lada, E. A. ARA&A, 41, 57
- Maeder (1981) Maeder, A. 1981, A&A, 101, 385
- Malagnini et al. (1986) Malagnini, M. L., Morossi, C., Rossi, L. & Kurucz, R. L. 1986, A&A, 162, 140
- Massey et al. (1995) Massey, P., Johnson, K. E., & DeGioia-Eastwood, K. 1995, ApJ, 454, 151
- Massey & Hunter (1998) Massey, P. & Hunter, D. 1998, ApJ, 493, 180
- Massey (2002) Massey, P. 2002, ApJS, 141, 81
- Massey (2003) Massey, P. 2003, ARA&A, 41, 15
- Meynet & Maeder (2003) Meynet, G. & Maeder, A. 2003, A&A, 404, 975
- Morris & Serabyn (1996) Morris, M. & Serabyn, E. 1996, ARA&A, 34, 645
- Mowlavi et al. (1998) Mowlavi, N., Schaerer, D., Meynet, G., Bernasconi, P. A., Charbonnel, C., & Maeder, A. 1998, A&AS, 128, 471
- Nagata et al. (1990) Nagata, T., Woodward, C. E., Shure, M., Phipher, J. L., & Okuda, H. 1990, ApJ, 351, 83
- Nagata et al. (1995) Nagata, T., Woodward, C. E., Shure, M., & Kobayashi, N. 1995, AJ, 109, 1676
- Oasa, Tamura, & Sugitani (1999) Oasa, Y., Tamura, M., & Sugitani, K. 1999, ApJ, 526, 336
- Okumura et al. (2000) Okumura, S., Atsushui, M., Nishihara, E., Watanabe, E., & Yamashita, T. 2000, ApJ, 543, 799
- Price et al. (2002) Price, P. A. et al. 2002, ApJ, 572, L51
- Repolust et al. (2004) Repolust, T., Puls, J., & Herrero, A. 2004, A&A, 415, 349
- Rieke & Lebofsky (1985) Rieke, G. H. & Lebofsky, M. J. 1985, ApJ, 288, 618
- Schaller et al. (1992) Schaller, G., Schaerer, D., Meynet, G., & Maeder, A. 1992, A&AS, 96, 269
- Stolte et al. (2002) Stolte, A., Grebel, E. K., Brandner, W.,& Figer, D. F. 2002, A&A, 394, 459
- Vacca, Garmany, & Shull (1996) Vacca, W. D., Garmany, C. D., & Shull, J. M. 1996, ApJ, 460, 914
- Val’tts et al. (2000) Val’tts, I. E., Ellingsen, S. P., Slysh, V. I., Kalenskii, S. V., Otrupcek, R. & Larionov, G. M. 2000, MNRAS, 317, 315
- Walsh et al. (1997) Walsh, A. J., Hyland, A. R., Robinson, G., & Burton, M.G. 1997, MNRAS, 291, 261
- Wegner (1994) Wegner, W. 1994, MNRAS, 270, 229
- Whiteoak, Otrupcek, & Rennie (1982) Whiteoak, J. B., Otrupcek, R. E., & Rennie, C. J. 1982, PASAu, 4, 434
- Wilson & Mezger (1970) Wilson, T. L, & Mezger, P. G. 1970, A&A, 6, 364
- Wood & Churchwell (1989) Wood, D. O. & Churchwell, E. 1989, ApJ, 340, 265
- Zinchenko, Henkel, & Mao (2000) Zinchenko, I., Henkel, C., & Mao, R.Q. 2000, A&A, 361, 1079