The age dependence of halo clustering
Abstract
We use a very large simulation of the concordance CDM cosmogony to study the clustering of dark matter haloes. For haloes less massive than about the amplitude of the two-point correlation function on large scales depends strongly on halo formation time. Haloes that assembled at high redshift are substantially more clustered than those that assembled more recently. The effect is a smooth function of halo formation time and its amplitude increases with decreasing halo mass. At the “oldest” 10% of haloes are more than 5 times more strongly correlated than the “youngest” 10%. This unexpected result is incompatible with the standard excursion set theory for structure growth, and it contradicts a fundamental assumption of the halo occupation distribution models often used to study galaxy clustering, namely that the galaxy content of a halo of given mass is statistically independent of its larger scale environment.
keywords:
methods: N-body simulations – methods: numerical –dark matter – galaxies: haloes – galaxies: clusters: generalThe age dependence of halo clustering
1 Introduction
Galaxy properties vary systematically with environment. Galaxies in dense regions are more massive, more gas-poor, more bulge-dominated, and have fewer young stars than those in low density regions. In standard formation models, galaxies condense at the centres of a hierarchically merging population of dark haloes (White & Rees 1978). Many recent models reproduce environmental effects by putting early-type galaxies predominantly in massive haloes, late-type galaxies in lower mass halos, while assuming the galaxy population in a halo of given mass to be independent of where the halo lies (e.g. Kauffmann, Nusser & Steinmetz 1997; Jing, Mo & Börner, 1998; Benson et al 2000; Peacock & Smith 2000; Wechsler et al 2001; Berlind et al 2003; van den Bosch, Yang & Mo 2003). This assumption is justified by the standard excursion-set description of structure formation (Bond et al 1991; Lacey & Cole 1993; Mo & White 1996) where it follows from the Markov nature of the underlying random walks (White 1996). It is also supported by the simulation results of Lemson & Kauffmann (1999) and Percival et al (2003) which detected no dependence of halo clustering on properties such as concentration or formation time. In contrast, the study of Sheth & Tormen (2004) found that “haloes in dense regions form at slightly earlier times than haloes of the same mass in less dense regions”.
In this Letter, we reevaluate the relation between environment and formation history for dark haloes. In contrast with previous work, we find the clustering at given mass to depend strongly on formation time; low mass haloes that assemble early are much more strongly clustered than those that assemble late. This dependence was missed in most earlier numerical work because it is strongest at low masses.
The outline of our paper is as follows. In Section 2, we briefly introduce the simulation used for our study. In Section 3, we compare the mean halo bias measured from this simulation with the results of others and with analytical models. In Section 4, we present our results for the dependence of spatial clustering on halo formation time. Finally we give a short summary and discussion.
2 The simulation
The simulation used in this study is the so-called “Millennium Simulation” carried out by the Virgo Consortium (Springel et al. 2005). This simulation adopted concordance values for the parameters of a flat CDM cosmological model, , for the current densities in Cold Dark Matter and baryons, for the present dimensionless value of the Hubble constant, for the rms linear mass fluctuation in a sphere of radius Mpc extrapolated to , and for the slope of the primordial fluctuation spectrum. The simulation followed dark matter particles from to the present-day within a cubic region Mpc on a side. The individual particle mass is thus , and the gravitational force had a Plummer-equivalent comoving softening of kpc. Initial conditions were set using the Boltzmann code CMBFAST (Seljak & Zaldarriaga 1996) to generate a realisation of the desired power spectrum which was then imposed on a glass-like uniform particle load (White 1996).
The TREE-PM N-body code GADGET2 (Springel 2005) was used to carry out the simulation and the full data were stored at times spaced approximately equally in the logarithm of the expansion factor. This allowed us to build trees which store detailed assembly histories for each of the million dark matter haloes at that contain at least particles according to a FOF group finder with (Davis et al 1985). This is the set of haloes we analyse in the remainder of this paper.
3 Mean halo bias as a function of mass and redshift
Dark matter haloes are biased tracers of the underlying mass density field, and models for the strength of this bias can be constructed using the excursion set formalism of Bond et al (1991) and Lacey & Cole (1993). Within this framework Mo & White (1996) and Sheth, Mo & Tormen (2000) derived analytic expressions for halo bias and tested them against N-body simulations of a variety of cosmogonies (see also Cole & Kaiser (1989)). The linear density field can be represented by , the rms linear mass fluctuation (extrapolated to redshift ) within a sphere which on average contains mass . A characteristic mass for clustering can then be defined through . Haloes more massive than are predicted to be positively biased (i.e. more strongly clustered) relative to the underlying mass, while the opposite is true for less massive haloes. The tests in Mo & White (1996) showed the autocorrelation function for dark matter haloes of mass to be approximately parallel to that of the mass,
| (1) |
where the “bias factor” is given by
| (2) |
Here is the critical linear overdensity at collapse and depends slightly on cosmology; we use values from Eke et al. (1996). is the dimensionless amplitude of fluctuations that produce haloes of mass at redshift .
Recent high resolution -body simulations have qualitatively confirmed this model and the improved version of Sheth, Mo & Tormen (2000), but quantitative fits show some deviations (Jing 1998; Governato et al 1998; Colberg et al 2000; Kravtsov & Klypin 1999; Seljak & Warren 2004; Mandelbaum et al. 2005). Here we use the unprecedented dynamic range and statistics of the Millennium Simulation to study this bias relation further.
For haloes of given mass and redshift, we derive a bias factor by comparing their two point correlation function to that of the mass. More specifically, we estimate as the relative normalisation factor which minimizes the mean square difference in for four equal width bins in spanning the separation range . In this range the measured correlations are all in the quasilinear regime. Since is a steep function of for , it is important to select halo samples in relatively narrow mass ranges in order to determine accurately at high mass. Here we choose mass bins of width . The measured bias factors for the Millennium Simulation are shown by the symbols in Fig. 1. Note that we plot bias as a function of peak height in order that the predicted relations for different redshifts coincide. Different symbols denote the measured bias factors for different redshifts. For comparison, we overplot the analytic expressions which other authors have derived theoretically or given as fits to their own numerical data.
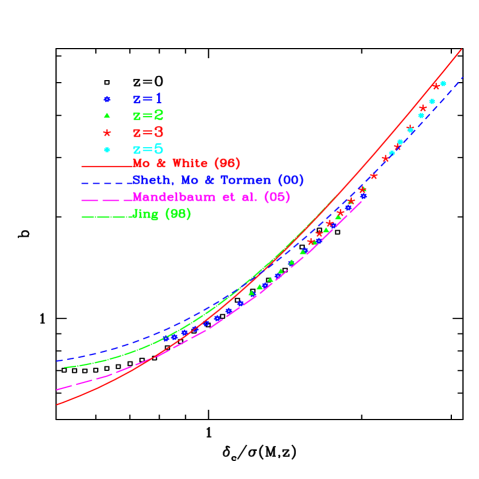
The first noticeable feature is that when plotted in this way depends at most weakly on redshift; at fixed , the bias factors for different redshift are almost identical provided that the critical overdensity is calculated according to the recipe of Eke et al (1996). Our results also agree well with previous work, lying within the scatter of results from earlier large numerical studies. Agreement is not perfect, however. As first noted by Jing (1998), the analytic formula of Mo & White (1996) overestimates the bias factor at high mass and underestimates it at low mass. These deficiencies are partially corrected by the ellipsoidal collapse formula of Sheth, Mo & Tormen (2000), but the scatter between the numerical results of Jing (1998), Mandelbaum et al (2005) and this paper is too large to allow any definitive conclusion. Possible explanations for this scatter are differing numerical methods for identifying haloes and for estimating , differing numerical codes to set initial conditions and integrate the evolution, different-sized simulation volumes, differing assumed cosmologies, and analytic fits which incompletely represent the numerical data. The scatter in our figure is a measure of the remaining uncertainty in the mean halo bias. It is much smaller than the systematic variation with halo formation time which we turn to next.
4 The dependence of clustering on formation time
The formation time of a dark matter halo is conventionally defined as the redshift when half of its final mass is first assembled into a single object. For each halo with more than 64 particles (according to a standard FOF () group-finder) we follow the stored merging tree to find the earliest time when the most massive progenitor had more than half the final mass. By linearly interpolating its mass between this and the immediately preceding output, we estimate the redshift when it had exactly half the final mass. This we take as the halo formation time.
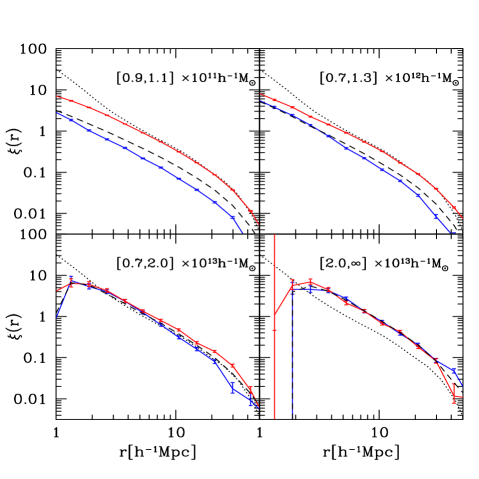
We examine the formation time dependence of the bias of haloes as follows. For haloes in various mass bins we calculate two-point correlation functions and bias factors both for the population as a whole and for subsamples split according to formation time. We refer to haloes with early formation times as “old” and to haloes with recent formation times as “young”. Fig. 2 shows results for four different mass ranges. Each panel compares the autocorrelation function for all the haloes in the given mass range both with that of the underlying dark matter and with autocorrelation functions for subsamples made up of the 20% oldest and 20% youngest haloes. For haloes of and the dependence of clustering on formation time is strong and increases systematically with increasing length-scale. The effect is detectable but weak at . It is undetectable for haloes more massive than .
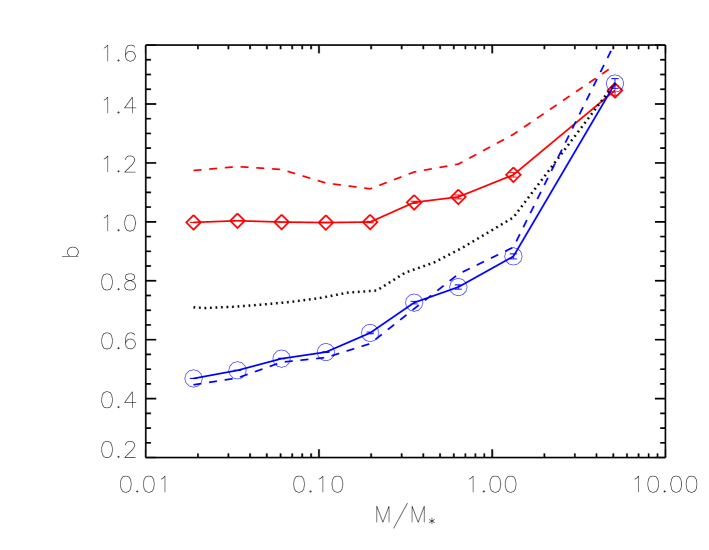
In Fig. 3 we show more directly how the formation time dependence of clustering varies with halo mass. We divide the haloes into a series of mass bins of width . In each bin we estimate bias factors as described above for the halo population as a whole and for the 10 and 20% tails of oldest and youngest haloes. The plot shows clearly that the relative bias of old versus young haloes increases smoothly with decreasing halo mass. The bias of the 10% youngest haloes is only slightly stronger than that of the 20% youngest haloes, but the 10% oldest haloes are significantly more clustered than the 20% oldest haloes. The effects become very large for the lowest masses that we resolve. At the large-scale autocorrelation amplitude for the 10% oldest haloes is more than 5 times that for the 10% youngest haloes.
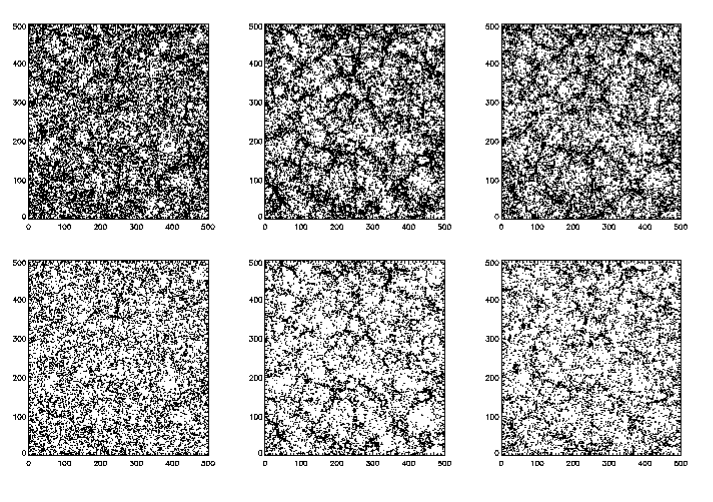
In Fig. 4, we provide some images to give a visual impression of the relative distributions of “young” and “old” haloes. Here we show haloes with FOF particle number in the range in a slice through the Millennium Simulation thick. The top row shows the positions of the 20% youngest of these haloes (left), of the 20% oldest (middle), and of an equal number of dark matter particles selected at random within the slice (right). The bottom row shows corresponding plots for the 10% tails. It is striking that although the haloes (by definition) avoid massive clumps in the dark matter distribution, the old haloes follow the large-scale cosmic web quite closely, while the distribution of young haloes looks almost uniform.
Fig. 5 explores the formation time dependence of the clustering bias in more detail. We take the sample of all haloes with particle number in the range and we split it into ten equal-sized subsamples by formation time. We then compute bias factors and mean formation redshifts for each of these subsamples and plot one against the other. While the variation of bias with formation time is smooth, the strongest effects clearly occur for the “oldest” haloes. Notice also that the variation in mean formation redshift is large, ranging from for the youngest 10% to for the oldest 10%. The mean formation redshift for the population as a whole is .

5 Discussion and conclusions
In this Letter, we have used the very large Millennium Simulation (Springel et al 2005) to study how the clustering of dark haloes depends on mass and formation time. Our results for the mean dependence of bias on mass agree well with those of other workers, but for low mass haloes, , we find a strong and unexpected dependence on formation time. Haloes of given mass that assembled at high redshift are substantially more strongly clustered than haloes of the same mass that assembled recently. This difference persists to large scale, and indeed is larger on scales of order Mpc than on scales of order Mpc. Although there is unavoidably some arbitrariness in our definitions of halo mass and formation time, experiments with alternative definitions of each quantity produce bias variations which are typically of order 10%. Our basic result thus appears robust.
This result is unexpected because the sharp -space filter used in most formulations of the excursion set model for structure formation (Bond et al 1991; Lacey & Cole 1993) causes the random walks as a function of smoothing scale on which the model is based to have Markovian character. The formation history of a halo is encoded in the random walk at higher mass resolution than that which defines the halo itself, and is thus statistically independent of the environment, which is encoded in the random walk at lower resolution (White 1996). This independence of history and environment appeared confirmed by the simulation analyses of Lemson & Kauffmann (1999) and Percival et al.(2003). These concentrated on relatively massive objects for which the effects we find are small, probably undetectable with volumes of the size analysed. A formation time dependence was seen, however, in the mark correlation analysis of Sheth & Tormen (2004), although these authors characterised the effect as “slight”.
Independence of history and environment for haloes of given mass is assumed in many theoretical models for galaxy formation. For example, Kauffmann, Nusser & Steinmetz (1997), Benson et al (2000) and Wechsler et al (2001) populate haloes in dark matter simulations by using semi-analytic models applied to a Monte Carlo realisation of each halo’s history depending only on its mass. Halo occupation distribution models such as those of Jing, Mo & Börner (1998), Peacock & Smith (2000), Berlind et al (2003) or van den Bosch, Yang & Mo (2003) ignore formation histories altogether and assume a priori that the galaxy population of a halo depends on mass alone, independent (at fixed mass) of the larger scale environment.
In practice, haloes similar in mass to that of the Milky Way contain a substantial fraction of the galaxies in typical observational surveys. Since it is plausible that galaxxy properties should depend significantly on the assembly history of their haloes, our results suggest that models which ignore the age dependence of halo clustering will incorrectly predict the large-scale distribution of galaxies. The extent of the problem may depend on the specific galaxy formation model considered. We will estimate its size for a typical “successful” model in a future paper.
Finally we note that galaxy formation models which explicitly follow the assembly history of each halo should be immune to this problem. Examples of such models which graft a semi-analytic treatment of baryon physics onto a N-body simulation can be found in Kauffmann et al (1999), Springel et al (2001, 2005), Helly et al (2003), Hatton et al (2003) and Kang et al (2005). Cosmological simulations which follow the baryonic physics directly should also be safe, although it is not yet computationally feasible to simulate galaxy formation reliably throughout a big enough volume for the effects discussed here to dominate the errors.
Acknowledgements
We are grateful to Adrian Jenkins and Carlos Frenk for detailed comments on our paper. GL also thanks Yipeng Jing and Darren Croton for useful discussions. The simulation used in this paper was carried out as part of the programme of the Virgo Consortium on the Regatta supercomputer of the Computing Centre of the Max-Planck-Society in Garching.
References
- [Benson et al. (2000)] Benson A. J., Cole S., Frenk C. S., Baugh C. M., Lacey C. G., 2000, MNRAS, 311, 793
- [Bond et al. (1991)] Bond, J. R., Cole S., Efstathiou G., Kaiser N., 1991, ApJ, 379, 440
- [Berlind et al. (2003)] Berlind A. et al., 2003, ApJ, 593, 1
- [Colberg et al. (2000)] Colberg J. M., White S. D. M., Yoshida N., Macfarland T. J., Jenkins A., Frenk C. S. et al., 2000, MNRAS, 319, 209
- [Cole &Kaiser (1989)] Cole S., Kaiser N., 1989, MNRAS, 237, 1127
- [Davis et al. (1985)] Davis M., Efstathiou G., Frenk C. S., White S. D. M., 1985, ApJ, 292, 371
- [Governato et al. (1996)] Governato F., Baubul A., Quinn T., Tozzi P., Baugh C. M., Katz N., Lake G., 1999, MNRAS, 307, 949
- [Hatton et al. (2003)] Hatton S., Devriendt J. E. G., Ninin S., Bouchet F. R., Guiderdoni B., Vibert D., 2003, MNRAS, 343, 75
- [Helly et al. (2003)] Helly J. C., Cole S., Frenk C. S., Baugh C. M., Benson A., Lacey C., 2003, MNRAS, 338, 913
- [Jing et al. (1998)] Jing Y. P., 1998, ApJ, 503, 9
- [Jing et al. (1998)] Jing Y. P., Mo H. J., Börner, 1998, ApJ, 494, 1
- [Kang et al. (2005)] Kang X., Jing Y. P., Mo H. J., Boerner G., 2005, ApJ in press, astro-ph/0408475
- [Kauffmann et al. (1997)] Kauffmann G., Nusser A., Steinmetz M., 1997, MNRAS, 286, 795
- [Kauffmann et al. (1999)] Kauffmann G., Colberg J. M., Diaferio A., White S. D. M., 1999, MNRAS, 307, 529
- [Kravtsov et al. (1999)] Kravtsov A. V., Klypin A. A., 1999, ApJ, 520, 437
- [Lemson &Kauffmann (1999)] Lemson G., Kauffmann G., 1999, MNRAS, 302, 111
- [Lacey &Cole (1993)] Lacey C., Cole S., 1993, MNRAS, 262, 627
- [Mandelbaum et al. (2005)] Mandelbaum R., Tasitsiomi A., Seljak U., Kravtsov A. V., Wechsler R. H., 2005, MNRAS submitted, astro-ph/0410711
- [Mo &White (1996)] Mo H. J., White S. D. M., 1996, MNRAS, 282, 347
- [Peacock &Smith (2000)] Peacock J. A., Smith R. E., 2000, MNRAS, 318, 1144
- [Percival et al. (2003)] Percival W. J., Scott D., Peacock J. A., Dunlop J. S., 2003, MNRAS, 338, 31L
- [Seljak et al. (1996)] Seljak U., Zaldarriaga M., 1996, ApJ, 469, 437
- [Seljak &Warren (2004)] Seljak U., Warren M. S., 2004, MNRAS, 355, 129
- [Sheth & Tormen (2000)] Sheth R. K., Mo H. J., Tormen G., 2000, MNRAS, 329, 61S
- [Sheth & Tormen (2004)] Sheth R. K, Tormen G., 2004, 350, 1385
- [Springel et al. (2001)] Springel V., White S. D. M., Tormen G., Kauffmann G., 2001, MNRAS, 328, 726
- [Springel (2005)] Springel V., 2005, MNRAS submitted, astro-ph/0505010
- [Springel et al. (2005)] Springel V. et al., 2005, Nature, 435, 639
- [Van den Bosch et al. (2003)] Van den Bosch F. C., Yang X., Mo H. J., 2003, MNRAS, 340, 771
- [Wechsler et al. (2001)] Wechsler R. H. et al., 2001, ApJ, 554, 85
- [White &Rees (1978)] White S. D. M., Rees M., 1978, MNRAS, 183, 341
- [White (1996)] White S. D. M., 1996, in Schaeffer R., Silk J., Spiro M., Zinn-Justin J., eds, Cosmology and Large Scale Structure, Les Houches Session LX. Elsevier, Amsterdam, P.77 s