2 XD12 NASA Marshall Space Flight Center, Huntsville, AL 35812, USA
3 NASA Goddard Space Flight Center, Code 661, Greenbelt, MD 20771, USA
4 Joint Center for Astrophysics, Depart. of Physics, University of Maryland, Baltimore County, MD 21250, USA
INTEGRAL observations of the Be/X-ray binary EXO 2030+375 during outburst
We present a type–I outburst of the high-mass X–ray binary EXO 2030+375, detected during INTEGRAL’s Performance and Verification phase in December 2002 (on–source time about seconds). In addition, six more outbursts have been observed during INTEGRAL’s Galactic Plane Scans. X-ray pulsations have been detected with a pulse period of 41.6917980.000016 s. The X-ray luminosity in the 5–300 keV energy range was 9.7 erg s-1, for a distance of 7.1 kpc. Two unusual features were found in the light curve, with an initial peak before the main outburst and another possible spike after the maximum. RXTE observations confirm only the existence of the initial spike. Although the initial peak appears to be a recurrent feature, the physical mechanisms producing it and the possible second spike are unknown. Moreover, a four-day delay between periastron passage and the peak of the outburst is observed. We present for the first time a 5–300 keV broad-band spectrum of this source. It can be modelled by the sum of a disk black body (kT8 keV) with either a power law model with =2.040.11 keV or a Comptonized component (spherical geometry, kTe=30 keV, =2.64, kTW=1.5 keV).
Key Words.:
accretion, accretion disks – binaries:close – stars: individual: EXO 2030+375 – X–ray binaries1 Introduction
The high-mass X-Ray binary EXO 2030+375 is an X-ray transient system that consists of a neutron star (NS) orbiting a Be companion, hence forming a Be/X-ray binary. Be stars are rapidly rotating objects with a quasi-Keplerian disk around their equator. The ultimate cause of the formation of the disk is still under heavy debate, but the high rotation velocities of these types of stars must play an important role (Townsend 2004). The optical and infrared emission is dominated by the donor star and characterised by spectral lines in emission (particularly those of the Balmer series) and IR excess. The standard model of a Be/X-ray binary ascribes the high-energy radiation to an accreting mechanism that takes place when the compact object interacts with the Be star’s circumstellar disk, giving rise to an X-ray outburst.
EXO 2030+375 was discovered by EXOSAT in 1985 during a giant (or type II) X-ray outburst (Parmar et al. 1989), probably arising from a dramatic expansion of the disk surrounding the Be star (Coe 2000). The X-ray luminosity in the energy range 1–20 keV reached a value of erg s-1, and a large intrinsic spin-up rate (Reynolds et al. 1993), as well as 0.2 Hz QPO (Angelini, Stella, & Parmar 1989) were observed. Since then, only normal (or type I) outbursts have been detected: EXOSAT (28 October - 3 November 1985, Parmar et al. 1989), Ginga (29-31 October 1989 and 24 October 1991; Sun et al. 1992), ROSAT (November 1990; Mavromatakis 1994), CGRO/BATSE and RXTE satellites (since April 1991 outbursts were detected at most periastron passages and continue to be detected with the ASM, Wilson et al. 2002, 2005), and INTEGRAL (6-18 December 2002, and continue to be detected during GPS observations). These type I outbursts have erg s-1, are modulated with the orbital period and display low spin-up rate episodes.
With an orbital period of =46.02140.0005 d and an eccentricity of =0.4190.002 (Wilson et al. 2002), EXO 2030+375 exhibits variability on all time scales. Its optical counterpart is a Be () main-sequence star (Motch & Janot-Pacheco 1987; Coe et al. 1988). The optical/IR emission seems to be related to the activity of the Be star’s disk (Reig et al. 1998). In the X-ray band the neutron star shows 41.7-s pulsations (Parmar et al. 1989; Reynolds, Parmar & White 1993, Reig & Coe 1998; Wilson et al. 2002, 2005), and active/inactive periods are mainly related to the periastron passage (46.02 d). The spectral shape of EXO 2030+375 in the 2–20 keV energy range has been modelled by an exponential cut-off () plus absorption and an iron emission line at 6.5 keV (Reig & Coe 1999). In the 20–150 keV energy band Stollberg et al. (1999) found a thermal bremsstrahlung model to be the best fit ().
In this paper we present for the first time a broad band spectrum of EXO 2030+375 using all three high-energy instruments on-board INTEGRAL. In addition, we have analysed RXTE data from three other outbursts. Furthermore, a detailed timing analysis of this source is shown. INTEGRAL preliminary results of EXO 2030+375 have been reported by Martínez Núñez et al. (2003), Kuznetsov et al. (2003, 2004), Bouchet et al. (2003) and Camero et al. (2004).
2 Observations and data reduction
The INTErnational Gamma-Ray Astrophysics Laboratory (INTEGRAL, Winkler et al. 2003) consists of three coded mask telescopes: the spectrometer SPI (20 keV–8 MeV), the imager IBIS (15 keV–10 MeV), and the X-ray monitor JEM-X (4–35 keV), as well as the optical monitoring camera OMC (V, 500–600nm).
The spectrometer SPI has an angular resolution of and an excellent energy resolution (2.35 keV at 1.33 MeV). The fully coded field of view (FCFOV) of the instrument is (Vedrenne et al. 2003). The imager IBIS has two detector layers: ISGRI and PICsIT. It has an angular resolution of 12 arc minutes and a FCFOV of (Ubertini et al. 2003). The JEM-X monitor consists of two identical coded-aperture mask telescopes co-aligned with the other instruments, each with an energy resolution of and an angular resolution of 3 arc minutes. Its FCFOV is (Lund et al. 2003).
During the INTEGRAL Performance and Verification Phase (hereafter PV, from launch on October 17, 2002 to the end of December 2002), an outburst of EXO 2030+375 was observed. In the study presented here we have analysed SPI, ISGRI and JEM-X data from revolutions 18 to 23 (3–18 December 2002) around the Cygnus region, where this source is located. IBIS/ISGRI was able to detect this source in almost 285 pointing exposures made by the satellite.However, only those pointings giving a detection level above have been taken into account ( 170 pointings). SPI data almost cover the duration of the outburst which lasted approximately 12 days ( 450 pointings). However, SPI data from revolution 18 was excluded since it was only a staring observation. Due to the pattern of observation exposures made by INTEGRAL, EXO 2030+375 was outside the JEM-X field of view during the second part of the outburst, being detected in only 10 pointings.
In addition, six more outbursts have been partially detected during INTEGRAL Galactic Plane Scans (hereafter GPS) surveys. The period analysed includes revolutions 26 to 269 (MJD 52630 – MJD 53365). We have obtained positive detections with SPI in 16 revolutions,with a total observing time of 770 ks. ISGRI has detected it within the fully coded field of view in 12 revolutions ( 50 ks), and JEM-X in 4 (9 ks) (see Tab. 1).
INTEGRAL data reduction was carried out with ISDC’s (Courvoisier et al. 2003) Offline Scientific Analysis software, release 4.2. A software description can be found in Goldwurm et al. (2003), Diehl et al. (2003), Westergaard et al. (2003).
In 1996 July (MJD 50265–50275), 2002 June (MJD 52425–52446), and 2003 September (MJD 52894–52899), EXO 2030+375 was observed with the RXTE Proportional Counter Array (PCA) and the High Energy Timing Experiment (HEXTE) 111See http://heasarc.gsfc.nasa.gov/ for observation details. For each observation, we analysed PCA Standard 1 data (0.125 sec time resolution, no energy resolution) for light curves and Standard 2 data (16 sec time resolution, 129 channel energy resolution) for hardness ratio and spectral analysis using FTOOLs v5.3.1. Details of timing analysis of these data are given in Wilson et al. (2002, 2005).
3 DATA ANALYSIS
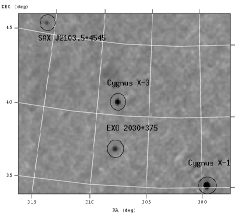
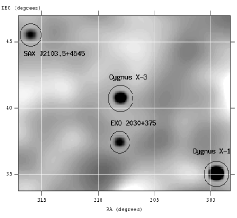
3.1 Imaging
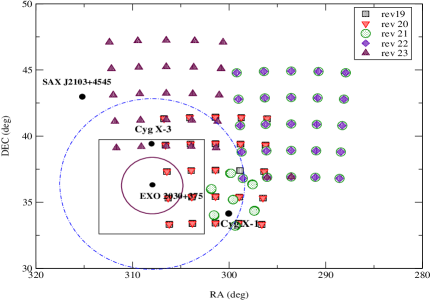
Figure 1 shows the 55 and hexagonal dithering patterns carried out by INTEGRAL during the PV phase in the Cygnus region, together with the fully coded field of view of the three high-energy instruments. We observed that the 450 pointings can be grouped into a subset of 75 () which are independent, due to repetitions of the observation pattern at the same location.
Table 1 shows the observations per instrument, and the mean flux in different energy ranges per revolution. PV phase fluxes in the 20–40 keV energy range obtained by ISGRI and SPI increase from MJD 52618 (revolution 19), peaking at around MJD 52622 (revolution 20), and finally decreasing to the end of the outburst at MJD 52630 (revolution 23).
Using PV phase data for a total observing time of 306 ks and covering revolutions 18 to 22, ISGRI located EXO 2030+375 at R.A.=308.09∘ and DEC=37.65∘, with a 0.03∘ error radius. SPI detected this source with a statistical significance of 35, averaging over revolutions 19 to 23 (730 ks), at R.A.=308.120.07∘ and DEC=37.470.05∘. Only in 10 pointings of revolutions 19 and 20 (18 ks) could JEM-X detect EXO 2030+375,because it has the smallest fully coded field of view. Its best location was at R.A.=308.06∘ and DEC=37.64∘ with an error radius of 0.03∘.
| Instrument | Rev | Obs.Time | Mean MJD | Mean Flux |
|---|---|---|---|---|
| ks | mCrab | |||
| JEM-X | 19 | 9 | 52618.73 | 552 |
| (5-25 keV) | 20 | 9 | 52621.72 | 541 |
| 80 | 3.6 | 52801.47 | 471 | |
| 82 | 1.8 | 52805.92 | 722 | |
| 265 | 1.8 | 53353.52 | 882 | |
| 266 | 1.8 | 53356.50 | 972 | |
| IBIS/ISGRI | 18 | 19.8 | 52615.72 | 21.20.7 |
| (20-40 keV) | 19 | 104.4 | 52618.73 | 67.10.8 |
| 20 | 113.4 | 52621.72 | 74.30.7 | |
| 21 | 63 | 52624.71 | 591 | |
| 22 | 5.4 | 52627.73 | 292 | |
| 52 | 4.4 | 52717.31 | 615 | |
| 67 | 2.2 | 52761.36 | 994 | |
| 80 | 18 | 52801.19 | 501 | |
| 82 | 2.2 | 52806.05 | 934 | |
| 142 | 4.4 | 52985.52 | 963 | |
| 145 | 4.4 | 52994.51 | 563 | |
| 162 | 2.2 | 53045.59 | 164 | |
| 189 | 2.2 | 53126.55 | 834 | |
| 193 | 2.2 | 53137.40 | 364 | |
| 265 | 2.2 | 53353.52 | 1154 | |
| 266 | 2.2 | 53356.49 | 1374 | |
| 269 | 2.2 | 53365.25 | 1255 | |
| SPI | 19 | 187.2 | 52618.73 | 523 |
| (20-40 keV) | 20 | 178.2 | 52621.72 | 703 |
| 21 | 187 | 52624.71 | 454 | |
| 22 | 206.8 | 52627.73 | 363 | |
| 23 | 204.6 | 52630.79 | 62 | |
| 54 | 50 | 52722.89 | 3214 | |
| 59 | 46.2 | 52737.65 | 3413 | |
| 67 | 104.4 | 52761.36 | 7812 | |
| 79 | 17.6 | 52797.47 | 63 | |
| 80 | 203 | 52801.19 | 522 | |
| 82 | 28.6 | 52806.05 | 6510 | |
| 92 | 22 | 52835.92 | 2615 | |
| 142 | 24.2 | 52985.52 | 11512 | |
| 145 | 28.6 | 52994.51 | 2212 | |
| 189 | 41.8 | 53126.55 | 6910 | |
| 210 | 26.4 | 53188.42 | 3613 | |
| 218 | 35.2 | 53212.86 | 4915 | |
| 241 | 39.1 | 53281.68 | 3711 | |
| 253 | 40.3 | 53317.73 | 10114 | |
| 265 | 32 | 53353.52 | 11517 | |
| 266 | 28.1 | 53356.49 | 14917 | |
| 269 | 28.4 | 53365.25 | 11815 |

3.2 Timing
X-ray pulsations have been detected by JEM-X and IBIS/ISGRI. A standard epoch-folding analysis on JEM-X data gives a value of 41.6010.005 s for the short-term variability. In addition, we have analysed ISGRI data using new software based on previous experience in the timing analysis of X-ray pulsars with BATSE (Finger et al. (1999), Wilson et al. (2002)). This software is able to generate a pulse phase for each science window and then fit them to get a pulse period. The best-fit period is s (epoch MJD 52621.6913), using data spanning revolutions 18 to 22 (MJD 52614.419-52628.964), including barycenter (Walter et al. (2003)) and orbit corrections (Wilson, Fabregat, Coburn (2005)) . This result is in very good agreement with previous results (Parmar et al. 1989, Reynolds et al. 1993, Reig & Coe 1998, Kuznetsov et al. 2004, Wilson et al. 2002, Wilson, Fabregat, Coburn (2005) ).
For each science window, our software collected good events in the partially and fully coded field-of-view of ISGRI in the 20-60 keV band using the pixel information function (PIF). The good events were then epoch folded using initially a simple pulse phase model based on spin-frequency measurements from RXTE. To remove effects of binning, we then fit each folded profile with a Fourier series of harmonic coefficients. A template profile was then created from the average profile from the set of science windows. For each harmonic coefficient, we computed a reduced .
| (1) |
where and are the cosine and sine coefficients for science window and harmonic , and are the errors on those coefficients, and are the cosineand sine coefficients for the mean profile, and is the number of science windows. To account for excess aperiodic noise from Cygnus X-1, since it cannot be completely removed from the data, the errors on the harmonic coefficients for the individual science windows were multiplied by . A similar technique was also applied to account for excess aperiodic noise in BATSE data (Wilson et al. (2002); Finger et al. (1999)). To generate phase offsets from the model, we then cross-correlated the individual profiles with the template profile. The new phases (model + offset) were then fitted with a linear or quadratic phase model, and the process was repeated,creating new folded profiles, new harmonic coefficients, and new phase offsets. The pulse profiles were then combined over time using the phase model to improve statistics and allow the phase measurements to constrain spin-up during the outburst. Figure 3 shows 0.5 day phase residuals for our best fit model with a constant period,indicating that no significant spin-up (or spin-down) was detected during the outburst. All of the individual pulse profiles were combined using our phase model to produce the mean 20-60 keV profile shown in the bottom panel of Figure 3.
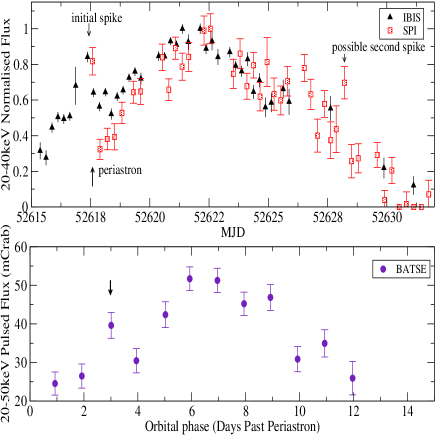


In the medium-term EXO 2030+375 shows type I outbursts, i.e. increases of the X-ray flux during the periastron passage of the neutron star. During brighter EXO 2030+375 outbursts observed with BATSE, Wilson et al. (2002) found a correlation between spin-up rate and pulse flux, suggesting that an accretion disk was likely to be present. The behaviour of this active period can be seen in Fig. 4, where a comparison of the (20–40 keV) ISGRI and SPI light curves with that of an earlier outburst detected by BATSE (20–50 keV) is shown. The shape and amplitude of variability in both cases are analogous, as well as the duration of the phenomenon (about 12 days). However, it is to be noted that in the same figure the INTEGRAL light curves show a 4 day delay of the maximumof luminosity after the periastron passage of the neutron star, while the earlier outburst detected by BATSE peaked 6 days after periastron.
Furthermore, Fig. 4 shows very clearly an initial spike in both INTEGRAL light curves, and another possible spike after the outburst maximum. BATSE data shows marginal evidence for only an initial spike about 3–4 days before the maximum. RXTE/PCA light curves from June-July 1996, June-July 2002, and September 2003 all show evidence for an initial peak preceding the maximum, but no evidence for a second spike (see Fig. 5). In these 3 outbursts, the initial spike, dip, and maximum each appear to occur at approximately the same relative orbital phase, despite the fact that the orbital phase of the maximum shifts dramatically from about 1 day before periastron in June-July 1996 to about 2 days after periastron in June-July 2002 and then to about 4 days after periastron as of September 2003 (See Fig. 6).
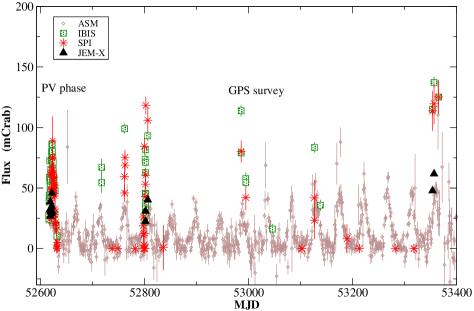
Galactic Plane Scans (GPS) performed by INTEGRAL allowed us to partially detect six more outbursts of this source. Figure 7 shows SPI, ISGRI and JEM-X light curves obtained with GPS and PV phase data. For comparison RXTE/ASM data covering the same period are also plotted. In all light curves the seven outbursts seem to peak at the same time, following the same trend as previous type-I outbursts: the same duration and shape, and all separated by about 46 days, which corresponds to the orbital period of the system. However, the amplitude of variability varies from one to another. In principle, this can be due to the outbursts not being completely sampled intime during GPS, since the purpose of these observations is to perform saw-tooth-path scans of the Galactic Plane at weekly intervals, where individual exposures are separated by along the scan path. On the other hand, due to its detector design, data from SPI are highly background dominated. For SPI to achieve a signal to noise ratio of 10 for a source as bright as EXO 2030+375 an observation of 300 ks would be necessary. Therefore the GPS pointing pattern is not ideally suited to make a detailed study of point sources.
3.3 Hardness Ratios
In order to study the spectral variability of EXO 2030+375 we have carried out a hardness ratio (HR) analysis, since the quality the data prevent us from performing a detailed analysis. Table 2 lists the energy bands used. The HR is defined as:
| (2) |
with H and S being the hard and soft band fluxes, respectively.
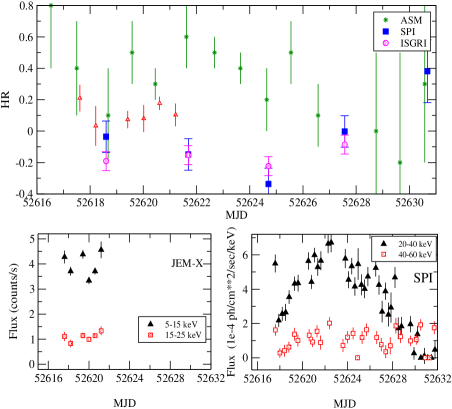
Figure 8 (top) shows RXTE/ASM, JEM–X, ISGRI and SPI HRs during the PV phase outburst. All data are in Crab units. In spite of the poor statistics, at high energies there seems to exist a softening of the spectrum (ISGRI and SPI data), while at low energies a hardening is seen (RXTE/ASM data). It should be noted that for JEM–X only the first half of the outburst is present.
Figure 8 (bottom left) shows JEM–X (5–15 keV) and (15–25 keV) light curves. We cannot clearly see an increase of flux at higher energies. On the other hand, (20–40 keV) and (40–60 keV) SPI light curves (bottom right) show a decrease of the flux in the higher energy band.
Hardness ratios were also generated from RXTE PCA data using three energy bands: 2-5, 5-15, and 15-30 keV. Here the hardness ratios were defined as . In all three outbursts observed with the RXTE PCA, the flux in the 5-15 keV band was larger than that in the other two bands. This differs from where the spectrum peaked in the INTEGRAL data, but is likely related to differences in the spectral response of the instruments.
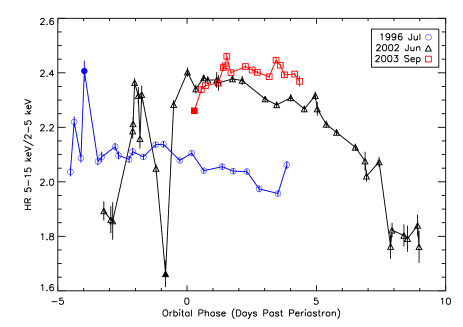
During the main part of all three outbursts, the hardness ratios were roughly constant, as was also observed with INTEGRAL. However, the 5-15 keV/2-5 keV ratio, shown in Figure 9, exhibited intriguing behavior in the dip preceding the main outburst. In the 1996 outburst, the dip is harder than the main outburst, while in both the 2002 and 2003 outbursts, the dip is softer than the mainoutburst. Also, this hardness ratio was correlated withintensity in the 2002 outburst, when our observations covered the largest range of orbital phases and intensities.
| Instrument | Hard enery band | Soft energy band |
|---|---|---|
| RXTE–ASM | 5–12 keV | 3–5 keV |
| JEM–X | 15–25 keV | 5–15 keV |
| ISGRI | 40–60 keV | 20– 40 keV |
| SPI | 40–60 keV | 20– 40 keV |
3.4 Spectral analysis
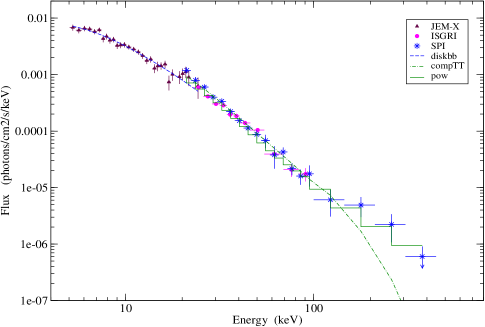
In this section we have characterised the average spectral shape of EXO 2030+375 during the December 2002 outburst. Data from the three high-energy instruments have been combined to achieve a 5–300 keV broad-band average spectrum (Fig. 10). It is the first time that such a broad-band spectrum of this source is presented. For JEM–X we have obtained an average spectrum in the 5—-25 keV energy range by using five Science Windows of revolution 19 (JEM–X 2 data). Only IBIS/ISGRI spectral data within the fully coded field of view were used for extracting the 20–100 keV average spectrum. This includes 35 spectra from revolutions 19 and 20. SPI has the largest field of view, hence EXO 2030+375 was detected throughout almost the entire duration of the outburst. In order to improve the signal to noise, data from revolutions 19 to 23 were used for attaining an average spectrum in the 20–300 keV energy range.
We found that the broad-band spectrum can be adequately described by the sum of a disk black body with either a power law model or a Comptonized component(COMPTT; Titarchuk et al. 1994, 1995) . The soft component is interpreted as coming from the accretion disk, the neutron star surface, or an optically thick boundary layer (Barret et al., 2000 and references therein). The harder one is often modeled by simple power laws, however Comptonization models provide more physical fits. This process is speculated to take place in a scattering corona located somewhere in the system: around the neutron star (e.g., optically thin boundary layer, spherical corona) or above the disk.
Table 3 summarises the spectral parameters that have been obtained fitting both models. The soft component has a black body temperature of kT8 keV, which does not substantially change after applying a power law or a COMPTT model. In addition, we can see that an unbroken power law fits well the hard X–ray component with a =2.040.11 keV. Moreover, we found compatible fits when a COMPTT model is used with differentelectron temperatures between kTe=30 keV and kTe=60 keV, although it was not possible to constrain this parameter, hence it was fixed in all the fits. We noticed how the optical depth decreases as the temperature increases, while the rest of the parameters are almost constant with temperature.
We have applied both spherical and disk geometries yielding to different values for the optical depth of the electron cloud (/ 2). However, the temperature of the seed photons (kTW), assuming a Wien-type distribution, as well as the black body temperatureremained constant.
In any case the addition of an absorption component improved the fits (a value of N cm-2 was used; Reig & Coe 1999). Neither an iron line was detected nor any cyclotron line feature around 36 keV as Reig et al. (1999) suggested could be observed. No cut-offat 200–300 keV, as seen in black-hole systems (BHs) like Cygnus X—-1 (Schnfelder 2001), seems to be presentalthough the data are not conclusive.
| Model | Parameters | Intercalibration |
| factors | ||
| (ISGRI/JEM-X) | ||
| (SPI/JEM-X) | ||
| kTBB= keV | 1.0 | |
| diskbb | = 2.040.11 | 1.10.2 |
| + pow | /dof= 1.07/72 | |
| Flux∗= 1.7 | ||
| kTBB= 82 keV | ||
| diskbb | kTW= keV | |
| +compTT | kTe= 60 keV (fixed) | |
| = 1.3 | ||
| /dof= 1.005/70 | ||
| Flux∗= 1.5 | ||
| kTBB=72 keV | ||
| diskbb | kTW= 1.5 keV | |
| +compTT | kTe= 30 keV (fixed) | |
| = 2.6 | ||
| /dof= 1.03/70 | ||
| Flux∗= 1.4 | ||
| ∗(erg cm-2s-1) |
4 DISCUSSION
We have carried out INTEGRAL imaging, timing and spectral analysis of the Be/X-ray binary EXO 2030+375 December 2002 outburst. In addition, we have reported six more outbursts detected during INTEGRAL GPSsurveys.
Temporal analysis performed with JEM—X and IBIS/ISGRI observations showed X—-ray pulsations. Previous results using INTEGRAL data by Kuznetsov et al. (2004) gave a value of 41.68970.0001 s. Our best fit period obtained is s, in excellent agreement with previous results (Parmar et al. 1989, Reynolds et al. 1993, Reig & Coe 1998, Wilson et al. 2002, Wilson, Fabregat, Coburn (2005)). The global trend in the pulsar spin frequency was spin-down from 1994 through 2002. Recently, based on the 2002 and 2003 outburst observations with RXTE PCA, Wilson et al. (2005) observed a change from spin-down to spin-up. They suggested that the pattern of constant spin, followed by spin-up,followed by spin-down, observed with BATSE, is repeating with an approximately yr cycle. Nevertheless, nosignificant spin-up (or spin-down) was detected during the INTEGRAL PV phase outburst.
The X-ray behaviour of EXO 2030+375 in the medium term, is characterised by a regular increase of theX-ray flux modulated with the orbital period (type I outbursts). The average X-ray luminosity was9.7 erg s-1, for an assumed distance of 7.1 kpc (Wilson et al. 2002). This luminosity value is of the same order as previous type–I outbursts of this source. We have estimated the L1—-20/L20-200 ratio for EXO 2030+375, obtaining a value 1.2. This allows us to locate this source in the so-called X–ray burster box, whereas all black holes are found outside it (Barret et al. 2000).
During the PV phase outburst a four-day delay between the maximum of luminosity and the periastron passage of the neutron star was found. Previous results showed that EXO 2030+375’s outbursts abruptly shifted from peaking about 6 days after periastron to peaking before periastron and then gradually shifting to after periastron (see Fig. 6), depending on a density perturbation precessing in a prograde direction around the Be disk (Wilson et al. 2002). Recent RXTE ASM data indicate that the main peak is currently about 5 days after periastron.
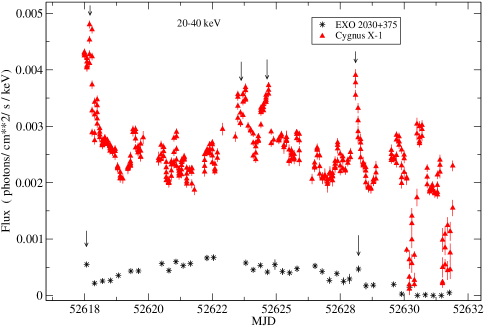
The second feature found in the EXO 2030+375 INTEGRAL/SPI light curve is not detected by RXTE, and there are not enough ISGRI data covering this period for comparison. When interpreting SPI timing analysis it is important to take into account the possible influence of a very strong source like Cygnus X–1 in the field of view of this coded mask instrument. To resolve all sources each should have a clear coding pattern from the mask, and if this is incomplete for any of the sources, especially for a weak one, the mask pattern may correlate with parts of the mask pattern of neigbouring sources introducing a systematic error in flux values. This phenomenon of an incomplete detector pattern due to a source outside the FCFOV can also be seen in the two dips at the end of the Cygnus X–1 light curve. The observation detector pattern of the second EXO 2030+375 feature is not completely inside the FCFOV of the instrument, i.e. this feature could have a systematic error due to cross correlation with Cygnus X–1. In Fig. 11 we can see four large flares in the Cygnus X–1 light curve. In principle, if such a kind of correlation is occurring we would expect four unusual features in EXO 2030+375 light curve. However, only the first and last of these correlate to the EXO 2030+375 features, but there is no correlation for the second and third. Therefore, we cannot rule out the possibility that the second peculiarity in the SPI data of EXO 2030+375 is real.
Analysis of INTEGRAL and RXTE data did not show clear spectral differences between the initial and maximum peaks. If the emission characteristics during the initial peak and the main outburst are different this would indicate two different accretion mechanisms. Interestingly, the RXTE data showed evidence for a spectral difference in the dip between the peaks. However limited statistics did not allow a detailed spectral analysis.
2S 1845-024, a 94-second pulsar in an eccentric (e=0.88) 242-day orbit, exhibits the same recurrent structure consisting of an initial peak preceding themaximum and followed by another weaker peak (Finger et al. 1999). In this source, the spikes are interpreted as due to the passage of the pulsar through the Be star’scircumstellar envelope in an orbit inclined with respect to the equatorial plane of the Be star, while the main peak was interpreted as due to disk accretion.
Reig & Coe (1999) studied the continuum spectral shape of EXO 2030+375 in the 2–20 keV energy range, representing it with an exponential cut-off (, E0.33 keV), plus absorption by cold material (N cm-2) and an iron emission line at 6.5 keV. In the Gamma-ray band data are scarce. CGRO/BATSE observations in the 20–150 keV energy range did not find significant variationsof the spectral parameters over a 134-day period, with a thermal bremsstrahlung as the best-fitting model (, Stollberg et al. (1999)). Recent INTEGRAL observations in the 5–25 keV range by Martínez Núñez et al. (2003) have reported as the best fit an exponential cut-off (, E keV),althought an iron emission line was not detected. Kuznetsov et al. (2003) fitted the 20–100 keV spectrum using a power law plus an exponential cut-off( , E keV). Furthermore, in the20–150 keV energy range Bouchet et al. (2003) found that a single power law ( ) or a bremsstrahlung () were compatible fits. Preliminary 10–200 keV broad-band spectrum by Camero et al. (2004) showed that either an unbroken power law ( ) or a bremsstrahlung () were again good fits. In the present work the hard component of the 5–300 keV broad-band spectrum, described by a single power law model with a =2.040.11 keV, confirms INTEGRAL preliminary results. As we said in the previous section and in order to provide a physical fit for EXO 2030+375 we have used in addition a Comptonization model (COMPTT). Due to the fact that this is the first attempt made for this source we can not compare our results with previous studies. However, we will compare them with other analysis performed in another neutron stars and black-hole systems. These studies, however, are concentrated on NS in low-mass systems with lower magnetic fields than accreting X-ray binaries. Such detailed studies using physical models for broad-band spectra have not been done frequently for accreting pulsars.
On average, BH spectra are harder than NSspectra and this has been tentatively explained by the additional cooling provided by the NS surface, which may act as a thermostat capable of limiting the maximum kTe achievable in these systems (Kluzniak 1993; Sunyaev & Titarchuk 1989). Using the COMPTT model for fitting BH spectra showed that electron temperatures greater than 50 keV seem to be common, while NS temperaturesare usually smaller than that value (Barret 2001). For EXO 2030+375 we have found that electron temperatures between 30 keV and 60 keV are compatible in describingthe broad-band spectrum hard X—-ray component. The 60 keV temperature value seems to be inconsistent with the general behaviour of NSs. However, that criterion is still under debate since a temperature of about 50 keV,derived from the fitting of the hard X–ray spectra with a Comptonization model, was found by Torrejón et al. (2004) for the High Mass X–ray Binary 4U2206+54, as well as some speculative BH candidates for which kTe is below 50 keV (e. g., IGR J17464-3213 and GRS 1758-258;kT18 keV and 33 keV, respectively; Capitaino et al. 2004, Mandrou et al. 1994). In any case, this is applied when an energy cutoff is observed. But suchcutoffs are not always present in NS hard X–ray spectra. EXO 2030+375 does not show a cuttoff ( ). The same behaviour is found in some weekly magnetised NS like 1E 1724-3045 and Aql X-1, revealing a nonattenuated hard power law of up to 200 keV (Barret et al. 1991) and in the range 2.1–2.6 in the 20-100 keV energy range (Harmon et al. 1996), respectively. Therefore, the indication of a steep hard X–ray (E30 keV) spectrum with 2.5 cannot alone be used to claim that such a spectrum comes from a NS. Similarly, a hard X–ray power-law spectrum with 2.5 is not unique to BHs (e.g., 4U 0614+091: =2.3; Piraino et al. 1999). Barret et al. (2000) suggested that there might be two classes of NSs. Members of the first class would display hard X–ray spectra with energy cutoffs, which would result from thermal Comptonization. Members of the second class, where EXO 2030+375 could be included, would have nonattenuated power laws which could be produced by nonthermal Comptonization, similar to the ones observed in the soft state of BHs.
5 CONCLUSIONS
Our main results can be summarized as follows: we have obtained the first 5–300 keV broad-band spectrum using INTEGRAL observations of the December 2002 EXO 2030+375 outburst. A nonattenuated power law () or a COMPTT model (kTe=30 keV) can describe the hard X–ray component, while a disk black body can represent the soft component (kT8 keV).It should be noted that this is the first attempt to apply a physical fit to EXO 2030+375; we have reduced pulse period uncertainty determinations to 20% of previous INTEGRAL measurements; in the medium-term analysis, two unusual features in the light curve were found, an initial peak before the main outburst and another weaker one after the maximum. The physical mechanisms producing these features are unknown. RXTE observations confirm only the existence of the initial spike. Further observations would be needed to find out which physical mechanisms modulate the X–ray flux. Acknowledgements. We thank Peter Kretschmar for very useful comments that helped to improve this paper and Julien Malzac for providing useful information related to the NS and BH broad-band spectral behaviour. We appreciate the interesting discussions with Paco Bontempi and his support. We thank Mark Finger for considerable help with the software used for ISGRI timing analysis. We also appreciate The Exploration of the Universe Division (EUD)at NASA’s Goddard Space Flight Center for the opportunity to develop the present work. This research is supported by the Spanish Ministerio de Educación y Ciencia (former Ministerio de Ciencia y Tecnología) through grant-no ESP2002-04124-C03-02.
References
- (1) Angelini, L., Stella, L., Parmar, A.N., et al. 1989, ApJ, 346, 906
- (2) Barret, D., Mereghetti, S., Roques, J.P., et al. 1991, ApJ, 379, L21
- (3) Barret, D., Olive, J. F., Boirin, L., et al. 2000, ApJ, 533, 329
- (4) Barret, D. 2001, Adv. Space Res. Vol. 28, Nos 2-3, pp.307-321
- (5) Bildsten, L., Chakrabarty, D., Chiu, J., et al. 1997, ApJS, 113, 367
- (6) Bouchet, L., Jourdain, E., Roques, J.P., et al. 2003, A&A, 411, L377
- (7) Camero Arranz, A., Reig, P., Connell, P., et al. 2004, Proc. 5th INTEGRAL Workshop, ESA SP-552, 279
- (8) Capitanio, F., Kretschmar, P., Ubertini, P., et al. 2004, Proc. 5th INTEGRAL Workshop, ESA SP-552, 313
- (9) Coe, M.J. 2000, ASP Conference Series, The Be Phenomenon in Early-Type Stars, 214, 656
- (10) Coe, M.J., Longmore, A., Payne, B.J., Hanson, C.G. 1988, MNRAS, 232, 865
- (11) Courvoisier, T.J.-L., Walter, R., Beckmann, V., et al. 2003, A&A, 411, L53
- (12) Diehl, R., Baby, N., Beckmann, V., et al. 2003, A&A, 411L, 117D
- Finger et al. (1999) Finger, M. H., Bildsten, L., Chakrabarty, D., et al. 1999, ApJ, 517, 449
- (14) Goldwurm, A., David, P., Foschini, L., et al. 2003, A&A, 411, L223
- (15) Harmon, B. A., Wilson, C. A., Tavani, M., et al. 1996, A&AS, 120, C197
- (16) Kluzniak, W. 1993, A&AS, 97, 265
- (17) Kuznetsov, S., Falanga, M., Blay, P., et al. 2003, A&A, 411, L437
- (18) Kuznetsov, S., Falanga, M., Goldwurm, A., di Salvo, T. 2004, Proc. 5th INTEGRAL Workshop, ESA SP-552, 285
- (19) Lund, N., Budtz-Jørgensen, C., Westergaard, N.J., et al. 2003, A&A, 411, L231
- (20) Mandrou, P., Roques, J.P., Bouchet, L., et al. 1994, ApJS, 92, 343M
- (21) Martínez Núñez, S., Reig, P., Blay, P., et al. 2003, A&A, 411, L411
- (22) Mavromatakis, F. 1994, A&A, 285, 209
- (23) Motch, C., Janot-Pacheco, E., 1987, A&A, 182, L55
- (24) Parmar, A.N., White, N.E., Stella, L., Ferri, P. 1989, ApJ, 338, 359
- (25) Piraino, S., Santangelo, A., Ford, E. C., Kaaret, P. 1999, A&A, 349, L77
- (26) Reig, P., Coe, M. J., 1998, MNRAS, 294, 118
- (27) Reynolds, A.P, Parmar, A.N, White, N.E., 1993, ApJ, 414, 302
- (28) Schnfelder, V. 2001, in The Universe in Gamma Rays, ed. V. Schnfelder (Germany: A&A Library), 168
- Stollberg et al. (1999) Stollberg, M.T., Finger, M.H., Wilson, R.B., S., et al. 1999, ApJ, 512, 313
- (30) Sun, X.-J., Kawai, N., Matsuoka, M., et al. 1992, in Frontiers of X-ray Astronomy, ed. Y.Tanaka & K. Koyama (Tokyo: Universal Academy Press), 95
- (31) Sunyaev, R. A., Titarchuk, L.G. 1989, in Proc. 23rd ESLAB Symposium on Two Topics in X–ray Astronomy, ed. J. Hunt & Batrick (ESA SP-296; Noordwijk: ESA), 627
- (32) Titarchuk, L. 1994, ApJ, 434, 570
- (33) Titarchuk, L., Lyubarskij, Y., 1995, ApJ, 450, 876
- (34) Torrejón, J.M., Kreykenbohm, I., Orr, A., et al. 2004, A&A, 423, 301T
- (35) Townsend, R. H. D., Owocki, S. P., Howarth, I. D., et al. 2004, MNRAS, 350, 189
- (36) Ubertini, P., Lebrun, F., Di Cocco, G., et al. 2003, A&A, 411, L131
- (37) van der Klis 1989, Proc. NATO Advanced Study Institute Timing Neutron Stars.
- (38) Vedrenne, G., Roques, J.-P., Schnfelder, V. et al. 2002, A&A, 411, L63
- Walter et al. (2003) Walter, R., Favre, P., Dubath, P., et al. 2003, A&A, 411, L25
- (40) Westergaard, N.J., Kretschmar, P., Oxborrow, C.A., et al. 2003, A&A, 411, L257
- Wilson et al. (2002) Wilson, C.A., Finger, M.H, Coe, M.J., et al. 2002, ApJ, 570, 287
- Wilson, Fabregat, Coburn (2005) Wilson, C.A., Fabregat, J., Coburn, W., 2005, ApJ, 620, L99
- (43) Winkler, C., Courvoisier, T. J.-L., Di Cocco, G., et al. 2003, A&A, 411, L1