Global X-ray properties of the Orion Nebula region
Abstract
Based on the Orion Ultradeep Project (COUP) observation, we establish the global X-ray properties of the stellar population associated with the Orion Nebula. Three components contribute roughly equally to the integrated COUP luminosity in the hard ( keV) X-ray band: several OB stars, 822 lightly obscured cool stars in the Orion Nebula Cluster (ONC), and 559 heavily obscured stars. ONC stars pc from the center show a spatial asymmetry consistent with violent relaxation in the stellar dynamics. The obscured COUP sources concentrate around both OMC-1 molecular cores; these small-scale structures indicate ages Myr. The X-ray luminosity function (XLF) of the lightly obscured sample is roughly lognormal in shape. The obscured population is deficient in lower-luminosity stars, perhaps due to localized circumstellar material. Mass-stratified XLFs show that one-third of the Orion Nebula region hard-band emission is produced by the bright O6 star Ori C and half is produced by lower mass pre-main sequence stars with masses M⊙. Very low mass stars contribute little to the cluster X-ray emission.
Using the hard band emission, we show that young stellar clusters like the ONC can be readily detected and resolved with across the Galactic disk, even in the presence of heavy obscuration. The Orion Nebula sample is a valuable template for studies of distant clusters. For example, the peak of the XLF shape can serve as a standard candle for a new distance measure to distant young stellar clusters, and the presence of a neon emission line complex around 1 keV can serve as a diagnostic for young stars.
1 Introduction
Star formation regions are generally studied at long wavelengths. Molecular clouds cool by far infrared emission of dust and rotational lines such as the line of CO. Young stellar clusters (YSCs) are investigated directly at optical and near-infrared wavelengths if they are relatively unobscured, and at mid- to far-infrared if they are deeply embedded so that their starlight is reprocessed by heated dust. Gas in HII regions heated by massive stars can be studied at radio through ultraviolet wavelengths, but give limited information about the full stellar population.
It may seem at first that X-ray observations would make only very limited contributions to star formation and YSC studies. Lower mass pre-main sequence (PMS) stars typically emit only of their bolometric radiation in the X-ray band (Feigelson & Montmerle, 1999; Favata & Micela, 2003; Güdel, 2004), and the ratio is even smaller for OB stars where . Yet, modern X-ray telescopes such as the and the satellite are surprisingly sensitive. For a exposure of 100 ks, a single PMS star with L⊙ can be detected with 10 photons out to 2 kpc and an O star with L⊙ can be detected out to 6 kpc, assuming little absorption. A compact massive YSC with an Initial Mass Function (IMF) extending from early-O stars through brown dwarfs will typically emit L⊙ in the hard X-ray band which can be detected through most of the Galactic disk.
Obscuration by the natal molecular cloud and, for distant star forming regions, intervening spiral arms, presents the major difficulty at all wavelengths for studying star formation on a Galactic scale. X-ray astronomy can help because a significant fraction of the X-ray photons from both low and high mass stars are emitted at energies above 3 keV which can penetrate through nearly all lines-of-sight in the Galaxy and deep into molecular clouds. For example, in the Orion Ultradeep Project (COUP) discussed here, the protostar IRS 2 in the OMC-1 South molecular core was detected with 30 cts/(100 ks) with an X-ray-derived line-of-sight column density cm-2 equivalent to mag (Grosso et al., 2005).
X-ray studies of young stars in star formation regions provide a variety of insights that complement those obtained at longer wavelengths. These include:
-
1.
X-ray images give a census of members of YSCs that is largely independent of the presence or absence of a dusty circumstellar disk, thereby overcoming the bias of memberships derived from infrared-excess criteria (Feigelson & Montmerle, 1999). Sufficiently deep X-ray images can peer into the lower mass population in YSCs where only the OB stars have been studied. Due to a statistical correlation between X-ray luminosity and mass (Preibisch et al., 2005a), the X-ray luminosity function (XLF) might be useful to test uniformity of the stellar Initial Mass Function (IMF) in different clusters (Feigelson & Getman, 2005). Furthermore, the monotonic decrease of in X-ray emission between young stars with ages yr – from the younger Orion stars into the main sequence (Preibisch & Feigelson, 2005) and continuing to the oldest disk stars (Feigelson et al., 2004) – can greatly assist the removal of contaminants from a YSC membership census.
-
2.
The shape of the stellar XLF in YSCs appears to be universal, and can probably be used as a standard candle for distance determinations (Feigelson & Getman, 2005). The distances to YSCs which are too poor or obscured to exhibit a clear OB main sequence are often very uncertain.
-
3.
High-resolution X-ray imagery can detect bolometrically faint stars in the close vicinity of bolometrically bright stars, because the contrast in X-ray brightnesses is often small (Stelzer et al., 2005). For example, a short observation discovered four companions within 10″ of a PMS star (Feigelson et al., 2003).
-
4.
X-ray studies of YSCs with well-characterized individual stars permit study of magnetic activity of PMS stars as a function of mass, rotation and age (Preibisch et al., 2005a). X-ray flares give particularly important insight into high energy inputs into protoplanetary disks; for example, X-ray ionization appears likely to induce magnetodynamical turbulence and MeV flare particles may produce isotopic anomalies in disk solids (Glassgold et al., 2000; Feigelson, 2005).
-
5.
The X-ray spectrum gives a measure of the intervening total (i.e. solid and gaseous molecular, atomic, and partially ionized) interstellar column density that is derived independently of the usual optical-infrared dust extinction curve. The comparison of derived from soft X-ray absorption and derived from optical-infrared photometry thus allows study of the gas-to-dust ratio in molecular clouds and related issues such as interstellar metallicities and depletions onto grain surfaces (Vuong et al., 2003).
-
6.
X-ray studies of high-mass O stars elucidate shocks that thermalize the powerful kinetic energy of their winds. These include small-scale shocks in the radiatively accelerated zone near the stellar surface (Lucy & White 1980), intermediate-scale shocks arising from magnetic collimation of the wind (Babel & Montmerle, 1997), and parsec-scale shocks when winds collide in rich cluster environments (Townsley et al., 2003). Colliding winds from close O star or Wolf-Rayet binaries also produce intense penetrating X-ray emission (Stevens et al., 1992).
-
7.
By tracing both shocked OB wind flows and supernova remnant ejection in massive star formation complexes, X-ray images have the potential to help understand these important paths of energy input and chemical enrichment of the interstellar medium, providing a foundation for studies of starburst galaxies (e.g. Townsley et al., 2003; Muno et al., 2004).
To facilitate advances in these areas, the present paper has two related goals. First, we establish the global X-ray properties of the nearest rich YSC: the Orion Nebula Cluster (ONC), and its star formation environment. The ONC is the only rich cluster with sufficient complementary optical and near-infrared (ONIR) data to clearly define the X-ray properties across the IMF. Second, we characterize the Orion Nebula as a template for understanding less sensitive X-ray observations of more distant YSCs. The and satellites have observed over two dozen YSCs and star formation regions at distances ranging from 0.1 to 10 kpc during their first five years.
2 Preparatory material
Our study is based on the deepest X-ray observation of the Orion Nebula nicknamed the Orion Ultradeep Project (COUP), a nearly-continuous 9.7 day exposure of the nebula obtained in January 2003. Getman et al. (2005a) give a detailed description of the observation, data reduction, spectral analysis, source lists and characteristics. Most of the data analysis is performed using the ACIS Extract software package111http://www.astro.psu.edu/xray/docs/TARA/ae_users_guide.html. We also rely heavily on the COUP membership study by Getman et al. (2005b) and analysis of the unobscured optical sample of the ONC described by Preibisch et al. (2005a). The reader is referred to these studies for background on the sample selection and data analysis procedures. A distance of 450 pc to the Orion Nebula is assumed throughout these studies.
2.1 Stellar samples
We define here a hierarchy of X-ray emitting samples in the Orion Nebula based on the analyses and tables of Getman et al. (2005a, b). These samples are not a complete census of the Orion Nebula stellar population because many ONIR members are undetected by COUP (e.g., Tables 11-12 of Getman et al., 2005a) and are omitted. The missing stars are mainly very low mass ( M⊙) stars and brown dwarfs, and some deeply obscured stars.
- Orion Nebula member sample
-
These are the 1408 COUP sources which, to the best of our knowledge, constitute all COUP sources associated with the Orion Nebula star forming region. This is the full 1616 COUP sample omitting 208 sources found by Getman et al. (2005b) to be probable non-members: 159 sources without stellar counterparts classified as ‘EG’ (extragalactic sources), 16 sources with unobscured stellar counterparts classified as ‘Field’ (foreground stars), and 33 very faint sources without counterparts classified as ‘Unc’ (source existence is uncertain). Forty-two sources classified as ‘OMC’ and 33 sources classified as ‘OMC or EG?’ are considered to be obscured members of the Orion Molecular Cloud. This can be considered a complete flux limited sample of Orion Nebula stars in the keV band.
- Hot and cool star subsamples
-
We divide the Orion Nebula members into a small group of 10 unobscured hot stars with spectral types earlier than B4 (B3 to O7), and a large group of 1380 sources cooler than B4. The 10 hot ‘Trapezium’ sources (COUP 349, 745, 766, 778, 809, 869, 1116, 1232, 1360, and 1468) are those where the X-ray emission is likely dominated by stellar wind shock processes, although contributions by magnetically active cool companions are sometimes present (Stelzer et al., 2005). Note that there are a handful of heavily obscured hot stars in the OMC-1, such as the Becklin-Neugebauer Object (COUP 599b) and Source i (COUP 590), which may have spectral type earlier than B4 (Grosso et al., 2005). Because these stars have not been well-characterized yet, we group them with the cool star subsample.
- Lightly and heavily obscured subsamples
-
Our lightly obscured subsample consists of 839 cool (spectral type later than B4) COUP sources of which 822 have absorbing column densities cm-2 derived from XSPEC spectral fits (Getman et al., 2005a). Seventeen sources which are too faint for spectral fitting with median energies keV are added based on the strong correlation between and (§6). This sample is a superset of the well-characterized ‘optical sample’ and ‘lightly absorbed optical sample’ studied by Preibisch et al. (2005a) and Preibisch & Feigelson (2005), respectively. The obscured sample has 559 sources, 541 with cm-2 derived from XSPEC fits and 18 faint sources with keV. Two groups of these sources associated with the BN/KL and OMC 1-South cloud cores are discussed in detail by Grosso et al. (2005).
The COUP X-ray survey has strengths and weaknesses complementary to ONIR samples. It does not suffer confusion from the bright inhomogeneous nebular emission, it is virtually complete over the IMF down to M⊙, and it has a greater ability to detect lower mass stars at high obscuration. However, much of the M⊙ population is missed (Preibisch et al., 2005a, b) and the sensitivity within ′ of Ori C is reduced due to contamination by the point spread function wings of this extremely X-ray-bright star.
2.2 X-ray luminosities
We recapitulate the discussion in § 9 of Getman et al. (2005a) on the reliability and utility of different COUP X-ray luminosity estimates. Five X-ray luminosities are considered here: observed in the soft ( keV) band, observed in the hard ( keV) band, intrinsic corrected for X-ray absorption, observed in the total ( keV) band, and intrinsic . The absorption corrections are based on gas column densities derived from the X-ray spectra. Procedures of the spectral modeling and luminosity determinations are given in §§6-8 of Getman et al.
The five X-ray luminosities are effective for different purposes. The soft band emission encompasses over half of the intrinsic emission of cool T Tauri stars and three-quarters of the emission of hot OB stars. It is readily compared to measurements made with the older and telescopes. But the soft emission is easily absorbed by intervening interstellar gas; for typical PMS X-ray spectra, % of is extinguished when cm-1 (). Although we could operationally correct for this extinction and derive values for each star, we do not list them because they can be very uncertain. For distant YSCs which must suffer intervening absorption, we believe soft band luminosities will not provide useful measures of intrinsic X-ray emission.
The hard band is much less vulnerable to extinction. The absorption-corrected hard-band luminosities are, we suggest, the most reliable measure of the intrinsic stellar emission that can obtain from data for distant or absorbed young stellar populations.
The total band luminosities and represent the data to the fullest extent and provide the strongest signal. is the most valuable quantity for comparisons between lightly obscured YSCs, but it will underestimate the true emission for obscured or embedded populations due to the problematic absorption in the soft band. We also recognize that some of the values derived in Getman et al. (2005a) may be inaccurate due to incorrect choice of spectral model (cf. the outliers in Figure 7 below), leading to systematic errors in values. However, values are relatively unaffected by this problem.
3 Morphology of the Orion Nebula stellar population
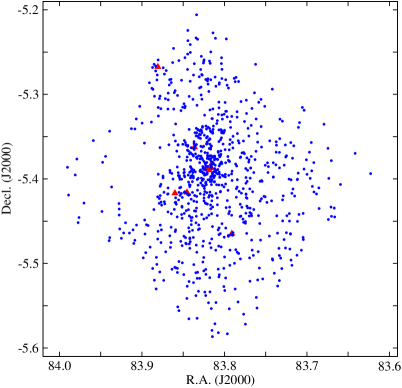
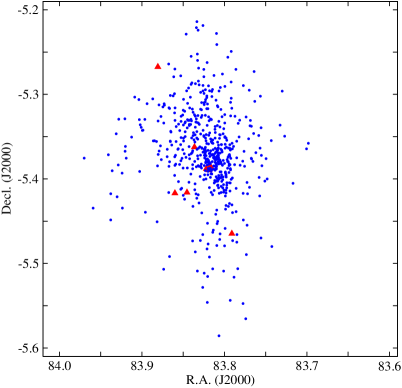
The COUP census of the young population provides a new opportunity to investigate the spatial structure of the Orion Nebula Cluster which allows inferences regarding the dynamical state of the cluster. Figure 1 shows the spatial distribution of the samples described in §2.1.
3.1 The lightly obscured Orion Nebula Cluster population
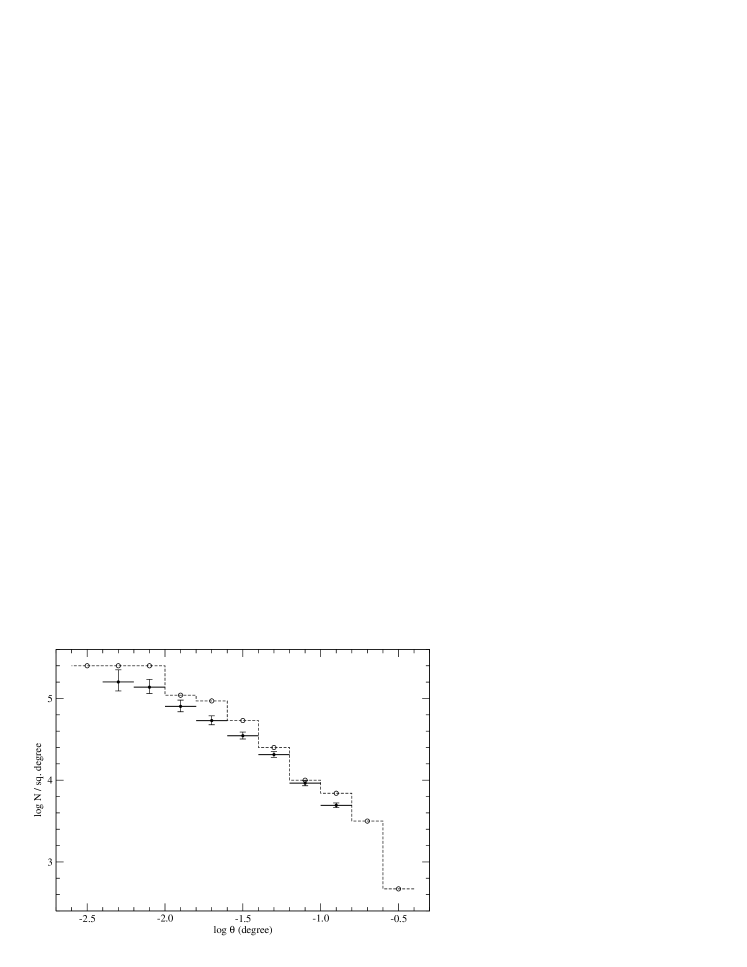
The structure of the COUP lightly obscured cool star sample (Figure 1 top) follows closely the shape of the ONIR sample studied by Hillenbrand & Hartmann (1998), though with about half of the stellar density. This is shown in the comparison of the stellar surface density radial profiles plotted in Figure 2. Their ONIR sample is richer than the COUP ONC sample due to their better sensitivity to low-mass members with M⊙, their inclusion of some absorbed stars which we place in the heavily absorbed sample, and the reduced sensitivity of COUP within 1′ ( deg) of Ori C due to the extended wings of its point spread function.
3.1.1 The core region
If one assumes spherical symmetry (but see §3.1.2), these radial distributions can be roughly modelled as isothermal spheres with core radii ′ or pc (Hillenbrand & Hartmann, 1998; Bate et al., 1998). To assist interpretation of other young stellar clusters, we calculate the X-ray properties of this pc diameter core region based on the lightly obscured sample. The central surface density of the cool COUP stars is stars deg-2 or stars pc-2. Their integrated X-ray luminosities are erg s-1, () = 32.4 (32.5) erg s-1, and () = 32.8 (33.0) erg s-1. The X-ray surface brightness averaged over the core for these cool stars is erg s-1 pc-2, 3.6 (4.4) erg s-1 pc-2, and 0.9 (1.5) erg s-1 pc-2 in the soft, hard and total (absorption-corrected) bands, respectively. If one includes the hot stars lying in the core region ( Ori C, Ori A, Ori D, and the two COUP components of Ori B), these central surface brightnesses rise to erg s-1 pc-2, erg s-1 pc-2, and 3 (5) erg s-1 pc-2. Though few in number, the hot O7-B3 stars dominate the X-ray emission in all bands in this central region.
Illustrating the application of these results, we consider the cool star component of the ONC viewed from a distance of 2 kpc (8 kpc). Its core region would then subtend 31″ (8″) with a hard band flux erg s-1 cm-2 ( erg s-1 cm-2) producing () counts in a 100 ks ACIS exposure. These hard band count rates are unchanged for most realistic lines-of-sight through the Galaxy ( cm-2). If the point source detection limit was 10 counts and the cluster was at 2 kpc, 47 stars with erg s-1 would be individually resolved and the integrated emission of 55 fainter stars would produce a diffuse glow. If the cluster was at 8 kpc, 8 stars with erg s-1 would be individually resolved. The integrated hot star contribution would be 2.3-2.5 times higher than the cool star component and many, but not all, of the stars earlier than B4 would be individually identified as bright point sources. We conclude that the core region of the ONC can be readily detected and discriminated from point-like sources across the Galactic disk in Chandra images.
3.1.2 Asymmetry in the outer region
Hillenbrand & Hartmann (1998) model the stellar surface density as ellipses with ellipticity oriented nearly north-south. However, examination of the COUP distribution in Figure 1 shows a distinct asymmetry: the surface density of cluster members east of Ori C is considerably below that seen in a similar region to the west. This deficit of ONC stars west of Ori C is also evident in optical samples (e.g., Figure 3 of Hillenbrand 1997 and Figure 16 of Bate et al. 1998). From COUP data, we can state with some confidence that this deficit is not due to absorption by cloud material along the line-of-sight. An absorbing cloud component known as the Dark Bay obscures the HII region on the western side starting ′ west of Ori C (O’Dell, 2001). But optical extinction and radio HI measurements indicate the Dark Bay column density to the bright nebula is only cm-2 (van der Werf & Goss, 1989), which has negligible effect on the count rates and is insufficient to produce a significant loss in sensitivity to X-ray stars.
The east-west asymmetry in the unobscured COUP population thus appears to be an intrinsic characteristic of the cluster. The application of equilibrium dynamical models, such as isothermal King models, may therefore not be justified, at least for the outer regions of the cluster on scales ′ or 0.5 pc. This agrees with the calculation of Hillenbrand & Hartmann (1998) that the cluster has not had time to achieve dynamical equilibrium; they estimate the two-body encounter relaxation time is 6.5 Myr for the inner 0.8 pc radius region. They then suggest that the cluster is either in the process of violent relaxation when large-scale asymmetries are prevalent, or its structure today represents its original configuration at formation. Based on the measured velocity dispersion km s-1, the crossing time for a typical star across a 0.8 pc distance is only 0.3 Myr, considerably shorter than the typical Myr age of ONC stars. Primordial asymmetries and substructures should therefore have been quickly erased, as established by Bate et al. (1998); Scally & Clarke (2002).
We thus conclude that the most likely explanation for the asymmetry seen in the COUP unobscured population is that the ONC is in the process of violent relaxation leading to a temporary asymmetrical spatial distribution of stars (Lynden-Bell, 1967). To our knowledge, the ONC is the only case where violent relaxation has been arguably detected in a young stellar cluster.
3.2 The heavily obscured Orion Nebula population
The large-scale distribution ( pc diameter) of obscured stars is more centrally condensed than the lightly obscured ONC component and also clearly does not show a dynamically relaxed structure (Figure 1 bottom). These COUP sources tend to lie along the north-south dense molecular filament extending from several arcminutes south of OMC-1S northward towards OMC-2/3/4 (Johnstone & Bally, 1999). A strong concentration of sources is seen around the BN/KL region ′ to the northwest of the Trapezium, and a second weaker concentration can be seen around the Orion 1-South cloud core ′ southwest of Ori C. Very similar concentrations of were found among () in the sensitive -band study of Lada et al. (2004). The BN/KL and OMC-1S COUP populations are discussed in detail by Grosso et al. (2005); the reader should consult this study for detailed study of their X-ray properties.
The existence of such stellar concentrations on pc scales, and their associations with molecular cloud cores, is a clear indication that these stars are very young. A population born with km s-1 velocity dispersion would spread pc (4′) in 0.2 Myr. The small-scale inhomogeneities associated with BN/KL and Orion 1-South thus imply stellar ages of Myr.
It is interesting to note that these structures have not been clearly evident in earlier studies. Past ONIR samples have not penetrated sufficiently deeply into the cloud to match the COUP obscured sample, where the average absorption is cm-2 equivalent to mag. Past mid-infrared surveys have been restricted to small regions around the dense molecular cores, although forthcoming wide-field surveys with the Spitzer Space Telescope will overcome this limitation.
4 X-ray luminosity function of the Orion population
4.1 Global XLF
Table 1 provides the per-star average and integrated sample luminosities of the COUP samples in the X-ray bands discussed in §2.2. In the hard band, the integrated contributions of the lightly and heavily obscured cool star samples to the integrated Orion Nebula population luminosity are similar with erg s-1. The hot stars, dominated by the uniquely luminous star Ori C, emit at nearly the same level with erg s-1 (Table 2). Thus, in the hard band which is largely unaffected by obscuration, the Orion Nebula emission is roughly equally divided between the lightly obscured ONC, the heavily obscured stars (including both obscured ONC stars and the embedded population around the OMC-1 cores), and the few O stars. Other star forming regions will necessarily exhibit different ratios between the unobscured, obscured and OB populations in the X-ray band. We suspect that the O stars will dominate the total hard-band emission in richer YSCs.
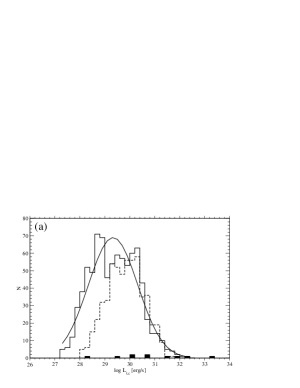
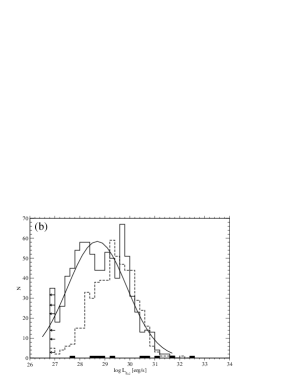
Figure 3 shows the binned differential XLF for the samples in the total and hard spectral bands, corrected for absorption. Recall that the total band luminosities will underestimate true values for heavily absorbed stars, even with the attempted correction, because soft components are sometimes completely missing from the spectral model. The shape of the XLF can be roughly understood as a convolution of the stellar IMF, which breaks from the Salpeter powerlaw below M⊙, and the correlation between X-ray luminosity and mass. These two effects result in a steep fall-off in the number of fainter X-ray stars in a young stellar cluster. This explains why the factor of ten increase in the limiting sensitivity of COUP over the previous observations of the region (Feigelson et al., 2002) led to only a modest increase in the number of detected lightly-absorbed ONC stars.
The XLF of Orion Nebula stars spans 5 orders of magnitude, from low-mass stars at or below the COUP detection limit of erg s-1 to M⊙ stars attaining erg s-1 at the peaks of flares. As noted by Feigelson et al. (2002) and Feigelson & Getman (2005), the shapes of the XLFs are roughly lognormal. Using the unobscured sample as a template for cool star YSC populations in general, we find a erg s-1 with standard deviation and, for the hard band, erg s-1 with standard deviation . However, the XLF shapes are not precisely lognormal; the tails follow a lognormal shape but the peak is nearly flat from to 30.5 erg s-1. Magnetic reconnection flares and systematic decline of X-ray luminosity with age will flatten the peak of the XLF, but these effects are considerably smaller than the factor of seen in the COUP XLF (Preibisch et al., 2005a; Preibisch & Feigelson, 2005).
An important corollary of the lognormal shape at the lower tail is that extraordinarily few stars appear around the COUP sensitivity limit. We thus have high signals on nearly all COUP sources. This will not be true for most other YSC observations where the exposure is shorter and the distance is greater. If the lognormal shape at the upper tail is universal, then observations should attempt to reach erg s-1 to capture sufficient cool stars to adequately define the amplitude of the curve. This would provide a powerful means for estimating the total YSC population independent of the distribution of OB stars. In addition,fitting XLFs to the Orion template offers a new distance measure to YSCs across the Galactic disk (Feigelson & Getman, 2005).
The shapes of the high-luminosity portions (above erg s-1 ) of the unobscured and obscured XLFs are very similar, but the obscured sample appears to be missing a substantial fraction of the weaker sources. This is true even in the hard band where X-rays can penetrate cm-2. One possibility is that a significant fraction of the lower-mass, X-ray-weaker sources are obscured by very high column densities, perhaps due to localized circumstellar material (i.e. a protostellar envelope or disk). For example, a source with erg s-1 and a typical keV thermal spectrum will be reduced below the COUP detection limit if cm-1 ( mag).
4.2 Mass-stratified XLF
Information on masses of Orion Nebula population stars is mostly restricted to the lightly obscured ONC population with spectroscopic study by Hillenbrand (1997, updated in Getman et al. 2005a). We examine here 523 COUP sources associated with stars with spectroscopic mass estimates; this sample is somewhat larger than the 481 stars considered by Preibisch & Feigelson (2005) because they truncate their sample at M⊙. We reiterate that this COUP sample is not a complete representation of the underlying cluster because a large fraction of very low mass cluster members are missing. These constitute an important fraction of the cluster IMF, but collectively contribute very little to the integrated X-ray luminosity.
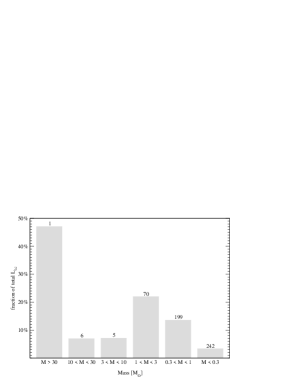
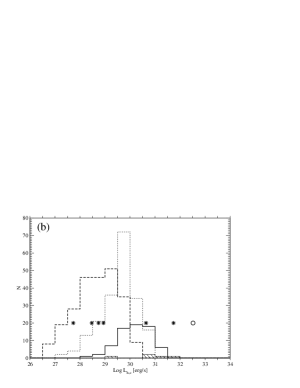
Table 2 gives the average and integrated luminosities of mass ranges in the ONC. Figure 4 summarizes the results by showing the percent of the total emission contributed by different mass strata. Figure 5 shows the mass-stratified differential XLFs. The table shows that 54% (34%) [47%] of the total nebula luminosity in the soft (hard) [absorption-corrected total] band is produced by the most massive M⊙ member, Ori C. Omitting Ori C from further consideration, Figure 5 show that the solar-mass stratum ( M⊙) dominates the integrated cluster X-ray luminosity, contributing about 41% (41%) [41%] in the soft (hard) [total] band. Stars around the peak of the IMF with masses M⊙ are individually fainter but more numerous. They collectively contribute 19% (32%) [26%] of the cluster luminosity. The very low mass stars and brown dwarfs contribute less than 7% of the ONC emission in all bands.
A clear trend of X-ray luminosities increasing with mass is seen in the XLFs (Figure 5). The trend was suggested in data (Feigelson et al., 1993) and is well-documented in studies of the ONC (Feigelson et al., 2003; Flaccomio et al., 2003; Preibisch et al., 2005a). Note that the M⊙ subsample does not obviously follow the trend. Stelzer et al. (2005) find that the ONC B star population does not have homogeneous X-ray properties: some are X-ray quiet, others have magnetically confined wind emission, and others emit over a wide range of luminosities due to unresolved lower mass companions.
Detection of individual sources in observations of distant YSCs will be flux limited at some level in the XLFs shown in Figure 5 depending on the cluster distance and the duration of the exposure . Note that sensitivities increase linearly with exposure time due to the low instrumental background, unless a bright diffuse X-ray component is present. A rough estimate of the on-axis ACIS point source sensitivity limit based on COUP is
The absorption dependence is obtained using the PIMMS software assuming a thermal plasma with keV. For the total band, the dependence on absorption is (see equation 3 of Feigelson et al. 2002).
For a short YSC observation with sensitivity limit erg s-1, only 15 stars at the high-luminosity tip of the cluster XLF are sampled (in addition to some high mass stars that we omit from consideration here) and these sources will often be detected only briefly near the peak of flares. With a sensitivity limit of erg s-1, 228 individual sources are detected. Most of these will be stars with M⊙. When the sensitivity is higher with erg s-1, 729 stars are detected. These comprise nearly all cluster members with M⊙ and most of the stars with M⊙. Sensitivities of erg s-1 capture 81% of the COUP population, or 1140 of 1408 stars including nearly all of the cluster population with M⊙. Only a modest improvement (15% of member stars) is made by further increasing the sensitivity down to erg s-1 due to the steep drop in the cluster XLF.
As the sensitivity limit increases from to 30.0 (29.0) [28.0] erg s-1 as one moves from distant to nearby YSCs, the integrated luminosity of the cluster stars which are not individually detected declines from 32.9 to 32.3 (32.2) [30.0] erg s-1. These photons will appear as a diffuse X-ray structure around the detected sources. In lower sensitivity images, the integrated emission from unresolved YSC stars can be confused with intrinsically diffuse plasma associated with O star wind shocks. This issue is discussed by Townsley et al. (2003).
5 Composite spectrum of ONC stars
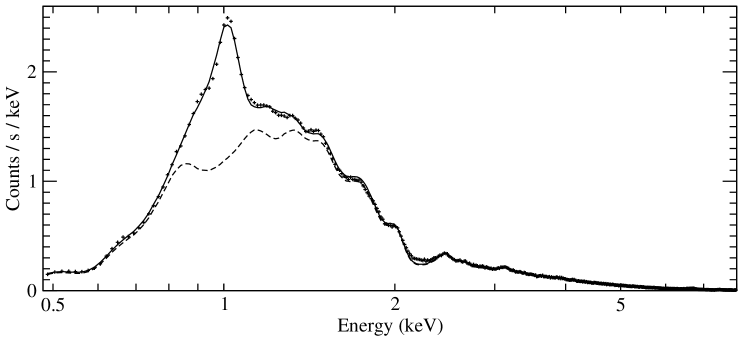
The lightly obscured subsample of 839 stars includes 19 which are strong enough to suffer photon pileup in the ACIS-I detector. We first considered the 820 COUP sources without pileup. The ACIS Extract software was used to create a composite spectrum and exposure-weighted auxiliary response files (ARFs) for spectral analysis using the XSPEC software (for details, see §7 of Getman et al., 2005a). The resulting composite spectrum and best-fit two-temperature model are shown in Figure 6. The model parameters are column density cm keV, keV with non-solar abundances. The integrated luminosity of these 820 stars over the total keV band is erg s-1; the luminosity of the 19 piled-up stars is erg s-1. Thus, the spectrum in Figure 6 constitutes about 40% of the lightly obscured Orion Nebula stellar X-ray emission.
Abundance excesses far above (factor of 10 or more) solar were found for oxygen, nitrogen, neon, magnesium, sulfur, argon, calcium and iron. The fit is not statistically valid and the reliability of the individual abundances is uncertain; this is not surprising given the enormous complexity of the plasma from hundreds of magnetically active stars. However, visual examination of the spectrum in Figure 6 shows that the strongest line complex is from Ne IX and Ne X lines around 1 keV222We also examined the composite spectrum of 19 piled-up cool stars, dividing each ARF by its point spread function fraction appropriate to the annular extraction region. It also shows a strong line complex around 1 keV.. The dashed spectrum shows the best-fit spectrum with the neon abundance artificially set at solar levels. The flux at 1 keV is effectively doubled by the excess neon, which constitutes about 7% of the total keV luminosity. Excess emission at 1 keV thus has the potential to be a useful diagnostic of magnetically active stars in YSCs, providing they are not so heavily obscured that the 1 keV emission is absorbed.
6 Absorption in the obscured population
The absorption of soft X-rays by bound-free electronic transitions provides a unique way to measure line-of-sight column densities of interstellar matter. ONIR extinction curves measure only dust particles, 21-cm emission measures only warm HI, and molecular line studies measure only specific gas-phase species. In comparison, X-ray absorption measures the integrated effects of various elements (C, O, N and Ne are most important although H and He play a significant role) in all phases of intervening material. The spectral dependence of the photoelectric absorption scales as (E/keV)-2.65 for a solar abundance mixture of elements (Wilms et al., 2000; Glassgold et al., 2000), and the integrated effect on the intrinsic spectrum is traditionally expressed in terms of the equivalent column density of hydrogen atoms along the line-of-sight. The most detailed study to date that compares X- ray absorption to ONIR dust extinction used obscured young stars in the Ophiuchi cloud to derive the gas-to-dust absorption ratio atoms cm-2 mag-1 (Vuong et al., 2003). A similar study of obscured COUP sources is underway. Because the absorption varies widely from to cm-1 ( to mag) from star to star in the COUP observations, and will also differ between YSCs depending on their location in the Galaxy and in their natal molecular cloud, the distribution of absorptions seen in Orion has no direct relevance to studies of other YSCs.
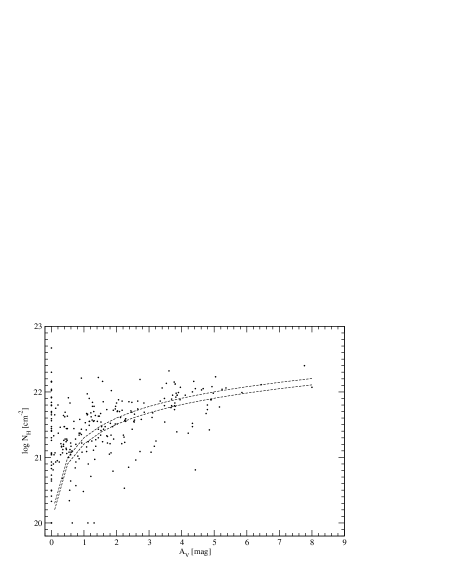
Figure 7 plots from COUP XSPEC fits (Getman et al., 2005a) against dust absorption derived by Hillenbrand (1997) from optical photometry and spectroscopy. The sample shown is restricted to 268 COUP sources with more than 1000 source counts333A similar plot constructed with ten times fewer photons for X-ray spectroscopic fitting by Feigelson et al. (2002) showed many more discrepant points. Some showed high with very low while others, as in Figure 7, showed zero with high . Such discrepant points are still present in the full COUP sample, but many disappear when the COUP data are restricted to sources with counts where the XSPEC fitting procedure is most reliable. The formal error on from XSPEC fitting is typically . We believe the scatter and discrepancies in the diagram shown here are probably no longer due to XSPEC fitting errors.. The COUP values generally, but not always, agree with the visual absorption for atoms cm-2 mag-1. The values set at represent cases where the photometric colors are too blue for the spectral type.
The discrepancies between and might arise from instrumental difficulties, such as erroneous choice of X-ray spectral model (as shown in Figure 6 of Getman et al. 2005) or errors in the optical photometry due to photospheric variability, binarity, scattered light, or inaccurate calibration of pre-main sequence photospheric colors. They may also represent unusual dust properties in the local environments around certain young stellar objects. SVS 16 in the NGC 1333 cloud and EC 95 in the Serpens cloud are two clear case where derived from infrared photometry was overestimated compared to the X-ray-derived (Getman et al., 2002; Preibisch, 2003), perhaps due to unusual geometries of circumstellar dust or the disappearance of the gaseous component of the disk. In the COUP sources with discrepant absorption measurements, may be too low because circumstellar disk grains have coagulated into large particles while the gas component is still present.
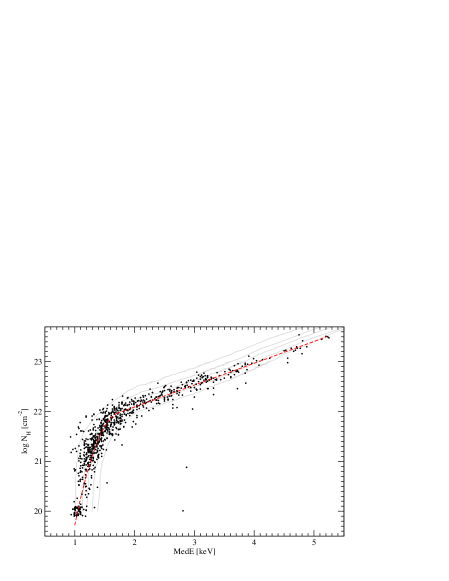
The COUP study can also provide practical guidance for estimation of individual measurements in YSCs where the signal may be insufficient for nonlinear parametric spectral modelling of individual sources. Figure 8 shows that the median energy of background-subtracted ACIS events for each source, the quantity listed in Table 3 of Getman et al. (2005), is a reliable indicator for the absorbing column density obtained from spectral fitting procedures. Other researchers have also found that median energies are effective spectral estimators in X-ray CCD spectroscopy (Hong et al., 2004). The nonlinear relationship can be empirically approximated by two curves444The quantitative relationship found here must be modified for observations obtained when the soft X-ray absorption of contaminating material on the ACIS-I filter differed substantially from the 2003 COUP observation. It also must be recalibrated to be used for observations taken with different telescopes and detectors, such EPIC on XMM-Newton.. For relatively soft sources keV, cm-2. For harder sources with keV, cm-2. A concatenation of these curves is plotted as the red dashed line in Figure 8. For values of around keV, the scatter is great and one can confidently conclude only that cm-2. Since is easily obtained for sources as faint as a few counts, which often dominate samples in distant and obscured YSCs, this empirical conversion from provides an effective procedure for approximating values for individual stars. Note that any source with keV is probably too soft to be a member of the low-mass Orion population even with no obscuration; such sources may be older foreground field disk stars or shocks from protostellar outflows.
Using the gray curves in Figure 8 derived from XSPEC simulations of absorbed one-temperature thermal spectra, we also note a trend of increasing temperature with increasing median energy. Plasma temperatures are typical for , and increase to for . This trend can further assist in characterizing distant and faint Orion population stars.
7 Summary
This study establishes the global X-ray properties of the stellar population associated with the Orion Nebula stellar population – the light-obscured Orion Nebula Cluster (ONC) and the heavily-obscured stars associated with molecular material in its vicinity. The analysis is based on the Orion Ultradeep Project’s 9.7 day observation of the region in January 2003 described by Getman et al. (2005). Care is taken to remove extragalactic and foreground contaminants from the sample. The information serves both to further understanding of the nearest rich YSC, and to use the Orion Nebula as a template for understanding less sensitive X-ray observations of more distant YSCs555Helfand & Moran (2001) perform a related calculation of the integrated X-ray luminosity arising from OB populations and obtain a range of luminosity erg s-1 per O star in the keV band. This is times larger than the value we obtain in the Orion Nebula because their result is dominated by the contributions of supernova remnants and X-ray binary systems from earlier generations of massive star formation. The Helfand-Moran value is more appropriate for large-scale and long-lived starburst complexes and galaxies, while our result is more applicable to small-scale and short-lived individual YSCs. Observers of distant high-mass star forming regions must exercise caution, as supernova remnants and X-ray binaries may be present near regions of current star formation..
The X-ray emission of the Orion Nebula region can be divided into three components: several OB stars dominated by Ori C, a rich population of 822 lightly obscured cool stars associated with the Orion Nebula Cluster, and a population of 559 heavily obscured stars. These components contribute roughly equally to the Orion Nebula stellar emission in the hard keV band; the integrated absorption-corrected luminosity of each component is about erg s-1 in the hard keV band and erg s-1 in the total keV band.
The lightly obscured sample shows a radial profile similar to that seen in optical and near-infrared samples. The inner region can be characterized by an isothermal core emitting erg s-1 pc-2 in the keV band. The COUP stars in the outer region on scales pc from Ori C show a strong spatial asymmetry that we attribute to a temporary period of violent relaxation in the dynamical evolution of the cluster. The obscured COUP sources show concentrations around both OMC-1 molecular cores. Their small-scale substructures indicate these stars are very young, probably with ages Myr.
The XLF of the lightly obscured sample is approximately lognormal in shape with erg s-1 and standard deviation . The peak of the XLF shape can serve as a standard candle for a new distance measure to YSCs across the Galactic disk. The obscured population shows a deficit in lower-luminosity stars, even in the hard band. This suggests a significant population of stars with localized circumstellar material producing column densities cm-2 is missing from the COUP sample. Mass-stratified XLFs show that, in the hard band, one-third of the Orion Nebula emission is produced by the X-ray-bright O6 star Ori C and half is produced by lower mass pre-main sequence stars with masses M⊙. The numerous very low mass stars and brown dwarfs contribute little to the total X-ray emission.
The integrated spectra of the low mass stars is well fit by a two-temperature plasma model with super-solar abundances of several elements. The neon line complex around 1 keV is particularly strong and might serve as a tracer of magnetically active stars in distant YSCs. We establish that the median energy of ACIS counts is an excellent predictor for the absorbing column density in Orion stars. However, discrepancies between from gas and visual absorption from dust are sometimes present. The cause of this is uncertain.
Using the keV hard band emission, we show that young stellar clusters like the Orion Nebula can be readily detected and resolved with across the Galactic disk, even in the presence of heavy obscuration. This confirms earlier arguments that X-ray telescopes can effectively trace star formation throughout the Galaxy (Montmerle, 1987; Montmerle & Grosso, 2002). For more distant clusters, however, only the brightest X-ray stars are individually detected while the remaining population is seen as a diffuse glow. Our study of the Orion Nebula as a template for X-ray studies of distant star forming regions gives this principle a stronger quantitative foundation.
References
- Babel & Montmerle (1997) Babel, J., & Montmerle, T. 1997, ApJ, 485, L29
- Bate et al. (1998) Bate, M. R., Clarke, C. J., & McCaughrean, M. J. 1998, MNRAS, 297, 1163
- Carpenter et al. (2001) Carpenter, J. M., Hillenbrand, L. A., & Skrutskie, M. F. 2001, AJ, 121, 3160
- Favata & Micela (2003) Favata, F., & Micela, G. 2003, Space Science Reviews, 108, 577
- Feigelson et al. (1993) Feigelson, E. D., Casanova, S., Montmerle, T., & Guibert, J. 1993, ApJ, 416, 623
- Feigelson et al. (2002) Feigelson, E. D., Broos, P., Gaffney, J. A., Garmire, G., Hillenbrand, L. A., Pravdo, S. H., Townsley, L., & Tsuboi, Y. 2002, ApJ, 574, 258
- Feigelson & Montmerle (1999) Feigelson, E. D., & Montmerle, T. 1999, ARA&A, 37, 363
- Feigelson et al. (2003) Feigelson, E. D., Lawson, W. A., & Garmire, G. P. 2003, ApJ, 599, 1207
- Feigelson et al. (2004) Feigelson, E. D., Hornschemeier, A. E., and 7 others 2004, ApJ, 611, 1107
- Feigelson (2005) Feigelson, E. D. 2005, in Cool Stars, Stellar Systems and the Sun 13 (F. Favata & J. Schmitt, eds.), ESA SP, in press
- Feigelson & Getman (2005) Feigelson, E. D., & Getman, K. V. 2005, in The Initial Mass Function: Fifty Years Later (E. Corbelli et al., eds.), Kluwer, in press
- Flaccomio et al. (2003) Flaccomio, E., Damiani, F., Micela, G., Sciortino, S., Harnden, F. R., Murray, S. S., & Wolk, S. J. 2003, ApJ, 582, 398
- Getman et al. (2002) Getman, K. V., Feigelson, E. D., Townsley, L., Bally, J., Lada, C. J., & Reipurth, B. 2002, ApJ, 575, 354
- Getman et al. (2005a) Getman, K.,V., Flaccomio, E. and 22 co-authours 2005, ApJS, in press, astro-ph/0410136
- Getman et al. (2005b) Getman, K. V., Feigelson, E. D., Grosso, N., McCaughrean, M., Broos, P., Garmire, G., Townsley, L. 2005, ApJS, submitted
- Glassgold et al. (2000) Glassgold, A. E., Feigelson, E. D., & Montmerle, T. 2000, in Protostars and Planets IV (V. Mannings et al., eds.), Univ. Arizona Press, 429
- Grosso et al. (2005) Grosso, N., Feigelson, E. D., and 13 others 2005, ApJS, submitted
- Güdel (2004) Güdel, M. 2004, A&A Rev., 12, 71
- Helfand & Moran (2001) Helfand, D. J., & Moran, E. C. 2001, ApJ, 554, 27
- Hillenbrand (1997) Hillenbrand, L. A. 1997, AJ, 113, 1733
- Hillenbrand & Hartmann (1998) Hillenbrand, L. A., & Hartmann, L. W. 1998, ApJ, 492, 540
- Hong et al. (2004) Hong, J., Schlegel, E. M., & Grindlay, J. E. 2004, ApJ, 614, 508
- Johnstone & Bally (1999) Johnstone, D., & Bally, J. 1999, ApJ, 510, L49
- Lada et al. (2004) Lada, C. J., Muench, A. A., Lada, E. A., & Alves, J. F. 2004, AJ, 128, 1254
- Lynden-Bell (1967) Lynden-Bell, D. 1967, MNRAS, 136, 101
- Montmerle (1987) Montmerle, T. 1987, in Starbursts and Galaxy Evolution (Thuan, T. X. et al., eds), Editions Frontieres, 47
- Montmerle & Grosso (2002) Montmerle, T., & Grosso, N. 2002, in The Origins of Stars and Planets: The VLT View (J. F. Alves & M. J. McCaughrean, eds.), Eur Southern Obs, 453
- Muno et al. (2004) Muno, M. P., et al. 2004, ApJ, 613, 326
- O’Dell (2001) O’Dell, C. R. 2001, ARA&A, 39, 99
- Preibisch (2003) Preibisch, T. 2003, A&A, 410, 951
- Preibisch et al. (2005a) Preibisch, T., Kim, Y.-C., Favata, F., and 8 others 2005, ApJS, submitted
- Preibisch et al. (2005b) Preibisch, T., McCaughrean, M., and 7 others 2005, ApJS, submitted
- Preibisch & Feigelson (2005) Preibisch, T. & Feigelson,, E. D. 2005, ApJS, submitted
- Ryter (1996) Ryter, C. E. 1996, Ap&SS, 236, 285
- Scally & Clarke (2002) Scally, A., & Clarke, C. 2002, MNRAS, 334, 156
- Stelzer et al. (2005) Stelzer, B., Flaccomio, E., Montmerle, T., Micela, G., Sciortino, S., Favata, F., Preibisch, T., Feigelson, E. D. 2005, ApJS, submitted
- Stevens et al. (1992) Stevens, I. R., Blondin, J. M., & Pollock, A. M. T. 1992, ApJ, 386, 265
- Townsley et al. (2003) Townsley, L. K., Feigelson, E. D., Montmerle, T., Broos, P. S., Chu, Y., & Garmire, G. P. 2003, ApJ, 593, 874
- Vuong et al. (2003) Vuong, M. H., Montmerle, T., Grosso, N., Feigelson, E. D., Verstraete, L., & Ozawa, H. 2003, A&A, 408, 581
- van der Werf & Goss (1989) van der Werf, P. P., & Goss, W. M. 1989, A&A, 224, 209
- Wilms et al. (2000) Wilms, J., Allen, A., & McCray, R. 2000, ApJ, 542, 914

| Quantity | Orion Nebula | Lt. obscured | Hv. obscured | Hot | Cool |
|---|---|---|---|---|---|
| members | cool stars | stars | stars | stars | |
| COUP cts | 15,060,010 | 6,160,850 | 1,046,160 | 7,853,000 | 7,207,010 |
| Num stars | 1408 | 839 | 559 | 10 | 1398 |
| Median luminosity per star | |||||
| 28.51 | 28.87 | 27.91 | 30.17 | 28.50 | |
| 28.90 | 28.71 | 29.09 | 30.41 | 28.90 | |
| 29.06 | 28.74 | 29.36 | 30.42 | 29.06 | |
| 29.15 | 29.13 | 29.14 | 30.57 | 29.14 | |
| 29.59 | 29.35 | 29.85 | 30.74 | 29.58 | |
| Integrated luminosity in sample | |||||
| 33.33 | 32.90 | 31.72 | 33.11 | 32.93 | |
| 33.14 | 32.77 | 32.61 | 32.60 | 33.00 | |
| 33.21 | 32.79 | 32.78 | 32.61 | 33.09 | |
| 33.55 | 33.14 | 32.66 | 33.22 | 33.27 | |
| 33.76 | 33.28 | 33.18 | 33.36 | 33.54 | |
| Quantity | ||||||
|---|---|---|---|---|---|---|
| M⊙ | M⊙ | M⊙ | M⊙ | M⊙ | M⊙ | |
| COUP cts | 6,344,400 | 1,430,720 | 1,119,870 | 3,149,960 | 1,376,130 | 349,019 |
| Num stars | 1 | 6 | 5 | 70 | 199 | 242 |
| Median luminosity per star | ||||||
| 33.03 | 30.17 | 30.75 | 30.15 | 29.49 | 28.92 | |
| 32.51 | 28.94 | 30.93 | 30.22 | 29.65 | 28.65 | |
| 32.52 | 28.94 | 30.97 | 30.26 | 29.69 | 28.66 | |
| 33.14 | 30.18 | 31.22 | 30.49 | 29.92 | 29.14 | |
| 33.29 | 30.74 | 31.43 | 30.69 | 30.16 | 29.39 | |
| Integrated luminosity in mass stratum | ||||||
| 33.03 | 32.31 | 32.17 | 32.60 | 32.26 | 31.66 | |
| 32.51 | 31.77 | 31.89 | 32.42 | 32.30 | 31.62 | |
| 32.52 | 31.77 | 31.90 | 32.44 | 32.33 | 31.65 | |
| 33.14 | 32.42 | 32.35 | 32.82 | 32.58 | 31.94 | |
| 33.29 | 32.46 | 32.47 | 32.96 | 32.75 | 32.14 | |