SBS 0335–052W: THE LOWEST-METALLICITY STAR-FORMING GALAXY KNOWN
Abstract
We present 4-meter Kitt Peak telescope and 6.5-meter MMT spectrophotometry of the extremely low-metallicity galaxy SBS 0335–052W, the western companion of the blue compact dwarf galaxy SBS 0335–052E. These observations have been combined with published 10-meter Keck data to derive for the brightest region of SBS 0335–052W an oxygen abundance 12 + log O/H = 7.12 0.03. This makes SBS 0335–052W the lowest metallicity star-forming galaxy known in the local universe. Using a Monte Carlo technique, we fit the spectral energy distribution of SBS 0335–052W to derive the age of the oldest stars contributing to its optical light. We find that star formation in SBS 0335–052W began less than 500 Myr ago, making it a likely nearby young dwarf galaxy.
1 Introduction
Since its discovery as one of the lowest-metallicity star-forming galaxies known (Izotov et al., 1990), with oxygen abundance 12 + log O/H 7.30 (Melnick et al., 1992; Izotov et al., 1997b, 1999; Thuan & Izotov, 2005), the blue compact dwarf (BCD) galaxy SBS 0335–052E has often been proposed as a nearby young dwarf galaxy (Izotov et al., 1990, 1997b; Thuan et al., 1997). It has thus been the subject of numerous multi-wavelength studies. On the other hand, its companion galaxy SBS 0335–052W, at a projected distance of 22 kpc from SBS 0335–052E, has attracted much less attention because of its lower brightness. It was discovered by Pustilnik et al. (1997) as a dwarf emission-line galaxy associated with the brightest of the two intensity peaks of 21 cm emission in the large (66 by 22 kpc) H i envelope surrounding SBS 0335–052E, with which the other H i peak is associated (Pustilnik et al., 2001).
There has only been one determination thus far of the oxygen abundance in SBS 0335–052W, that by Lipovetsky et al. (1999). They found that SBS 0335–052W consists of three regions of star formation and derived 12 + log O/H = 7.22 0.03 and 7.13 0.07 for the two brighter regions. Thus, the oxygen abundance in SBS 0335–052W was found to be lower than in SBS 0335–052E and about the same as that in the most metal-deficient BCD known, I Zw 18 with 12 +log O/H = 7.17 0.01 and 7.22 0.01 for its NW and SE components, respectively (Thuan & Izotov, 2005). Lipovetsky et al. (1999) discussed the evolutionary status of SBS 0335–052W and concluded that the galaxy is young, experiencing one of its first episodes of star formation. In this paper we present new observations of SBS 0335–052W to check and improve on its heavy element abundance determination. The observations and data reduction are discussed in Sect. 2. The element abundances are derived in Sect. 3. The evolutionary status of SBS 0335–052W is discussed in Sect. 4. Our main conclusions are given in Sect. 5.
2 Observations and Data Reduction
We have obtained spectrophotometric observations of SBS 0335–052W with the Kitt Peak 4-meter telescope111Kitt Peak National Observatory is operated by the Association of Universities for Research in Astronomy, Inc., under contract with the National Science Foundation. and the 6.5-meter MMT222MMT Observatory is a joint facility of the Smithsonian Institution and the University of Arizona.. The Kitt Peak observations were obtained on the night of 2003 January 1. They were made with the Ritchey-Chrétien spectrograph in conjunction with a 20482048 CCD detector. We use a 2″300″ slit with the KPC-10A grating in first order, and with a GG 375 order separation filter. The above instrumental set-up gave a spatial scale along the slit of 069 pixel-1, a scale perpendicular to the slit of 2.7Å pixel-1, a spectral range of 3600–7400Å and a spectral resolution of 7Å (FWHM). The total exposure time was 60 minutes, broken up into three 20 min subexposures. The MMT observations were obtained on 2005 February 4. The observations were made with a 2″300″ slit and the 800 grooves/mm grating in first order. This instrumental set-up gave a spatial scale along the slit of 06 pixel-1, a scale perpendicular to the slit of 0.75Å pixel-1, a spectral range of 3200–5200Å and a spectral resolution of 3Å (FWHM). The total exposure time was 45 minutes, broken up into three 15 minutes subexposures.
The two-dimensional spectra were reduced using IRAF333IRAF is distributed by National Optical Astronomical Observatory, which is operated by the Association of Universities for Research in Astronomy, Inc., under cooperative agreement with the National Science Foundation.. Since the seeing of 1″ – 2″ at both the Kitt Peak 4m telescope and the MMT was not good enough to obtain separate spectra for each of the two brightest star-forming regions in SBS0335–052W, we extracted a one-dimensional spectrum of only the brightest region within a 692″ aperture for the 4m spectrum and within a 6″2″ aperture for the MMT spectrum. The resulting redshift-corrected spectra of SBS 0335–052W are shown in the left panels of Figure 1. The observed line fluxes were corrected for both reddening (Whitford, 1958) and underlying hydrogen stellar absorption. The corrected fluxes of the lines used for the extinction and abundance determination, extinction coefficients (H), equivalent widths EW(H) of the H emission line and equivalent widths EW(abs) of the hydrogen absorption stellar lines are given in Table 1. The line flux errors listed include statistical errors derived from non-flux calibrated spectra, in addition to errors introduced in the standard star absolute flux calibration, which we set to 1% of the line fluxes. These errors will be later propagated into the calculation of abundance errors.
3 Physical Conditions and Element Abundances
To determine element abundances, we follow generally the procedures of Izotov et al. (1994, 1997a) and Thuan et al. (1995). We adopt a two-zone photoionized H ii region model: a high-ionization zone with temperature (O iii), where [O iii] and [Ne iii] lines originate, and a low-ionization zone with temperature (O ii), where [O ii], [N ii], [S ii] and [Fe iii] lines originate. As for the [S iii] lines they originate in the intermediate zone between the high and low-ionization regions (Garnett, 1992). The temperature (O iii) is calculated using the [O iii] 4363/(4959+5007) ratio. For other ionic temperatures, we use the relation between the electron temperatures (O iii) and (O ii), and that between (O iii) and (S iii) obtained by Izotov et al. (2005) from the H ii photoionization models of Stasińska & Izotov (2003). These are based on more recent stellar atmosphere models and improved atomic data as compared to Stasińska (1990) models. The [S ii] 6717/6731 ratio is used to determine the electron density (S ii) for the 4-meter data. As [S ii] emission lines were not in the observed wavelength region of the MMT spectrum, (S ii) was set to 10 cm-3 for those data. Ionic and total heavy element abundances are derived using expressions for ionic abundances and ionization correction factors obtained by Izotov et al. (2005). The element abundances for the 4-meter and MMT observations are given in the first two columns of Table 2 along with the adopted electron temperatures for different ions and electron number densities.
The derived oxygen abundance in the brightest region of SBS 0335–052W is extremely low, 12 + log O/H = 7.13 0.08 and 7.11 0.05 for the 4-meter telescope and MMT observations respectively, with a weighted mean of 7.12 0.04. This value is lower than the oxygen abundance of 7.31 0.01 in SBS 0335–052E, and of 7.17 0.01 and 7.22 0.01 respectively in the NW and SE components of I Zw 18 recently derived by Thuan & Izotov (2005). Our new value of the oxygen abundance in the brightest region of SBS 0335–052W is significantly different from the one of 7.22 0.03 derived by Lipovetsky et al. (1999) for the same region. It is similar, however, to the oxygen abundance of 7.13 0.08 derived by Lipovetsky et al. (1999) for the fainter region.
To resolve the discrepancy, we have reanalyzed the 10-meter Keck444The data presented herein were obtained at the W.M. Keck Observatory, which is operated as a scientific partnership among the California Institute of Technology, the University of California and the National Aeronautics and Space Administration. The Observatory was made possible by the generous financial support of the W.M. Keck Foundation. spectrum of Lipovetsky et al. (1999). We have remeasured the emission-line fluxes in both the bright and faint regions (Table 1) and derived respectively 12 + log O/H = 7.23 0.04 and 7.12 0.11, in very good agreement with those derived by Lipovetsky et al. (1999). The discrepancy is thus not caused by faulty line flux measurements. We next inspected the profiles of different emission lines in the Keck spectrum of the bright region. We found that while the profiles of other lines are symmetric and broad, the profile of [O iii] 4363 is asymmetric and narrower as if its red wing has been clipped off. The FWHM of this emission line is 30% narrower than that of the nearest and comparable in flux He i 4471 emission line. The discrepancy is thus apparently due to problems with the [O iii] 4363 emission line flux in the Keck spectrum. If the flux of this line is increased by 30%, then the oxygen abundance in the bright region is 7.12 0.04, in excellent agreement with the oxygen abundances derived from other observations (Table 2).
The weighted mean oxygen abundance for the bright region in SBS 0335–052W is thus 7.12 0.04 if only the 4-meter telescope and MMT observations are included, and 7.12 0.03 if the re-examined Keck observations of both bright and faint regions are added. This makes SBS 0335–052W the lowest-metallicity star-forming galaxy known in the local universe. Its metallicity is slightly lower than that of I Zw 18, by 0.05 dex (at the 2 level) for its NW component, and by 0.10 dex (at the 3 level) for its SE component. The other heavy elements to oxygen abundance ratios in SBS 0335–052W (Table 2) are in very good agreement with the mean ratios for the most metal-deficient BCDs (Thuan et al., 1995; Izotov & Thuan, 1999; Izotov et al., 2005).
It is important to note that the differences in metallicities between the three most metal-deficient gas-rich star-forming galaxies known in the local universe, SBS 0335–052 W, I Zw 18 and SBS 0335–052E, are very small, at the level of a few hundredths of a dex. Thus their ionized gaseous component is enriched at practically the same level, and on the basis of these three BCDs, there appears to exist a lowest observable metallicity of about 2% that of the Sun in star-forming galaxies, set by the pollution of the ionized gas by the current starburst (Kunth & Sargent 1986).
4 The Evolutionary Status of SBS 0335–052W
The extremely low metallicity of SBS 0335–052W suggests that it may be a young galaxy. However, this galaxy at a distance of 54.3 Mpc (e.g., Thuan & Izotov, 1997) is too far to be resolved into individual stars by HST. Therefore, the only way to derive its age is by studying its integrated spectroscopic and photometric properties.
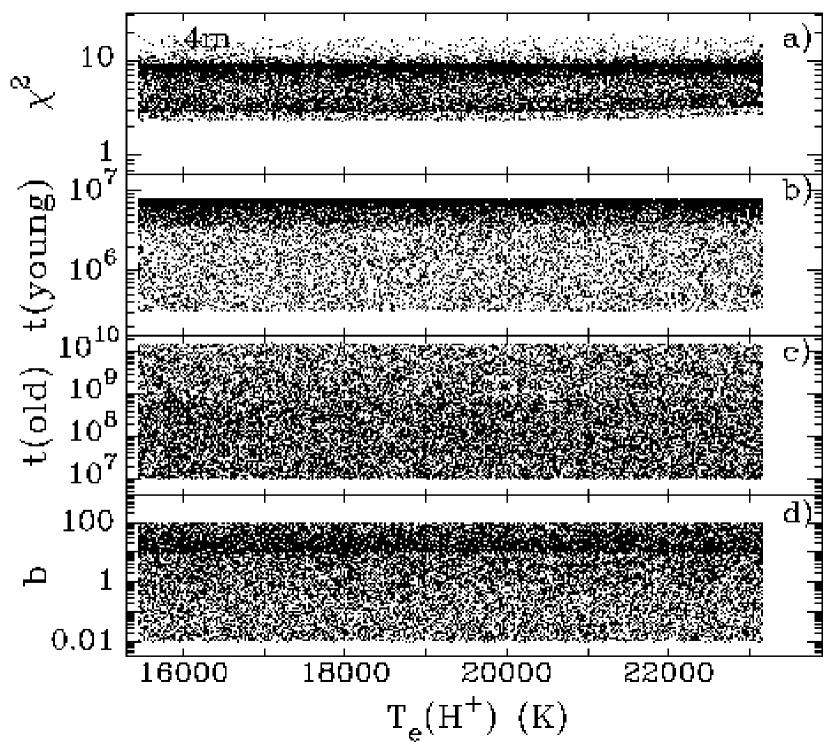
We have carried out a series of Monte Carlo simulations of the stellar populations in the bright region of SBS 0335–052W to reproduce the 4-meter, MMT and Keck spectral energy distributions (SEDs). We have used the Padua stellar evolution models (Girardi et al., 2000)555http://pleiadi.pd.astro.it. with a heavy element mass fraction = 0.0004, corresponding to the gaseous oxygen abundance in SBS 0335–052W. We have adopted a stellar initial mass function with a Salpeter slope, an upper mass limit of 100 and a lower mass limit of 0.1 . For the star formation history of SBS 0335–052W, we have considered two short bursts of star formation: a recent burst with age (young) varying between 0.5 and 8 Myr which accounts for the young stellar population and a prior burst with age (old) varying between 20 Myr and 15 Gyr and responsible for the older stars. CMD studies of star-forming dwarf galaxies (e.g., Izotov & Thuan, 2004) suggest that such a simple 2-burst model can reproduce adequately the main features of the stellar populations in these dwarfs. The contribution of each burst to the SED is defined by the ratio of the masses of stellar populations formed respectively in the old and young bursts, = (old)/(young), which we vary between 0.01 and 100. The contribution of gaseous emission is determined from the observed equivalent width (EW) of the H emission line. The fraction of gaseous continuum to total light depends on the adopted electron temperature (H+) in the H+ zone, since EW(H) for pure gaseous emission decreases with increasing (H+). Given that (H+) is not necessarily equal to (O iii), we chose to vary it in the range (0.8 – 1.2)(O iii). We assume that the extinction for the stellar light (stars) is close to that for the ionized gas, (gas). Both (stars) and (gas) are varied in the narrow range (0.95 – 1.05)(H), where (H) is the extinction derived from the hydrogen Balmer decrement (Table 1). We then run 106 Monte Carlo models varying simultaneously (gas), (stars), (young), (old), and (H+). To judge the goodness of each model’s fit to the observed SED, we have computed a for each Monte Carlo realization.
In Fig. 2a – 2d, we show the parameter space explored in 37,581 Monte Carlo realizations to fit the 4-meter spectrum, along with the s of these realizations. We do not show (gas) and (stars) as they vary in the narrow range of 5% around (H). The remaining realizations out of the 106 models run are not displayed in Fig. 2a – 2d because they predict a EW(H) which deviates by more than 10% from the observed one. It is seen that the age (old) of the old stellar population, the age (young) of the young stellar population and the ratio of their masses vary in a wide range. However, if only the best solutions with the lowest s are considered (Fig. 2e – 2h), then the range of these parameters is considerably narrowed. The best solution is seen to consist of an old stellar population with age 100 Myr, contributing 30% and 50% of the total stellar light at 4000Å and 7500Å respectively. Its mass is 6 times larger than the mass of the young stellar population, the age of which is 4 Myr. The best fit SED to the 4-meter spectrum is shown in Fig. 3a, with the contributions of the stellar and gaseous components shown separately. In the same manner, we have run 106 models to fit both the MMT and Keck spectra. Fig. 2i – 2l and Fig. 2m – 2p show the best solutions for the MMT and Keck spectra respectively, out of 34,408 and 61,177 Monte Carlo realizations which fit the observed EW(H). The solutions with the lowest s give (young) 4 Myr (MMT and Keck), (old) 500 Myr (MMT and Keck), 10 – 30 (MMT) and 6 (Keck), consistent with the values derived from the 4m spectrum. In the MMT spectrum, the old stellar population contributes 30% of the total stellar light at 4200Å, while in the Keck spectrum this contribution is lower, 10%. The difference is presumably due to the smaller 1″180″ slit used in the Keck observations. Varying the stellar IMF slope in the range = –2 - –3 and the lower stellar mass limit in the range 0.1 - 1 do not change significantly our age estimates. The best fits of the observed MMT and Keck spectra are shown in Figs. 3b and 3c.
Our age estimates of the oldest stellar population in SBS 0335–052W obtained from fitting the SEDs are in good agreement with those obtained by Pustilnik et al. (2004) from broad-band photometry of the extended low-surface-brightness underlying component. Those authors found that the , and colors of the outer regions of SBS 0335–052W are consistent with an age 1 Gyr. Only the color gives a larger age. However, age determination from the latter color is less reliable as there is a significant contamination of the band by H gaseous emission. Thus the good agreement between our derived ages and those derived from photometric data of the outer regions of SBS 0335–052W shows that the SED fitting technique is quite sensitive to the the presence of old stellar populations, despite the fact that 4m, MMT and Keck spectra cover only the small brightest part of SBS 0335–052W.
In summary, SBS 0335–052W appears to be a young galaxy with the age of its oldest stars not exceeding 500 Myr, as in the case of I Zw 18 (Izotov & Thuan, 2004).
5 Conclusions
Our new spectroscopic observations of the dwarf star-forming galaxy SBS 0335–052W with the 4-meter telescope and the 6.5-meter MMT have led us to the following conclusions:
1. The weighted mean oxygen abundance in SBS 0335–052W is 12 + log O/H = 7.12 0.04 based on present observations, and 7.12 0.03 if previous 10-meter Keck observations by Lipovetsky et al. (1999) are reanalyzed and added. This makes SBS 0335–052W the lowest-metallicity star-forming galaxy known.
2. Monte Carlo simulations of the spectral energy distributions of SBS 0335–052W by varying the ages of the young and old stellar populations and their mass ratio show that the age of the oldest stars is not greater than 500 Myr. Thus, SBS 0335–052W is likely a nearby young galaxy.
References
- Garnett (1992) Garnett, D. R. 1992, AJ, 103, 1330
- Girardi et al. (2000) Girardi, L., Bressan, A., Bertelli, G., & Chiosi, C. 2000, A&AS, 141, 371
- Izotov & Thuan (1999) Izotov, Y. I., & Thuan, T. X. 1999, ApJ, 511, 639
- Izotov & Thuan (2004) Izotov, Y. I., & Thuan, T. X. 2004, ApJ, 616, 768
- Izotov et al. (1990) Izotov, Y. I., Guseva, N. G., Lipovetsky, V. A., Kniazev, A. Y., & Stepanian, J. A. 1990, Nature, 343, 238
- Izotov et al. (1994) Izotov, Y. I., Thuan, T. X., & Lipovetsky, V. A. 1994, ApJ, 435, 647
- Izotov et al. (1997a) Izotov, Y. I., Thuan, T. X., & Lipovetsky, V. A. 1997a, ApJS, 108, 1
- Izotov et al. (1997b) Izotov, Y. I., Lipovetsky, V. A., Chaffee, F. H., Foltz, C. B., Guseva, N. G., & Kniazev, A. Y. 1997b, ApJ, 476, 698
- Izotov et al. (1999) Izotov, Y. I., Chaffee, F. H., Foltz, C. B., Green, R. F., Guseva, N. G., & Thuan, T. X. 1999, ApJ, 527, 757
- Izotov et al. (2005) Izotov, Y. I., Stasińska, G., Meynet, G., Guseva, N. G., & Thuan, T. X. 2005, A&A, submitted
- Kunth & Sargent (1986) Kunth, D., & Sargent, W. L. W. 1986, ApJ, 300, 496
- Lipovetsky et al. (1999) Lipovetsky, V. A., Chaffee, F. H., Izotov, Y. I., et al. 1999, ApJ, 519, 177
- Melnick et al. (1992) Melnick, J., Heydari-Malayeri, M., & Leisy, P. 1992, A&A, 253, 16
- Pustilnik et al. (1997) Pustilnik, S. A., Lipovetsky, V. A., Izotov, Y. I., et al. 1997, Ast.L., 23, 308
- Pustilnik et al. (2001) Pustilnik, S. A., Brinks, E., Thuan, T. X., Lipovetsky, V. A., & Izotov, Y. I. 2001, AJ, 121, 1413
- Pustilnik et al. (2004) Pustilnik, S. A., Pramskij, A. G., & Kniazev, A. Y. 2004, A&A, 425, 51
- Stasińska (1990) Stasińska G. 1990, A&AS, 83, 501
- Stasińska & Izotov (2003) Stasińska, G., & Izotov, Y. I. 2003, A&A, 397, 71
- Thuan & Izotov (1997) Thuan, T. X., Izotov, Y. I. 1997, ApJ, 489, 623
- Thuan & Izotov (2005) Thuan, T. X., Izotov, Y. I. 2005, ApJS, submitted
- Thuan et al. (1995) Thuan, T. X., Izotov, Y. I., & Lipovetsky, V. A. 1995, ApJ, 445, 108
- Thuan et al. (1997) Thuan, T. X., Izotov, Y. I., & Lipovetsky, V. A. 1997, ApJ, 477, 661
- Whitford (1958) Whitford, A. E. 1958, AJ, 63, 201
| Ion | 4m | MMT | Keck | |
|---|---|---|---|---|
| bright region | faint region | |||
| 3727 [O ii] | 70.62.9 | 69.41.7 | ||
| 3836 H9 | 6.52.1 | 7.51.1 | ||
| 3868 [Ne iii] | 10.71.2 | 10.90.7 | ||
| 3889 He i+H8 | 18.51.7 | 20.71.1 | ||
| 3969 [Ne iii]+H7 | 19.11.7 | 18.20.9 | ||
| 4101 H | 25.81.5 | 26.41.1 | 26.61.3 | 24.73.9 |
| 4340 H | 48.11.5 | 47.51.2 | 46.21.1 | 44.32.8 |
| 4363 [O iii] | 4.00.8 | 4.10.5 | 4.40.4aaThe measured flux is 3.4 0.4. It has been increased by 30% as discussed in the text. | 4.41.1 |
| 4471 He i | 2.60.8 | 3.40.4 | 3.70.3 | 3.80.9 |
| 4861 H | 100.02.0 | 100.01.9 | 100.01.7 | 100.02.4 |
| 4959 [O iii] | 43.01.1 | 41.80.9 | 44.30.7 | 43.81.0 |
| 4988 [Fe iii] | 1.30.2 | |||
| 5007 [O iii] | 124.12.4 | 123.22.2 | 131.32.1 | 130.22.4 |
| 5876 He i | 9.10.6 | 9.40.2 | 9.60.4 | |
| 6300 [O i] | 1.40.1 | |||
| 6312 [S iii] | 0.50.1 | |||
| 6563 H | 274.35.3 | 274.34.6 | 273.45.2 | |
| 6583 [N ii] | 2.50.7 | 2.00.1 | 2.10.3 | |
| 6678 He i | 1.90.6 | |||
| 6717 [S ii] | 5.10.6 | |||
| 6731 [S ii] | 4.40.7 | |||
| 7065 He i | 2.00.7 | |||
| (H) dex | 0.060.02 | 0.120.02 | 0.130.02 | 0.000.02 |
| EW(H) Å | 821 | 801 | 1051 | 1201 |
| EW(abs) Å | 1.40.4 | 0.80.5 | 5.90.4 | 3.81.8 |
| Property | 4m | MMT | Keck | weighted | |
|---|---|---|---|---|---|
| bright regionaaElectron temperatures and element abundances are derived with the corrected flux of the [O iii] 4363 emission line. Without that correction, the oxygen abundance would have been 12 + log O/H = 7.23 0.04. | faint region | mean | |||
| (O iii)(K) | 194002240 | 197701330 | 198401030 | 199003040 | |
| (O ii)(K) | 155501670 | 15590 970 | 15600 750 | 156002200 | |
| (S iii)(K) | 183501860 | 186001100 | 18650 850 | 186902520 | |
| (S ii)(cm-3) | 330100 | 10 | 10 | 10 | |
| O+/H+(105) | 0.60 0.16 | 0.56 0.09 | 0.56 0.07bbThe abundance is calculated from the relative flux of the [O ii] 3727 line derived from the MMT spectrum. | 0.56 0.20bbThe abundance is calculated from the relative flux of the [O ii] 3727 line derived from the MMT spectrum. | |
| O++/H+(105) | 0.77 0.20 | 0.72 0.11 | 0.77 0.09 | 0.75 0.26 | |
| O/H(105) | 1.36 0.26 | 1.28 0.14 | 1.33 0.11 | 1.32 0.33 | |
| 12 + log(O/H) | 7.13 0.08 | 7.11 0.05 | 7.12 0.04bbThe abundance is calculated from the relative flux of the [O ii] 3727 line derived from the MMT spectrum. | 7.12 0.11bbThe abundance is calculated from the relative flux of the [O ii] 3727 line derived from the MMT spectrum. | 7.12 0.03 |
| N+/H+(107) | 1.70 0.46 | 1.39 0.12 | 1.42 0.37 | ||
| ICF(N) | 2.30 | 2.38 | 2.36 | ||
| log(N/O) | –1.54 0.14 | –1.61 0.05 | –1.59 0.16 | –1.60 0.04 | |
| Ne++/H+(105) | 0.15 0.04 | 0.14 0.02 | |||
| ICF(Ne) | 1.19 | 1.19 | |||
| log(Ne/O) | –0.89 0.20 | –0.88 0.11 | –0.88 0.10 | ||
| S+/H+(107) | 0.89 0.16 | ||||
| S++/H+(107) | 1.58 0.40ccThe abundance is calculated from the relative flux of the [S iii] 6312 line derived from the Keck spectrum. | ||||
| ICF(S) | 0.93 | ||||
| log(S/O) | –1.77 0.11ccThe abundance is calculated from the relative flux of the [S iii] 6312 line derived from the Keck spectrum. | –1.77 0.11 | |||
| Fe+/H+(106) | 0.22 0.03 | ||||
| ICF(Fe) | 3.13 | ||||
| log(Fe/O) | –1.28 0.08 | –1.28 0.08 | |||