22institutetext: INAF - Osservatorio Astronomico di Roma, Via di Frascati, 33, I–00040 Monte Porzio Catone (Roma), Italy
A continuous Flaring- to Normal-branch transition in Sco~X-1
We report the first resolved rapid transition from a Flaring Branch Oscillation to a Normal Branch Oscillation in the RXTE data of the Z source Sco~X-1. The transition took place on a time scale of 100 seconds and was clearly associated to the Normal Branch-Flaring Branch vertex in the color-color diagram. We discuss the results in the context of the possible association of the Normal Branch Oscillation with other oscillations known both in Neutron-Star and Black-Hole systems, concentrating on the similarities with the narrow 4-6 Hz oscillations observed at high flux in Black-Hole Candidates.
Key Words.:
Accretion, accretion disks – X-rays: binaries – stars: individual: Sco X-11 Introduction
Neutron star Low Mass X-ray Binaries are usually classified in two classes, the Z and the atoll sources; these names are based on the shape that individual sources describe in the color-color diagrams as a result of changes taking place in the sources (CDs, Hasinger & van der Klis (1989), van der Klis (2005)). The atoll sources trace a pattern consisting of a single curved branch (banana branch), together with a smaller “island”, while the pattern traced by Z sources is characterized by three branches called horizontal branch, normal branch and flaring branch respectively. Three types of Low-frequency Quasi-Periodic Oscillations (LFQPOs) have been associated with the position along the Z: the HBOs (horizontal branch oscillations), the NBOs (normal branch oscillations) and the FBOs (flaring branch oscillations).
NBOs with frequencies between 4.5 and 7 Hz have been reported from all Z sources. Their fractional rms amplitude is typically between 1 and 3 % in the 1-10 keV band, and are strongest near the middle of the NB. FBOs were seen only in two sources (Sco~X-1, Priedhorsky et al. (1986); GX~17+2, Homan et al. (2002)), while a broad excess that may be due to an FBO peak moving rapidly in frequency as the source moves rapidly up and down the FB has been reported in other sources (see e.g. GX~5-1, Jonker et al. (2002)). FBOs occur on a small part (10 % of the total extent) of the Flaring Branch (FB) nearest the NB, and have frequencies in the range 6-25 Hz, increasing from the NB-FB vertex through the FB. With increasing frequency, the fractional amplitude of the FBOs remains approximately constant, while its width increases until the peak becomes too broad to distinguish from the broad band noise in the power density spectrum (the so-called high frequency noise, HFN).
NBOs and FBOs are thought to be physically related, since in Sco~X-1 the NBO frequency joins to the FBO frequency as the source moves from the NB to the FB. However, the increase from 6 Hz to 10 Hz occurs in a very short segment of the Z track located just at the vertex of the NB-FB junction, and is at present still unresolved (Dieters & van der Klis (2000)). The transition is even less clear in GX~17+2: Homan et al. (2002)) found that near the NB-FB vertex the frequency of the FBO was a factor of 2 higher than that of the NBO, which could mean that the NBO and FBO are harmonically related. However, by inspecting all single dynamical power spectra of observations with values of the curvilinear coordinate (tracking the position along the Z pattern, see van der Klis (1995)) around 2 (corresponding to the NB-FB vertex), they found in some cases QPOs with intermediate frequencies (10 Hz), suggesting that the frequency does not jump directly from 7 to 14 Hz. However no clear transitions were found.
At present, it is currently believed that NBOs and FBOs are different manifestations of the same phenomenon, the properties of which rapidly change at around the position of the lower vertex in the Z track. However, the transition between them has not yet been unambiguously resolved. In this paper we present the analysis of a RXTE observation of Sco~X-1 in which for the first time a clear continuous fast transition from a Normal Branch Oscillation to a Flaring Branch Oscillation is seen and which is associated with the NB-FB vertex in the Z track.
2 Data analysis
We analyzed a RXTE/PCA observation of Sco~X-1, from the RXTE public archive, made on MJD 50230 (1996-05-27). The observation consists of three continuous data intervals of 1600, 550 and 2000 s duration respectively. All five PCA units were on during the whole observation. The PCA data were obtained in several simultaneous different modes (see Tab. 1). During the first interval, the pointing direction was offset by 0.3 deg, while in the other two intervals the offset was reduced to 0.005 deg. For this reason we could not build the expected Z-track across the whole observation. We concentrated our analysis on the first of the three data intervals, during which a variable low frequency (6-15 Hz) QPO was detected.
We used Standard2 data to produce a color-color diagram (CD). For each 16 s data segment (the intrinsic resolution of the Standard2 mode), we defined two colors as ratios of count rates in two different energy bands. The energy bands used for the colors (soft and hard color) are given in Table 2. The CD is shown in Figure 1: Sco~X-1 was in its Flaring Branch (FB) at the beginning of the observation, and moved into the Normal Branch (NB) after 200 seconds.

Since the Z track is not complete, we could not use the usual rank number used in literature, which is defined using both vertices (Hasinger et al. 1990). In order to check the presence of a QPO along the Z track, we divided the CD in 14 intervals and calculated a power spectrum (with a Nyquist frequency of 128 Hz) for each of them by averaging power spectra calculated every 16 s data interval. The two power spectra corresponding to the extremes of the CD (#1 and #14), together with three power spectra approximately corresponding to the vertex (#9, #10 and #11) are shown in Figure 2.

We then fitted each power spectrum with a combination of a simple power law and a broad Lorentzian shape, approximating the broad band noise, and a narrow Lorentzian shape, approximating the QPO peak. For the intervals in the FB an additional narrow (1) Lorentzian shape was needed, in order to better approximate the asymmetric profile of the FBO peak. PDS fitting was carried out with the standard Xspec fitting package, by using a one-to-one energy-frequency conversion and a unit response. Because of the low intensity of the broad band noise, the parameters of the power law and those of the broad Lorentzian were not well constrained, and their behavior could not be studied. However, since the intensity of the QPO peak was high in all intervals, the uncertainties in the underlying continuum did not impact much on the estimate of the peak parameters.


In the upper panel of Figure 3 we plot the QPO centroid frequency as a function of the interval number. The evolution of the QPO peak is evident: the centroid frequency was 6 Hz when the source was in the upper part of the visible NB, slowly increased up to 7.5 Hz when the source approached the FB-NB vertex, then quickly increased up to 15 Hz in the FB. In the bottom panel of Figure 3, the total fractional rms and the QPO fractional rms are shown as a function of the interval number. Both slowly increase through the NB towards the vertex, and reach their maximum in the FB. The total rms slightly decreases after the vertex, while the QPO rms is consistent with remaining constant.
The transition appears to be very fast, as a result of the fast passage of the source through the NB-FB vertex. In order to track more finely the QPO frequency as a function of time, we produced a dynamical power spectrum for the whole observation by calculating a power spectrum every 4 seconds over PCA channels 0-35 (corresponding approximately to the 2-13 keV energy range) and with a time resolution of 1/128 s (corresponding to a Nyquist frequency of 64 Hz). The dynamical power spectrum and the correspondent light curve of the first 500 seconds of the observation, when the frequency transition occurred, are shown in Figure 4.
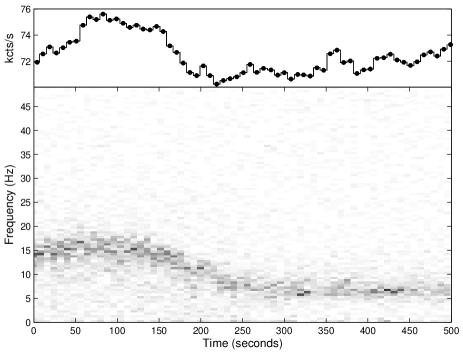
The transition is clearly visible in the dynamical power spectrum: the QPO peak at the beginning of the observation (when the source is in its FB) is at frequencies 14 Hz, has a maximum at 15 Hz after less than 100 seconds, and rapidly decreases (corresponding to the FB-NB vertex) after few hundred seconds to 6 Hz. The peak remains then visible in the dynamical power spectrum at 6 Hz in the remaining part of the observation, during which the source is in the NB.
3 Discussion
We presented the first continuous monitoring of a rapid transition between Flaring Branch and Normal Branch Oscillations. Even though the transition could not be continuously tracked through the Z pattern in the CD, the high statistics of the data makes it visible in the dynamical power spectrum, where it is resolved to take place in 100 seconds.
The presence of the NBO/FBO in the Z sources has often been related to the fact that these sources accrete at near-Eddington mass accretion rates. It is thought that at these high mass accretion rates a significant fraction of the accretion flow is in the form of a thick, perhaps nearly spherical flow. Also, the effects of radiation pressure are thought to play an important role in this regime. Fortner, Lamb & Miller (1989) suggested that the NBOs are the result of a radiation force/opacity feed-back mechanism within a spherical flow region. For reasonable physical parameters, the frequency of the NBOs is predicted to be 6 Hz at the onset of the process, and then to increase to 10 Hz as the luminosity approaches . These oscillations can furthermore excite other modes with similar frequencies, which are expected to increase as the luminosity approaches and then exceeds . However, it is not clear if the similarity of these two oscillation types can be as high as required to explain the smoothness of the transition reported in Sco~X-1 (see Figure 4). Another model for the NBOs was proposed by Alpar et al. (1992), in which the NBO frequency is basically that of sound waves in a thickened accretion disk. However, this model does not explain how the NBO changes into the FBO. A strong challenge for these models is the recent discovery of 6 Hz QPOs, with properties similar to those of NBOs, in atoll sources (see e.g. Wijnands, van der Klis & Rijkhorst 1999, Wijnands & van der Klis 1999, Belloni, Parolin & Casella 2004), in which the mass accretion rate is always lower than the Eddington limit.
Casella, Belloni & Stella (2005) recently reviewed and further extended the similarities between the LFQPOs observed in Z sources and the three main types of LFQPOs observed in Black-Hole Candidates (BHCs, see the cited work and references therein), and proposed a one-to-one association where the C-, B- and A-Type observed in BHCs correspond respectively to the HBO, NBO and FBO observed in Z sources. Whatever the physical mechanisms that determines these oscillations are, the presence of such mechanisms in both types of compact objects would clearly favor a disk origin for these oscillations, ruling out all models that involve any interaction with the surface or the magnetosphere of the neutron star (see e.g. Stella, Vietri & Morsink 1999; see also Kluzniak 2004).
In this context, the smooth continuous transition between the NBOs and the FBOs appears to be very different from the fast, unresolved transitions observed between type-B and type-A QPOs in BHCs (Nespoli et al. 2003; Casella et al. 2004), i.e. the equivalent of NBOs and FBOs in this analogy. At present it is in fact not clear whether type-B and type-A QPOs originate from the same physical phenomenon, the properties of which can change in a short time scale (less than a few tens of seconds in the known cases), or if they are two distinct phenomena, one of which (type-A) is too weak to be detected when the other (type-B) is present (see e.g. Nespoli et al. 2003). Available data at present do not permit us to address this issue, and more observations (and/or better statistics) are needed.
Acknowledgements.
This work was partially supported by the Italian Ministry of Education, University and Research under CO-FIN grants 2002027145 and 2003027534.References
- Alpar & Shaham (1985) Alpar, M. A., & Shaham, J., 1985, Nature, 316, 239
- Alpar et al. (1992) Alpar, M. A., Hasinger, G., Shaham, J., & Yancopoulos, S., 1992, A&A, 257, 627
- Belloni, Parolin & Casella (2004) Belloni, T., Parolin, I., & Casella, P., 2004, A&A, 423, 969
- Casella et al. (2004) Casella, P., Belloni, T., Stella, L., & Homan, J., 2004, A&A, 426, 587
- Casella, Belloni & Stella (2005) Casella, P., Belloni, T., & Stella, L., 2005, ApJ, accepted (preprint: astro-ph/0504318)
- Dieters & van der Klis (2000) Dieters, S. W., & van der Klis, M., 2000, MNRAS, 311, 201
- Fortner, Lamb & Miller (1989) Fortner, B., Lamb, F. K., & Miller, G. S, 1989, Nature, 342, 775
- Hasinger & van der Klis (1989) Hasinger, G., & van der Klis, M., 1989, A&A, 225, 79
- Homan et al. (2002) Homan, J., van der Klis, M., Jonker, P. G., Wijnands, R., Kuulkers, E., Mendez, M., & Lewin, W. H. G., 2002, ApJ, 568, 878
- Jonker et al. (2002) Jonker, P. G., van der Klis, M., Homan, J., Mendez, M., Lewin, W. H. G., Wijnands, R., & Zhang, W., 2002, MNRAS, 333, 665
- Kluzniak (2004) Kluszniak, W., 2004, Revista Mexicana de Astronom a y Astrof sica (Serie de Conferencias) Vol. 20. IAU Colloquium 194, pp. 128-129 (2004)
- Nespoli et al. (2003) Nespoli, E., Belloni, T., Homan, J., Miller, J. M., Lewin, W. H. G., Mendez, M., & van der Klis, M., 2003, A&A, 412, 235
- Priedhorsky et al. (1986) Priedhorsky, W., Hasinger, G., Lewin, W. H. G., Middleditch, J., Parmar, A., Stella, L., & White, N., 1986, ApJ, 306, L91
- Stella, Vietri & Morsink (1999) Stella, L., Vietri, M., Morsink, S. M., 1999, ApJ, 524, L63
- van der Klis (1995) van der Klis, M., 1995, in “X-ray binaries”, eds. Lewin, W. H. G., van Paradijs, J. and van den Heuvel, E. P. J., Cambridge University Press, Cambridge, p. 252
- van der Klis (2005) van der Klis, M., 2005 in “Compact Stellar X-Ray Sources”, eds. W.H.G. Lewin and M. van der Klis, Cambridge University Press, in press
- Wijnands & van der Klis (1999) Wijnands, R., & van der Klis, M., 1999, ApJ, 522, 965
- Wijnands, van der Klis & Rijkhorst (1999) Wijnands, R., van der Klis, M., & Rijkhorst, E., 1999, ApJ, 512, L39