Imaging of the Radio Remnant of SN 1987A at 12 mm wavelength
Abstract
Observations of the radio remnant of Supernova 1987A using the Australia Telescope Compact Array in the 12-mm band on 2003 July 31 (day 6002.7 after the explosion) give the first fully resolved radio image of the supernova remnant. The diffraction-limited image has a resolution of about 045, a factor of two better than that of the 3-cm images previously obtained. There is excellent agreement between the 12-mm image and a contemporaneous super-resolved 3-cm image. Super-resolution of the 12-mm image gives a further factor of two improvement in resolution, to , albeit with limited dynamic range. While the spatial distributions of the radio and X-ray emission are broadly similar, there are significant differences in detail with no correspondence in the regions of brightest emission. The 12-mm image is well modelled by a thick equatorial ring inclined at to the line of sight. This, together with the common east-west asymmetry and the relatively steady increase in the radio flux density, suggests that the reverse shock is the main site for generation of the radio emission.
Subject headings:
supernova remnants — supernovae:individual(SN 1987A) — radio continuum: ISM1. Introduction
Supernova 1987A, the brightest and closest supernova (SN) in nearly 400 years, was first observed on 1987 February 24. The supernova, located in the Large Magellanic Cloud, illuminated and ionized much of the circumstellar material, resulting in the dramatic optical rings seen in recombination-line emission (Burrows et al., 1995; Sugerman et al., 2002) and scattered light (e.g., Crotts et al., 1995; Sugarman et al., 2005). Hubble Space Telescope imaging has revealed a series of “hot spots” around the inner edge of the central equatorial ring, indicating that the SN blast wave is beginning to impact on the denser circumstellar material of the equatorial ring (Sugerman et al., 2002). Spectral imaging of high-velocity ( km s-1) Ly and H emission has enabled mapping of the reverse shock formed behind the blast wave (Michael et al., 2003). These observations show that in 2000 – 2001, around 5000 days after the SN, the reverse shock had a radius of about 75% that of the equatorial ring and was expanding at about 80% of the blast-wave velocity. The shock appears about 40% brighter in the eastern quadrant and is concentrated within of the equatorial plane.
SN 1987A was observed as a short-lived radio supernova in the weeks following the optical supernova (Turtle et al., 1987). It was redetected in mid-1990 (around day 1200) when increasing radio emission signalled the birth of the supernova remnant (SNR) (Staveley-Smith et al., 1992). Observations with the Molonglo Observatory Synthesis Telescope and Australia Telescope Compact Array (ATCA) show that, at least up until the beginning of 2001, the SNR radio emission has increased nearly linearly with time at frequencies between 843 MHz and 9 GHz (Ball et al., 2001; Manchester et al., 2002). The radio emission appears to be optically thin synchrotron emission with a power-law spectrum of index about . From late-1992 the SNR has been strong enough to resolve at 9 GHz, showing that radio emission is annular in form, contained within the optical equatorial ring and expanding at about 3000 km s-1 (Staveley-Smith et al., 1993; Gaensler et al., 1997; Manchester et al., 2002). The radio emission peaks on the eastern and western sides of the ring and is signficantly brighter on the eastern side. These images had an effective resolution of about 05 and relied on the use of “super-resolution” techniques in which visibilities in the outer parts of the sampled plane are given higher weight. The resulting images are inherently uncertain since the solution extrapolates into unsampled parts of the uv-plane.
X-ray emission was first detected from SN 1987A about 1500 days after the explosion (Gorenstein et al., 1994; Beuermann et al., 1994). Recent observations with the Chandra X-ray Observatory (Park et al., 2004, 2005) show that the X-ray luminosity is increasing dramatically with a doubling time of about 600 days. Chandra imaging observations taken in 2000 December (Park et al., 2002) showed different spatial distributions for the lower energy (0.3 – 1.2 keV) photons and those at higher energies (1.2 – 8 keV). The lower energy emission was concentrated in hot spots around the inner edge of the equatorial ring and was closely correlated with the optical emission, whereas the higher energy emission was slightly more central and apparently related to the radio emission with a pronounced east-west asymmetry. In the more recent images, this distinction appears to have disappeared with the emission more uniformly distributed around the ring at all energies.
Receivers operating in the 12-mm band (16 – 26 GHz) were installed on three antennas of the ATCA in 2001 October and on the remaining three antennas in 2003 April, giving a 6-km maximum baseline. One of the major scientific justifications for development of the 12-mm system was to obtain radio images of SNR 1987A with a resolution comparable to those obtained by the Hubble Space Telescope and the Chandra X-ray Observatory. SNR 1987A was observed at 12 mm on 2001 October 27 (day 5360 after the SN) with a 1.5-km maximum baseline. While these observations just marginally resolved the SNR, they gave flux densities of and mJy at 17 and 19 GHz, respectively (Manchester & Gaensler, 2001). In this paper we report on 12-mm observations of SNR 1987A made on 2003 July 31 (day 6002.7) with six antennas over the full 6-km baseline in exceptionally stable atmospheric conditions.
2. Observations and Results
SNR 1987A was observed for 11 hours on 2003 July 31 using the 6D configuration of the ATCA with 12-mm receivers on each of the six antennas. Observations were obtained in two bands simultaneously, each of 128 MHz bandwidth, and centered on frequencies of 17.34 and 19.65 GHz respectively. Two phase calibrators were observed: 0541-7332 for 2 min at approximately 10-min intervals and 0516-621 for 2 min at approximately hourly intervals. Visibility phases for the secondary calibrators were relatively stable on all baselines with maximum drift rates on 6-km baselines of about per hour.
All data processing was done using the miriad111See http://www.atnf.csiro.au/computing/software/miriad synthesis data analysis system. Positions were referred to the Ma et al. (1998) J2000 position for 0516621: , (where the uncertainty in the last quoted digit is given in parentheses) derived from very long baseline interferometry (VLBI) observations. The derived J2000 position for 05417332 was , . Flux densities were based on observations of Mars which was assumed to have a disk temperature of 190 K, giving a flux density of 16.0 Jy at 17.34 GHz and 20.5 Jy at 19.65 GHz on the date of the observations. Mars was resolved at all except very short baselines. The flux density scale was transferred to the primary calibrator 0826373 using the miriad task plboot giving flux densities for this source of 1.75 Jy and 1.60 Jy at 17.34 and 19.65 GHz respectively.
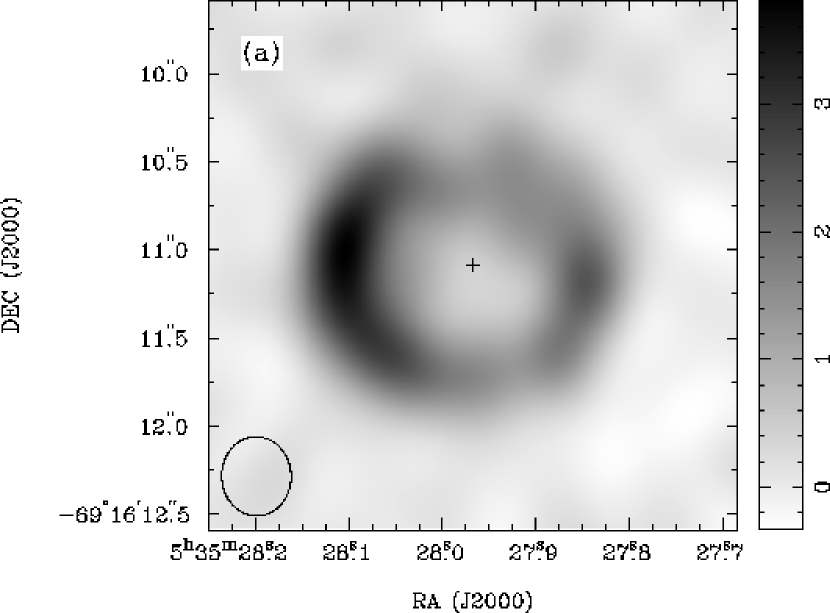
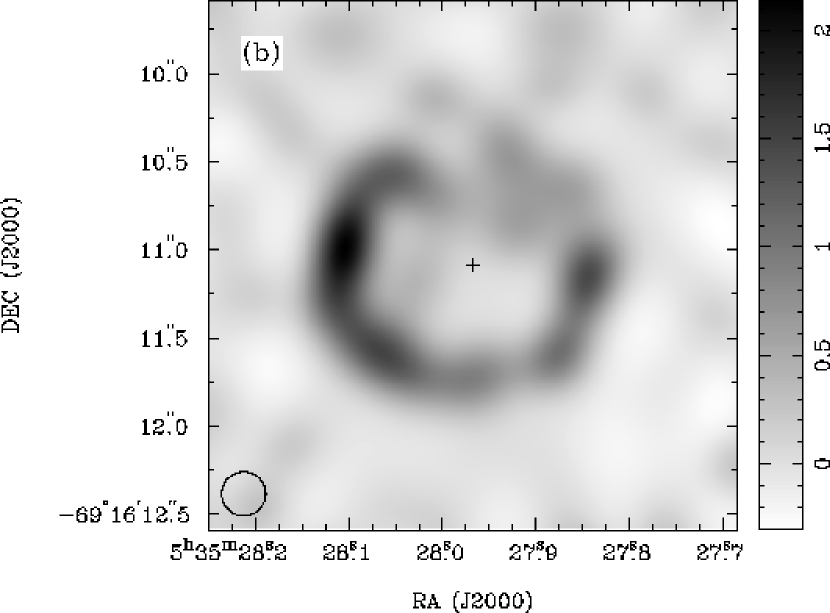
Figure 1a shows the 12-mm image obtained by inverting the calibrated data for both observed frequencies with uniform weighting. The resulting image was cleaned and restored with the diffraction-limited beam of half-maximum size with the major axis at position angle 2°(measured from north through east). Positions are absolute and the cross marks the position for SN 1987A determined by Reynolds et al. (1995) by relating the VLBI and Hipparchos reference frames; this position has an uncertainty of about 007. A super-resolved version of this image, obtained using the maxen routine and restored with a 025 circular beam is shown in Figure 1b. Because of the relatively low signal-to-noise ratio of the 12-mm data, the dynamic range of this super-resolved image is only about 8:1.
These observations give an integrated flux density for SNR 1987A of 28.5 mJy and 24.5 mJy at 17.3 GHz and 19.6 GHz respectively, with an estimated uncertainty of 1.5 mJy in each case. A 12-hour ATCA observation at 8.6 GHz on 2003 August 1 gave an integrated flux density for the SNR of mJy. Taken at face value, these results imply a mean spectral index at day 6003 of with an uncertainty of about 0.1.
3. Discussion
Figure 1a shows that the SNR ring structure is clearly resolved with the diffraction-limited 12-mm imaging. Previously, with the 3-cm imaging (Gaensler et al., 1997; Manchester et al., 2002), super-resolution techniques were required to reveal this structure. While the consistency of successive super-resolved images of SNR 1987A gave us confidence that they were reliable, a direct confirmation of that is valuable. This is provided by Figure 2 which shows an overlay of the 12-mm diffraction-limited image on the 3-cm super-resolved image based on the ATCA observations of 2003 August 1. Although there is an excellent overall correlation between the two images, there are slight differences. On both the eastern and western sides, the peak 3-cm intensities are displaced slightly southward of the 12-mm peaks. Whether or not this indicates different spectral indices in different parts of the ring remains to be confirmed by future observations.
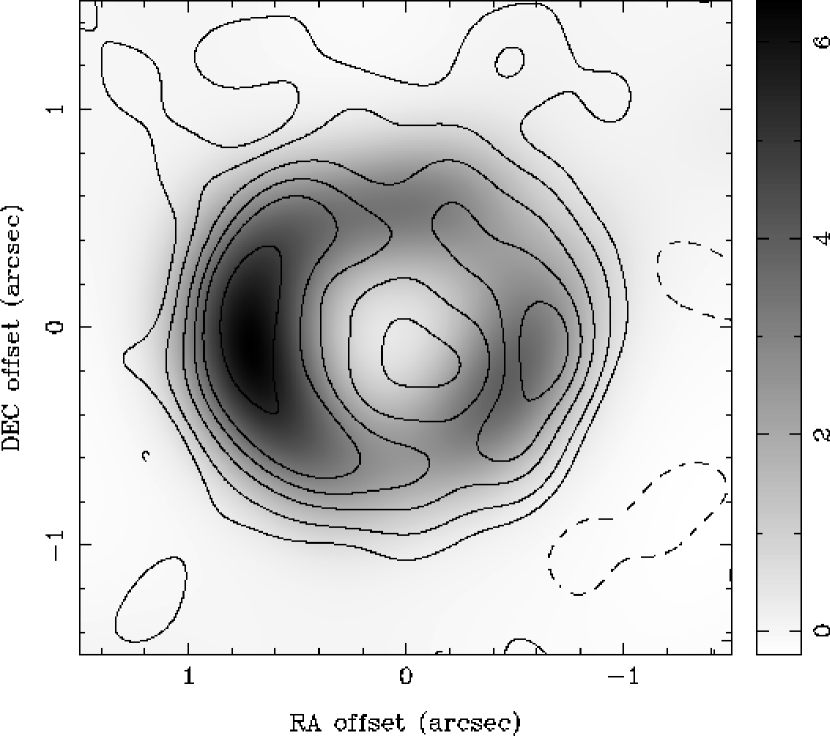
Figure 3 shows slices through the diffraction-limited 12-mm image (Figure 1a) at six position angles. These clearly show the pronounced east-west asymmetry with the eastern lobe stronger and centered at a slightly greater radial distance compared to the western lobe. It is also clear that the north-south diameter of the radio emission is less than the east-west diameter; based on the separation of the slice maxima, the ratio of diameters is about 0.75. Within the uncertainties, this ellipticity is consistent with the inclination of derived for the optical equatorial ring (Crotts et al., 1995).

Emission at the centre of the ring is significant and about 20% of the average ring intensity. Images were generated within miriad of two disks and two optically thin spheres of diameter and respectively and differenced to form a ring and shell of thickness in each case. These were then convolved with the diffraction-limited beam. Slices through these model images are shown in the upper part of Figure 3. Clearly, even a thin shell of emission has a larger surface brightness at its center than the observed SNR, whereas the thin ring or annulus has a lower (zero) surface brightness at its center. This suggests that something between a shell and an equatorial ring is the best model. The reverse shock described by Michael et al. (2003) has just this morphology. The top two curves in Figure 3 are slices at position angles and through an optically-thin equatorial ring of latitude extent and inner and outer radii of and respectively, inclined at to the line of sight. Apart from the unmodelled east-west asymmetry, these model slices agree remarkably well with the corresponding cuts through the 12-mm image (lower part of Figure 3).
In previous analyses, the size and expansion rate of the radio shell has been measured by fitting an optically thin shell to the 3-cm data (Gaensler et al., 1997; Manchester et al., 2002). The diameter obtained from such a fit to the 12-mm data is , shown by the vertical dotted lines in Figure 3. The model slice for a thin shell shows that the emission maxima lie significantly inside the nominal shell radius, consistent with the observed profiles. A similar fit to the 3-cm data of 2003 August 1 gives a shell diameter of , fully consistent with the fit to the 12-mm data.
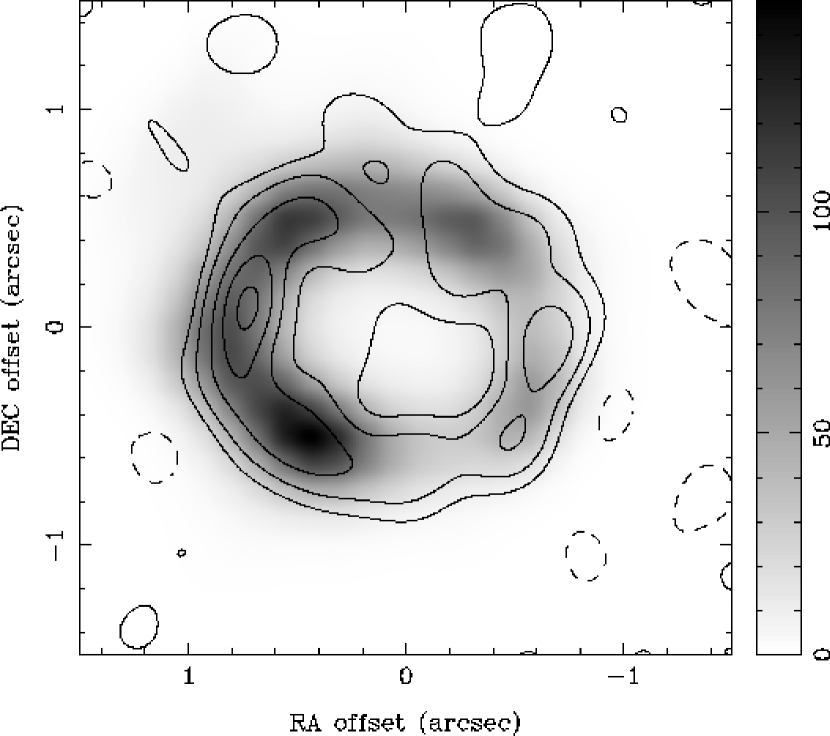
Recent X-ray observations (Park et al., 2004, 2005) show new hot spots emerging on the western side of the ring at both high and low energies, with the X-ray emission now forming a more complete ring. Figure 4 shows an overlay of the super-resolved 12-mm image aligned by eye with a contemporaneous broad-band X-ray image (Park et al., 2005). While the overall annular distribution of emission is very similar in the two images, in detail they differ substantially. The radio emission peaks on the eastern and western sides of the ring whereas the X-ray emission tends to peak in the “corners” of the ring with saddle points at the radio peaks. Hubble Space Telescope images of SNR 1987A taken at a similar epoch in H light (reproduced in the review by McCray, 2005) show a large number of hot spots distributed around the inner edge of the equatorial ring. Again, there is no detailed correspondence with either the radio or X-ray emission distribution.
It is clear that the physical conditions under which the radio emission, optical (H) hot spots and the X-ray emission are generated are different, although all result from the interaction of the expanding supernova ejecta with circumstellar material. The H hot spots are clearly associated with the inner edge of the equatorial ring and have little or no azimuthal asymmetry. The radio emission is concentrated on the eastern and western sides and has a pronounced east-west asymmetry, with a much brighter eastern lobe. Initially the X-ray emission shared some of these features but, with the recent rapid brightening, it more resembles the optical distribution. The time evolution of the intensity of the optical and X-ray emission is also similar, being very non-linear with a rapidly increasing gradient, whereas the radio emission has increased almost linearly over the past decade with just a very small increase in gradient (Manchester et al., 2002).
As discussed by previous authors (e.g., Sugerman et al., 2002; Park et al., 2004; McCray, 2005, and references therein), these results suggest that the optical emission and at least the rapidly increasing X-ray emission are generated by the interaction of the supernova blast wave with dense regions of the equatorial ring which extend inward. The fact that the emission is now increasing rapidly and becoming more uniform around the ring suggests that the blast wave is now encountering the main ring structure. Furthermore, the similar spatial distribution and similarly short evolution timescales shows that the optical and X-ray emitting regions coexist behind the advancing shock front and are generated contemporaneously.
In contrast, the radio emission began to increase at an earlier time and has increased more-or-less steadily since. This suggests that the relativistic electrons responsible for the synchrotron emission are more widely distributed behind the shock front, perhaps filling the region between the forward and reverse shocks. It is possible that the reverse shock is the main site for acceleration of the synchrotron-emitting electrons. This idea is supported by the east-west asymmetry common to the radio emission and the reverse shock and by excellent agreement of the model slices in Figure 3 based on this morphology with the corresponding slices through the observed image. The lifetime of the sychrotron electrons is very long. Hence, unless adiabatic expansion or other loss processes are important, the rate of generation of synchrotron-emitting electrons has been relatively stable since day 1200 when the radio emission was first detected. At least at recent times, the area of the shock surface (whether it is the forward or the reverse shock) has been growing roughly as , suggesting that the rate of particle acceleration per unit area of the shock front has been declining at roughly this rate.
The measured flux densities of the SNR at 17 and 19 GHz are above the values extrapolated from lower frequencies. The SNR spectrum measured between 0.8 and 10 GHz is becoming flatter, with a gradient of roughly per day (Manchester et al., 2002). The observed slope at day 6000 is about (Staveley-Smith et al., 2005). This is marginally consistent with the value derived from the measured 12-mm and 3-cm flux densities at this time, , suggesting that the rate of spectral flattening may be increasing or that the radio spectrum may not be power-law over the whole range from 0.8 to 19 GHz. We note that diffusive shock acceleration theories predict a concave synchrotron spectrum and there is some evidence for this in other SNRs (e.g., Reynolds & Ellison, 1992; Jones et al., 2003).
The increasing radio flux density of SNR 1987A will soon give super-resolved images with higher resolution and improved dynamic range, allowing a more detailed comparison with the optical and X-ray images. This should elucidate the relationship between the emission processes in the various bands, showing whether or not the acceleration of the radio sychrotron electrons occurs at the reverse shock as suggested above. The increasing flux density will also allow a more precise measurement of the frequency and spatial dependence of the radio spectral index.
Acknowledgments
We thank Dr Sangwook Park for supplying the Chandra 0.3 – 8 keV X-ray image of SN 1987A. The Australia Telescope Compact Array is part of the Australia Telescope which is funded by the Commonwealth of Australia for operation as a National Facility managed by CSIRO. We especially thank the ATNF engineers and other staff responsible for the design, construction and commissioning of the ATCA 12-mm system.
References
- Ball et al. (2001) Ball, L., Crawford, D. F., Hunstead, R. W., Klamer, I., & McIntyre, V. J. 2001, ApJ, 549, 599
- Beuermann et al. (1994) Beuermann, K., Brandt, S., & Pietsch, W. 1994, A&A, 281, L45
- Burrows et al. (1995) Burrows, C. J. et al. 1995, ApJ, 452, 680
- Crotts et al. (1995) Crotts, A. P. S., Kunkel, W. E., & Heathcote, S. R. 1995, ApJ, 438, 724
- Gaensler et al. (1997) Gaensler, B. M., Manchester, R. N., Staveley-Smith, L., Tzioumis, A. K., Reynolds, J. E., & Kesteven, M. J. 1997, ApJ, 479, 845
- Gorenstein et al. (1994) Gorenstein, P., Hughes, J. P., & Tucker, W. H. 1994, ApJ, 420, L25
- Jones et al. (2003) Jones, T. J., Rudnick, L., DeLaney, T., & Bowden, J. 2003, ApJ, 587, 227
- Ma et al. (1998) Ma, C., Arias, E. F., Eubanks, T. M., Fey, A. L., Gontier, A.-M., Jacobs, C. S., Sovers, O. J., Archinal, B. A., & Charlot, P. 1998, AJ, 116, 516
- Manchester & Gaensler (2001) Manchester, R. N. & Gaensler, B. M. 2001, IAU Circular, 7757
- Manchester et al. (2002) Manchester, R. N., Gaensler, B. M., Wheaton, V. C., Staveley-Smith, L., Tzioumis, A. K., Bizunok, N. S., Kesteven, M. J., & Reynolds, J. E. 2002, PASA, 19, 207
- Marcaide & Weiler (2005) Marcaide, J. M. & Weiler, K. W., eds. 2005, Cosmic Explosions (Berlin: Springer)
- McCray (2005) McCray, R. 2005, in Cosmic Explosions, ed. J. M. Marcaide & K. W. Weiler (Berlin: Springer), 77–86
- Michael et al. (2003) Michael, E. et al. 2003, ApJ, 593, 809
- Park et al. (2002) Park, S., Burrows, D. N., Garmire, G. P., Nousek, J. A., McCray, R., Michael, E., & Zhekov, S. 2002, ApJ, 567, 314
- Park et al. (2004) Park, S., Zhekov, S. A., Burrows, D. N., Garmire, G. P., & McCray, R. 2004, ApJ, 610, 275
- Park et al. (2005) —. 2005, Adv. Space Res., in press, astro-ph/0501561
- Reynolds et al. (1995) Reynolds, J. E. et al. 1995, A&A, 304, 116
- Reynolds & Ellison (1992) Reynolds, S. P. & Ellison, D. C. 1992, ApJ, 399, L75
- Staveley-Smith et al. (1993) Staveley-Smith, L., Briggs, D. S., Rowe, A. C. H., Manchester, R. N., Reynolds, J. E., Tzioumis, A. K., & Kesteven, M. J. 1993, Nature, 366, 136
- Staveley-Smith et al. (2005) Staveley-Smith, L., Manchester, R. N., Gaensler, B. M., Kesteven, M. J., Tzioumis, A. K., Bizunok, N. S., & Wheaton, V. C. 2005, in Cosmic Explosions, ed. J. M. Marcaide & K. W. Weiler (Berlin: Springer), 89–95
- Staveley-Smith et al. (1992) Staveley-Smith, L. et al. 1992, Nature, 355, 147
- Sugarman et al. (2005) Sugarman, B. E. K., Crotts, A. P. S., Kunkel, W. E., R., H. S., & Lawrence, S. S. 2005, ApJ, in press, astro-ph/0502268
- Sugerman et al. (2002) Sugerman, B. E. K., Lawrence, S. S., Crotts, A. P. S., Bouchet, P., & Heathcote, S. R. 2002, ApJ, 572, 209
- Turtle et al. (1987) Turtle, A. J. et al. 1987, Nature, 327, 38