STEREO ARRAY of 30 m Imaging Atmospheric Čerenkov Telescopes: A Next-Generation Detector for Ground-Based High Energy Gamma-ray Astronomy
Abstract
The construction of the H.E.S.S. (High Energy Stereoscopic System), a superior system of four 12 m imaging atmospheric Čerenkov telescopes, has been completed recently in the Namib desert close to Windhoek, at 1800 m above sea level. This new generation of ground-based gamma-ray detectors has an energy threshold of about 100 GeV in observations at zenith and a sensitivity of about 1% Crab flux for a point-like -ray source. Such high sensitivity was achieved due to angular resolution, as well as, severe cosmic ray background rejection acquired from multi-fold imaging of individual atmospheric showers. In addition H.E.S.S. has a rather good energy resolution of 15%. H.E.S.S. has been taking routine observations of the -ray sources since December 2003.
Similar stereoscopic arrays are currently under construction at Kitt Peak, Arizona, and at Woomera, Australia. Two telescopes of somewhat larger size of 17 m diameter are being built by the MAGIC collaboration on the Canary Island of La Palma. The first of these two telescopes has been taking data since the Fall of 2003.
The outstanding physics results achieved with H.E.S.S. already in a first year of its exploitation strongly encourage further development of imaging atmospheric Čerenkov technique for high-quality -ray observations, which is basically driven by father reduction of the energy threshold of a forthcoming major future -ray detector. Here we are dealing with such a detector, which may allow us to achieve an energy threshold as low as 10 GeV given a unique sensitivity of about .
Basic results on performance and sensitivity for a single stand-alone 30 m imaging atmospheric Čerenkov telescope, as well as for a system of two and five Čerenkov telescopes, derived from appropriate Monte Carlo simulations, are discussed here.
1 Introduction
Development of further instrumentation in the field of very high energy (VHE) -ray astronomy is primarily motivated by the physics goals as perceived by the astrophysics community today (Weekes 2004). Among those one has to mention (i) observations of the supernova remnants (SNR), which are the conjectural sources of VHE rays; (ii) continuous studies of the physics of the relativistic jets in active galactic nuclei (AGN); (iii) further investigations of morphology and spectra of rays from pulsar wind nebulae (PWN); (iv) the widening of the search for sources of pulsed -ray emission in VHE -ray band, etc. Such variety of physics enquiry can not be contented with only a single-type ground-based -ray instrument. Foremost the physics diversity of -ray emission mechanisms requires the essential observations appropriated in slightly different energy ranges. Thus for instance further observations of AGN and Pulsars necessitate the reduction of an instrumental energy threshold down to, at least, 10 GeV, whereas for detection of SNR assemblage a noticeable upgrade of sensitivity above 100 GeV is favored. Ultimately, the design of a major ground-based Čerenkov facility for future dedicated -ray observations has to conform to many requirements defined by peculiar energy spectral shapes, various angular extents, and strongly variable photon rates for the sources of an entirely different nature.
2 Basic Parameters of the Telescope Design
The sensitivity of imaging atmospheric Čerenkov telescope (IACT) at an ascertained energy is mostly determined by the total amount of Čerenkov light photons, which the telescope is able to collect from the -ray showers of that specific primary energy. In general, the larger the number of photons in the Čerenkov light flash recorded from an individual atmospheric -ray shower, the higher the quality of the shower image.
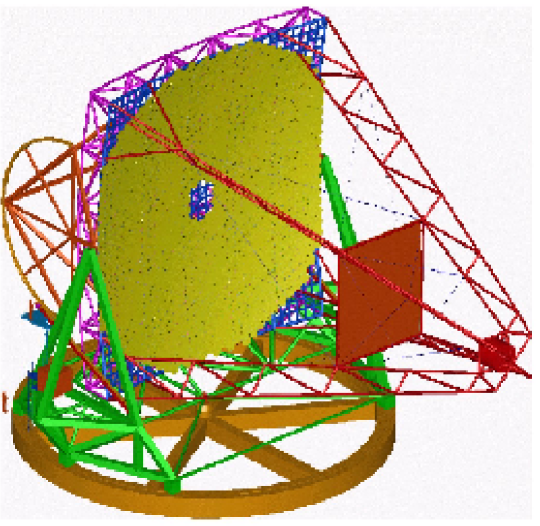
Three basic parameters account finally for a total number of Čerenkov light photons registered from the atmospheric shower by a telescope. First of all is the geometrical size of the reflector, . It is apparent that the total number of recorded photons in a Čerenkov light flash scales linearly with respect to the geometrical area of the telescope’s reflector. A 10 m Whipple Čerenkov telescope has been operating without major complications for more than 30 years, which has indeed proven the robustness of a telescope of such size. The H.E.S.S. instrument comprises four 12 m telescopes. The challenge of achieving a pointing accuracy of about 20” and a point spread function of less than have been achieved with H.E.S.S. (Bernloehr et al. 2002). MAGIC group recently started to perform -ray observations with a 17 m telescope built on La Palma, Canary Island. The development and construction of this telescope has allowed for a positive conclusion to the question of the technical feasibility of construction of a 30-35 m diameter Čerenkov telescope (Lorenz, Mirzoyan 2000). The optical performance of a telescope of such size has been also discussed by Hofmann (2001) and Akhperjanian, Sahakian (2003). Given all of those considerations one can indeed envisage that construction of a 30 m parabolic Čerenkov telescope is indeed practical (see Figure 1), considering both technical and financial aspects. Note that telescope reflectors of a diameter far beyond 30 m seem to be extremely costly. Moreover such a reflector will hardly meet the specifications for the off-axis point spread function, which is needed for a high-quality imaging of low energy -ray air showers.
The Čerenkov light photons of an atmospheric shower which hit, along their transmission path, the telescope’s mirrored surface, can be captured by an advanced imaging camera placed in the focal plane of the reflector. Using modern PMs (photomultipliers) and fast electronics it now possible to convert registered photons into photoelectrons (ph.-e.), and finally digitize the output signal in a number of ADC (analog-to-digital converter) or FADC (flash analog-to-digital converter) counts. The overall efficiency of the photon-to-photoelectron conversion is another basic parameter of the telescope design. This efficiency, , can be calculated as
| (1) |
where is the mirror reflectivity function, inferred from a set of measurements performed at different wavelengths; is the efficiency of light transmission of Winston cones, which are placed in front of the camera; is a quantum efficiency function of the PMs. The efficiency function, , accounts for all remaining effects attenuating light, as for example, the shading the camera by the telescope masts etc. Usually it totals well below 10%. The wavelengthes, and , are the boundaries of the wavelength range of detected Čerenkov photons, which lay within an optical band essentially between 0.3 and 0.6 . For conventional telescopes the wavelength-averaged mirror reflectivity and the transmission of the Winston cones are about and , respectively. Note that these efficiencies are close to the limit of the instrumental capacities and therefore they may not be substantially improved in the future. At the same time the quantum efficiency of the conventional PMs, which is of about at maximum value, could be drastically improved for the modern advanced photo-detectors, e.g. PMs of APD S5345 type provide the quantum efficiency as high as (see MAGIC Proposal, 1998).
| Experiment: | Reflector size: | QE: | Altitude of site: | |
|---|---|---|---|---|
| Whipple | 10 m | 8 | 2.3 km | |
| HEGRA | 53.5 m | 1 | 2.2 km | |
| H.E.S.S. I | 412 m | 11 | 1.8 km | |
| H.E.S.S. II | 28 m | 61 | 1.8 km | |
| CANGAROO III | 410 m | 8 | 160 m | |
| VERITAS | 412 m | 11 | 1.8 km | |
| MAGIC I | 17 m | 23 | 2.2 km | |
| MAGIC II | 17 m | 73 | 2.2 km | |
| ECO 1000 | 36 m | 325 | 2.2 km | |
| 55 | 520 m | 31 | 5 km | |
| STEREO ARRAY | 530 m | 70 | 1.8 km |
A substantial fraction of Čerenkov light photons emitted in atmospheric showers attenuates due to absorption and scattering of light onto the atoms, which Earth’s atmosphere is made up of. The corresponding reduction of the photon flux is given as , where is a photon attenuation cross-section at the wavelength of , and for the effective distance of the photon emission point to the telescope, . This effective distance is determined by the development height of an atmospheric shower, which depends on the primary energy of a shower, as well as by the altitude of the observational site, . By setting the detector closer to the shower, which means up on the high altitudes, one can reduce the effective propagation length of the photons, , in the atmosphere and correspondingly increase in the number of Čerenkov light photons arriving onto the telescope reflector. As Aharonian et al (2001) pointed out, the density of Čerenkov light photons at high altitude, km above sea level, can increase, approximately, by a factor of 2 as compared with the corresponding density at conventional altitudes of 2 km above sea level. In fact, Čerenkov light photons are heavily absorbed whilst propagating within a few kilometers of the very dense atmospheric layer right above the observational level, which contains noticeable aerosol contamination. There are a number of high altitude sites in the world which are accessible for construction of the Čerenkov telescopes. However, the topology of the Čerenkov light images recorded at the high altitude site is such, that it makes implausible to achieve much of a gain in sensitivity from such an array located at high altitude (Konopelko 2004). Thus we have considered here a conventional observation level of km, which is close to the optimum one and eventually corresponds to the current H.E.S.S. site. Note that the H.E.S.S. collaboration has been funded to construct a 28 m telescope to be added to the current H.E.S.S. array, which will be place right in the center of the four telescope system. This telescope might be considered as a prototype for an array of five 30 m telescopes considered here.
For the conventional PMs the overall photon-to-photoelectron conversion efficiency is about , whereas using enhanced quantum efficiency photo-detectors one can achieve the conversion efficiency of . However, such photo-detectors are still under development and are currently not commonly available on the market. Therefore, we considered here a telescope camera built using conventional PMs and electronics.
Finally the basic parameters of the telescope’s design determine the effective area of the telescope reflector , which is calculated with respect to a number of photoelectrons recorded by the camera. For the parameters chosen for a detector depicted here as STEREO ARRAY the corresponding effective collection area is about (see Table 1). Ultimately, in the foreseeable future the large dish telescopes can be upgraded with cameras made of advanced photo-detectors, which will push the energy threshold as well as the sensitivity of this instrumentation to the absolute physical limit of the imaging atmospheric Čerenkov technique.
3 Energy Threshold
The camera pixels of imaging atmospheric Čerenkov telescopes are able to function under a hard load of night sky background light, yielding a photoelectron rate of about 200 MHz per pixel. The camera trigger, which embraces the PM signals within a certain (trigger) zone of the camera, is designed so that it eliminates accidental triggers due to Poisson-like fluctuations of night sky background light over a large number of camera pixels.
The optimum and robust trigger criterion allows for a reduction the rate of the accidental triggers down to a level which is at least one order of magnitude below the measured cosmic-ray rate. For a 30 m telescope such criterion requires, for instance, a simultaneous registration of about 3 pixels with a signal exceeding a 6 photoelectron level, which is finally determined by the telescope and camera design. In this case the minimal size (total number of photoelectrons in image) of the triggered events is around 20 photoelectrons. Events of such low size consist of only a few pixels and do not offer any reliable measurement of image shape and are in fact almost useless for stereoscopic shower reconstruction. Despite a few past trials, so far there is no well established analysis method that been developed specifically to extract such low size -ray events. In reality one has to apply a size cut at the level of 40 photoelectrons, which removes all images of low quality from the data sample on the costs of higher energy threshold. After applying selection by size the remaining events allow measurement of the orientation and the angular extensions along the major and minor axis of an ellipsoid-like image with sufficiently high accuracy.

The minimal size of the recorded images is the final constraint on the actual energy threshold of the telescope. The density of the Čerenkov light photons emitted in the -ray-induced atmospheric shower, which was recalculated to a number of photoelectrons assuming specific telescope design, as a function of the distance of telescope to the shower axis in observational plane is shown in Figure 2. For a given reflector size and efficiency of photon-to-photoelectron conversion one can estimate corresponding minimal density at the telescope’s altitude, which corresponds to the minimal size cut. The lateral distribution of the photon density can be well described by a fit like
| (2) |
where the fit parameters for a 100 GeV -ray shower are 14.0, 264.0, 3.41, respectively. One can see in Figure 2 that a broad plateau expanding up to the radius of R120 m finally develops into an exponential fall-off111This fit has a limited accuracy around R120 m. It does not reproduce a very narrow bump, which occurs exactly at this radius due to high energy shower particles, but it is sufficiently good for the energy threshold estimate discussed here.. This lateral profile of Čerenkov light density resulted from a specific location of shower maximum in the atmosphere and a very narrow angle of Čerenkov light emission, of about 1∘.
In a zero approximation a total amount of Čerenkov light photon emitted in a -ray shower is roughly proportional to the shower primary energy. Therefore, one can scale the density of Čerenkov light photons or size with respect to shower energy, ,
| (3) |
For instance for the density of Čerenkov light photons about the corresponding image size is of ph.-e. One can see in Figure 2 that a 10 GeV -ray shower can be effectively detected by a 30 m telescope. At the same time a 1 TeV -ray shower at the impact distance of less than 250 m yields more than ph.-e., which is sufficient to produce a very high quality image. Note that the showers of a 10 TeV energy can be in principle detected at a 1 km impact distance, which results in a very large detection area being available for the stereo trigger, given a satisfactory large field of view of the imaging camera.
Despite that various definitions of the energy threshold of an imaging atmospheric Čerenkov telescope have been discussed in the literature, at present it is widely accepted as a standard one the definition of the threshold as the energy, which corresponds to the position of the maximum in the differential detection rate of the -rays with the Crab-like energy spectrum in observations at zenith. The energy threshold of 500 GeV for the HEGRA system of five imaging atmopsheric Čerenkov telescopes estimated from the Monte Carlo simulations was fully confirmed by the direct measurements supported by a number of independent calibration tools (Konopelko et al. 1999). The same is true for the H.E.S.S. array of four telescopes in Namibia, which is right now in a state of routine data taking. The energy threshold of a 100 GeV predicted on the basis of Monte Carlo simulations (Aharonian et al. 1997) was verified recently using detailed systematic studies of the -ray fluxes from the Crab Nebula and other sources (Hinton, 2004). All that strengthen a confidence of the calculation of the energy threshold for a STEREO ARRAY given in this paper.
4 Focal Plane Detector
Modern atmospheric Čerenkov telescopes focus the light from the atmospheric shower onto a fine-granularity imaging camera. An angular size of the pixel (PM) and the total field of view are the basic parameters of camera configuration. Optimum design of a camera must provide adequate registration of Čerenkov light images of -ray showers within a priori defined dynamic energy range. For the 30 m diameter telescopes the low energy bound is about 10 GeV. The shower maximum of such low energy -ray showers is high above the observational level - km. Therefore, the images of these showers have on average a very small angular size and in addition they are located very close to the center of the camera’s field of view. For an accurate measurement of angular size of these images one needs to reduce the angular pixel size down to about 0.07∘ in order to increase a number of tubes involved in image parametrization. At the same time small pixel size suppresses the contamination of the night sky background light accumulated within a signal readout time window (for detailed discussion see Konopelko, 2004). Note that further reduction of the pixel size is inexpedient, because such an extremely small pixel size will be beyond the reasonable limit given by optical performance of a 30 m parabolic dish (Hofmann 2001).
In a toy model one can assume that most of Čerenkov light photons are coming directly from the shower maximum, , which places at the atmospheric depth - - which corresponds to the atmospheric depth of a maximum number of secondary electrons in a shower. If the telescope is tracking the source at the center of its field of view, then the position of the maximal image intensity (centroid) in the camera focal plane is determined then exclusively by the height of the shower maximum above the observation level and the geometrical distance of the shower axis to the telescope. In approximation A of the classical cascade theory, the shower maximum has taken place at the depth
| (4) |
where is a primary energy of a -ray shower; is the so-called critical energy ( MeV), and is a radiation length in atmosphere (). For a realistic atmospheric model the relation between the height, [m], and the atmospheric depth, , can be given as
| (5) |
Finally the angular shift of the centroid can be calculated as
| (6) |
where is a height of the observational level above sea level (hereafter km). For instance the shift of image centroid of a 10 GeV -ray shower at 200 m from the shower axis is about 1.25∘. Note that such toy model is accurate enough in most cases but it introduces a systematic error due to difference between the actual shower maximum position and the shower maximum as seen in the Čerenkov light, which is partially absorbed whilst propagating into the atmosphere.
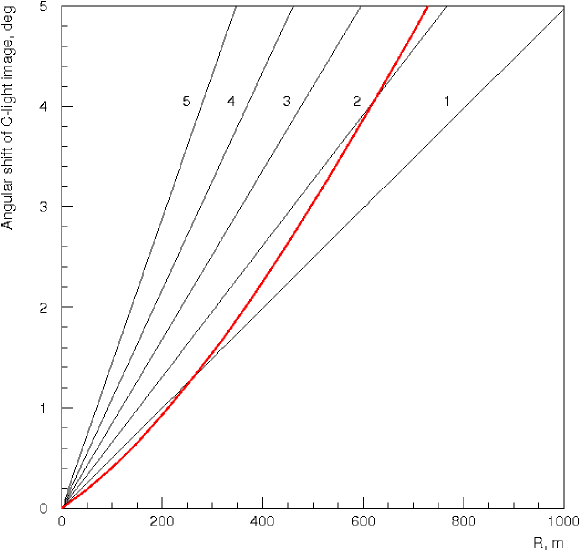
For a fixed primary energy Eqn. (3) can be inverted and the maximum radius, providing sufficient number of Čerenkov light photons for shower registration, can be calculated. Using Eqn. (6) one can estimate the corresponding angular shift of the image centroid in the camera focal plane. For example for a 1 TeV -ray shower the image displacement is about 1∘ at a 100 m impact distance222Note that this case deals with a telescope pointing directly towards the source. However, the discussion given here also generally applies to other telescope pointings.. Bold curve in Figure 3 indicates the allowed range of the angular shifts for -ray showers of different primary energies. One can see in Figure 3 that for a 10 GeV energy -ray the image has a relatively small displacement from the center of field of view, which is below . The -ray showers of higher energies can trigger the detector at much large impacts if the angular size of the camera is sufficiently wide to accommodate these events.
The point spread function of a 30 m parabolic reflector degrades relatively fast at off the telescope optical axis. For example for a 17 m MAGIC telescope approximately 50% of all reflected light is concentrated within a circle of for off-axis observations (see MAGIC proposal). For a 30 m telescope assuming a realistic focal length (F/D=1.25) the point spread function will finally limit the angular range of efficient imaging by approximately off the optical axis. For larger declinations of incoming photons the point spread function becomes substantially wider than the actual angular size of the image.
The high energy -ray showers propagate deep into the atmosphere. Therefore their shower maximum occurs at relatively small heights above the observational level. If the telescope is pointing directly towards the source then the images of triggered high energy events will be concentrated in the camera focal plane at rather large angular distances from its center. An imaging camera with a limited angular size (field of view) of diameter will be able to detect only Čerenkov light photons coming from the upper layers of the atmosphere, i.e. from the forefront of the shower development. This reduction of detection efficiency for very high energy -rays ( TeV), due to a camera’s limited field of view, becomes even more severe for the telescopes deployed at high altitudes. In this case the shower maximum can be only observed at very large angles with respect to the telescope optical axis.
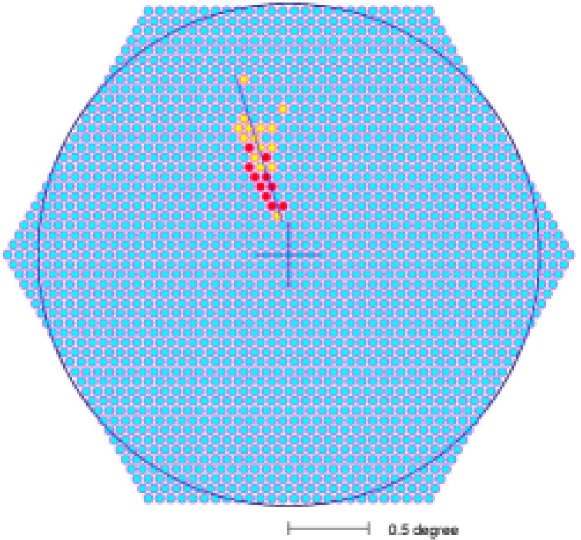
There is always a trade-off between the angular size of the pixel and the total number of pixels in the camera, which are needed to cover a certain field of view. Cameras of a very small pixel size account for an enormous number of pixels/channels, which is, firstly, very expensive and secondly, very difficult in a long run exploitation. The pixel size of for the field of view of 3∘ diameter is in fact a reasonable choice. It results in 1951 pixels, which is only by factor of two larger than that for the currently operating H.E.S.S. I cameras. An artist’s view of a possible camera design is shown in Figure 4.
We decided to use the conventional ADCs for the signal digitization. At present the question of the advantageous performance of the FADCs for data acquisition and even for -ray imaging is still under general discussion and needs further verification.
5 System Layout
The HEGRA (High Energy Gamma Ray Astronomy) experiment has proven for the first time numerous advantages of the stereoscopic observations of rays above 500 GeV from the ground. H.E.S.S. (High Energy Stereoscopic System) was a natural extension of the HEGRA approach into lower energy range starting from 100 GeV. Utilizing a stereoscopic approach H.E.S.S. achieved the sensitivity at the level of % of the Crab Nebula (standard candle) flux, which is so far unique in the field of very high energy -ray astronomy. Further reduction in energy thresholds down to 10 GeV also envisages making use of the stereoscopic approach. Large fluctuations in low energy showers noticeably degrade the quality of recorded Čerenkov light images. However, this can be substantially remedied using stereoscopic observations. To perform stereoscopic observations at low energies one needs apparently to have at least two 30 m imaging Čerenkov telescopes operating synchronically. Such a system of two telescopes might be considered as a basic stereoscopic system for observations of low energy rays. Here we present the results of simulations for a 30 m single stand-alone telescope, as well as for a pair of such telescopes, and finally for a Stereo Array of five 30 m telescopes, which might be considered as a prototype for a future major facility in the field of very high energy -ray astronomy. The layout of the five telescopes is similar to that of the HEGRA layout but with a spacial separation between the telescopes of 100 m. A 100 m separation corresponds to a geometrical size of a Čerenkov light pool on the ground, which is in fact of about 100 m in radius. Despite the fact that a search for an optimum separation between two 30 m telescopes is an interesting issue, which needs perhaps special dedicated investigations, and might slightly influence the final sensitivity value, it is out of the frame of present paper, but it will be discussed in a separate forthcoming paper.
| Altitude: | 1.8 km above sea level |
|---|---|
| Atmosphere: | Tropical |
| Reflector size: | 30 m |
| Reflector design: | parabolic (F/D=1.25) |
| Focal length: | 37.5 m |
| Number of telescope: | 5 |
| Distance between telescopes: | 100 m |
| Number of camera pixels: | 1951 |
| Pixel size: | 0.07∘ |
| Photon-to-photoelectron efficiency: | 0.1 |
| Trigger: | Signal in each of 3 PMs exceeds 6 ph.-e. |
| Tail cut: | 3/5 ph.-e. |
6 Simulations
Atmospheric showers induced by -rays, electrons, and protons have been simulated using a numerical code described by Konopelko, Plyasheshnikov (2000). The primary energy of simulated showers was sampled as uniformly distributed within each of 24 bins, which were chosen within the energy range starting from 1 GeV and extending up to 10 TeV. Five 30 m Čerenkov telescopes were included in the simulational setup. The maximum impact distance of the shower axis to the center of the array was 1000 m. Basic parameters of the simulational setup are summarized in Table 2. The detailed procedure simulating the camera response was applied for the generated events. This procedure accounts for all possible losses of the Cherenkov light from the air shower on the way from the mirror reflecting to the camera response. The list of the effects which are important in this respect contains: (i) mirror reflecting sampled by the light raytracing technique or using the measured functions of the light spot distortion in the camera focal plane; (ii) PMT’s funnel acceptance; (iii) photon-to-photoelectron conversion inside the PMT’s taking into account the measured single photoelectron spectrum. Further details of the simulational procedure can be found in Konopelko et al. (1999).
7 Energy Spectra of Primary Particles
In general a Čerenkov telescope counts events, which are atmospheric showers initiated by various particles of primary cosmic rays. Their major components are electrons, protons, and nuclei. The estimate for detector sensitivity is usually computed with respect to the well-established DC -ray flux from the Crab Nebula. The spectra of -rays and different background components measured in relevant energy range, which have been used in the sensitivity estimate given here, are summarized below.
7.1 Gamma-rays
The DC flux of VHE -rays from the Crab Nebula is generally accepted as a standard flux unit in -ray astronomy. The spectrum of VHE -rays from the Crab Nebula was measured with a number of ground-based Čerenkov light detectors in energy ranges, starting from 50 GeV and extending up to 50 TeV (for review see e.g. Aharonian et al. 2000). The energy spectra and absolute fluxes measured by different instruments over different energy intervals are generally compatible. Therefore it is reasonable to use well-established spectrum of VHE -rays from the Crab Nebula for an estimate of the sensitivity of future Čerenkov light instruments and finally give a sensitivity merit expressed in Crab flux units.
The Crab Nebula spectrum measured with the HEGRA system of 5 imaging atmospheric Čerenkov telescopes can be approximated by a power-law with a logarithmic steepening (Aharonian et al. 2000):
| (7) |
The best fit indicates a slight flattening of the spectrum at the low energies, as is predicted by theories which assume an Inverse Compton (IC) origin of VHE rays from the Crab Nebula (e.g. see de Jager et al. (1996); Atoyan & Aharonian (1999)).
An extension of the HEGRA Crab Nebula spectrum to low energies, achieved with HEGRA by using a specific observational technique (Lucarelli et al. (2003)), is fully consistent with the recent measurements carried out with the Solar type detectors. Note that recent measurements of the Crab Nebula spectra in the energy range above 10 TeV (Aharonian et al. 2004) with HEGRA, and the preliminary data obtained with H.E.S.S. (Masterson et al. 2004) are in agreement. In fact the best fit of the HEGRA data, given by Eqn.(7), describes rather well all various spectral and flux measurements obtained so far. This fit was used here in computing the -ray detection rates. Note that the HEGRA and EGRET spectra of the DC -ray flux from the Crab Nebula are consistent within statistical and systematic errors given for both experiments.
7.2 Electrons
For the ground-based atmospheric Čerenkov telescopes, which are approaching the energy range of 10 GeV, the electron component of primary cosmic rays becomes a dominant background and in fact is an issue of major concern. Around 10 GeV the intensity of the electron component is about 1% of the corresponding proton intensity. The Čerenkov light images generated by electron-induced atmospheric showers are almost indistinguishable in shape from the images of the -ray showers. Moreover the angular imaging resolution of Čerenkov telescopes substantially worsens at such low energies, and indeed does not allow for very strong suppression of an isotopic flux of cosmic electrons. Finally, the performance of imaging atmospheric Čerenkov telescopes in the energy range around 10 GeV relies heavily upon the residual trigger rate of electron-induced showers obtained after application of the analysis cuts.
A number of various measurements of the energy spectrum of cosmic electrons have been performed in past (see Du Vernois et al. 2001). Despite that the existing data exhibit sizeable statistical and systematic uncertainties above 10 GeV the electron spectrum is a power-law with the spectral index of about 3.0. Over a broad energy range from 1 GeV up to 100 GeV the electron spectrum333Hereafter we consider only the combined spectrum of and . can be fitted as
| (8) |
Such a steep energy spectrum makes it almost impossible to detect low fluxes of cosmic-ray electrons at high energies with currently operating IACTs, whereas absolute electron flux at energies of only a few GeV is relatively high. At low energies the flux of electrons becomes comparable with the flux of cosmic-ray protons after applying analysis cuts and it should be taken into account in total background estimate. Here we computed the electron rates using the spectral fit given by Eqn.(8).
7.3 Cosmic-Ray Protons & Nuclei
The fluxes and spectra of primary cosmic-ray protons and helium nuclei can be thoroughly measured in the energy range of 1 to 200 GeV with the balloon born experiments. These spectra have been recently upgraded using the BESS spectrometer with the accuracies of % for protons and % for helium (Sanuki et al. 2000)444In this paper a most complete compilation of modern data on differential proton and helium spectra is also given..
In the energy range of 1 to 100 GeV the 1998 BESS data on proton spectrum can be reproduced using the following fit
| (9) |
Above 30 GeV the proton spectrum is a straight power law
| (10) |
Note that the slope of a power law spectrum is consistent with the spectra given by Wiebel et al. (1994) and Simpson et al. (1983), which are and , respectively, whereas the absolute fluxes differ by 20-50%. Since at present BESS measurements offer the best quality data, the proton spectrum described by Eqns.(9,10) was used here in calculations of the cosmic-ray detection rates.
It is known that Helium nuclei in primary cosmic rays contribute up to 30% to the total raw event rate of atmospheric Čerenkov telescopes (see e.g. Konopelko et al. 1999). The contribution of all other cosmic-ray nuclei is very low and almost negligible. That was proven here by specific test simulations. In a good approximation one can scale the event rate calculated for the proton cosmic ray flux by a factor of 1.5 in order to get a total cosmic ray detection rate.
8 Performance of STEREO ARRAY
An estimate of the detector performance is inferred from the detection rates of -ray and background events, calculated after application of the analysis cuts. For a given flux of cosmic-ray particles of a specific type the energy dependent function of correspondent detector response, i.e. collection area, basically determines relevant detection rate. Collection areas for -ray- and cosmic-ray- induced showers can be derived from the detailed Monte Carlo simulations tracing both the shower development in the atmosphere and the detector performance. Below we summarize the basic results on collection areas of rays and background events of a different kind.
8.1 Collection Areas
In the simulations the position of a shower axis in the observational plane was sampled as uniformly randomized over an area limited by 1 km radius from the center of the array. By counting the number of triggered showers of a specific primary energy one can calculate a so-called trigger probability, which then can be easily converted into corresponding collection area. Events were simulated within the energy range from 1 GeV up to 10 TeV.


The energy dependence of the collection area basically reflects the profile of the Čerenkov light pool on the ground. For -ray showers it has a high density plateau expanding up to 120 m distance from the shower axis, which then develops into an exponential fall-off. One can see in Figure 5 that a steep rise of collection area at low energies (E50 GeV) converges into a rather slow logarithmic growth at high energies. For -ray showers the characteristic energy at which the energy profile of collection area breaks roughly corresponds to the energy threshold of the instrument. For proton showers the Čerenkov light pool does not have such a prominent “shoulder” at 120 m but it yields rather smoothly decreasing photon density with enlargement of the distance to the shower core.
The collection areas of -ray atmospheric showers can be consummately reproduced by a four parameter fit:
| (11) |
The parameters of the fit for different detector configurations are given in Table LABEL:parm1.
| Configuration: | i=1 | 2 | 3 | 4 | |
|---|---|---|---|---|---|
| Single Stand-Alone Telescope | 3.80 | 7.50 | 3.38 | ||
| Stereo: Two Telescopes | 4.86 | 8.49 | 4.29 | ||
| Stereo: Five Telescopes∗ | 4.45 | 7.77 | 4.13 |
The proton-induced showers are isotropically distributed over the incidence angle with respect to the telescope optical axis. Thus in this case the collection area has to be computed by averaging over a solid angle, limited by an opening angle, which exceeds by roughly the opening angle of the camera’s field of view.
Interestingly, the second parameter of the fit, (Eqn.(11)), roughly corresponds to the energy threshold of the instrument with respect to the corresponding type of atmospheric showers, which is about 8 GeV for -ray showers and 40 GeV for proton-induced showers.
The trigger efficiency for atmospheric showers of some specific energy is finally determined by a total amount of Čerenkov light emitted in the shower of such an energy (see discussion above). For low energy proton-induced showers (100 GeV) less than 30% of their primary energy can be transferred into electromagnetic component, which is finally responsible for the Čerenkov light emission. That explains why the energy thresholds for the -ray- and proton-induced atmospheric showers differ greatly.
The development of electron-induced showers in the atmosphere is almost identical to the -ray-induced showers. A slight difference in a height of shower maximum for the two cases does not noticeably effect the lateral and angular parameters of Čerenkov light pool at the observational level.
In observations of a point-like -ray source the isotropically distributed background events of cosmic-ray protons and electrons are registered within a solid angle, which is limited by actual angular resolution of the instrument. The angular resolution strongly depends on primary energy of -ray shower (see below). For STEREO ARRAY even at very low energies, i.e. around the instrument’s energy threshold of 10 GeV, the angular resolution is still rather good, . It is substantially less than the angular size of the camera, which is of diameter. Deviation of the incident angles of electron-induced showers within from the telescope optical axis does not affect the physics of a shower development in the atmosphere, namely the lateral and longitudinal profiles of secondary shower particles etc. Therefore, it is possible to use the collection areas calculated for the -ray-induced showers in calculating the collection areas of electron-induced showers. Additional test simulations of some electron-induced atmospheric showers have proven such approximation to be valid.
In Figure 5 the collection areas for a system of five telescopes for different trigger multiplicities are also shown. It is important to note that the -ray events of energy below 10 GeV trigger at most only two of the telescopes. The 3-fold coincidences are generated by rays of noticeably higher energy. Finally, the collection area of 5-fold coincidence events dominates at the energy above 30 GeV. In fact, the low energy -ray showers can trigger a telescope at quite small impact distances to the shower axis, which explains the energy dependence of the collection areas for different trigger multiplicities.

8.2 Detection rates
Differential detection rates for different types of atmospheric showers registered with STEREO ARRAY can be calculated as
| (12) |
The position of a peak in the differential detection rate of -ray atmospheric showers, which is calculated assuming the Crab Nebula energy spectrum, defines the effective energy threshold of the instrument (see Figure 6). Note that it is, in fact, in agreement with the value of the -parameter of a fit of the collection area (see Table LABEL:parm1). One can see in Figure 6 that the electron-induced showers dominate at low energies, whereas their contribution is negligible at high energies due to the very steep energy spectrum of cosmic ray electrons.
The differential detection rate of the proton-induced atmospheric showers peaks at substantially higher energy, within 30-90 GeV. The proton-induced atmospheric shower of that energy yields approximately the same amount of Čerenkov light as the -ray showers of about 10 GeV.
The integral raw background rate for a system of two 30 m telescopes is expected to be about 1 kHz. At the same time the raw detection rates for a single 30 m telescope, as well as for a system of five such telescopes, are expected to be of 1.7 and 3.2 kHz, respectively. With up-to-date electronics one can achieve a sufficiently low dead-time-of-event processing, and it is generally possible to maintain such high event rate with an advanced imaging camera. However the discussion of possible solutions to the problems of trigger electronics and data acquisition is beyond the framework of present studies.
8.3 Analysis
The raw observational data taken with the ground-based atmospheric Čerenkov telescopes are entirely background dominated. The detection rate of the background cosmic rays and electrons usually exceeds by three orders of magnitude the expected rate from a Crab like -ray source. A detailed comparative analysis of space, angular, and temporal characteristics of 10 GeV and 100 GeV -ray showers is given in Konopelko (1997). The images of the sub-100 GeV -ray showers are indeed very irregular in shape and are strongly affected by high fluctuations in air shower development. However they still carry information about shower orientation as well as its lateral, and longitudinal spread. In order to extract the tiny fraction of the -ray events from the enormous amount of background contaminations one has to apply specific analysis cuts. The set of the analysis cuts (selecting criteria) usually consists of the selections on the image orientation and shape. Two telescopes make it possible to perform full-scale stereo reconstruction of the shower direction in space and on the ground.

8.3.1 Orientation:
The deflection of the reconstructed arrival direction of the -ray showers from the nominal source position is used for their orientational selection. The better the angular resolution of the instruments, the lower the content of residual background events. The angular resolution (angular radius limiting the area around the source position accounting for 63% of all simulated showers) as a function of primary energy of the -ray-induced atmospheric shower is shown in Figure 7. At low energies the Čerenkov light images contain less light and are strongly affected by shower fluctuations. Therefore the results on reconstruction of the image orientation as well as the shower arrival direction substantially worsen. For the angular size of the camera of in radius the cosmic ray rejection is about . One can see in Figure 7 that the angular resolution achieved with three images is 30% better than in the case of only two images. It allows the reduction of the cosmic ray background contamination by a factor of 1.7. However, as already mentioned above, 3-fold triggers substantially decrease the rate of rays of energy close to the threshold. That is why to search for -rays at the energy of 10 GeV and below the 2-fold coincidence mode seems to be more advantageous.
8.3.2 Image shape:
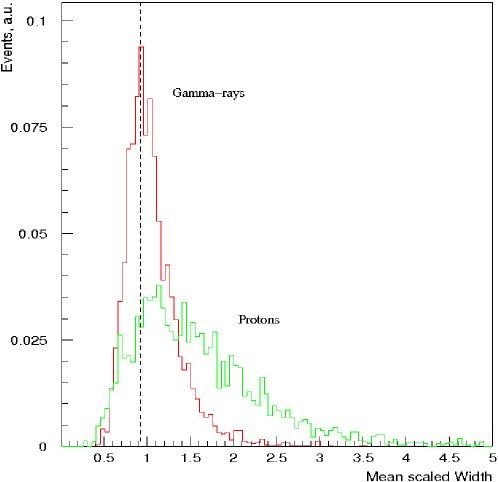
Exploitation of the HEGRA system of 5 imaging atmospheric Čerenkov telescopes with H.E.S.S. allowed us to conclude that the most effective parameter of cosmic ray discrimination by the image shape is a parameter of mean scaled Width (m.s.w.). At least with two telescopes operating in a stereoscopic mode one can reconstruct the impact distance of the shower axis from each of the telescopes, and scale the actual transverse angular size of the image with the total amount of light in the image (-parameter) at that impact distance. The distributions of the parameter of mean scaled Width for the simulated -ray and proton showers are shown in Figure 8. Despite a significant overlap between two distributions one can reduce the content of the proton showers by factor of (i.e. the ”after cuts” acceptance of cosmic ray showers is ) applying mean scaled Width cut of 0.91. This cut keeps 35% of all registered -ray showers. The corresponding quality-factor is Q-factor=. High fluctuations in the image of low energy events cause such rather modest rejection power. Simulations have shown that an application of any other additional parameter of image shape does not improve the resultant quality factor.
In observations of a point like -ray source the recorded images of the -ray-induced air showers are located in the camera focal plane mostly within the angular annulus limited by inner and outer radii of 0.3∘ and 1.2∘ from the camera center, respectively555Note that due to the high rate of the low energy events they are basically dominant in the entire sample of registered -rays.. Thus before applying the orientation and shape cuts one can noticeably enhance the content of the -ray showers by using the cut (angular distance of the image centroid to the camera center). Such selection criterion allows for the reduction of the rate of the background events by a factor of 2.
Since the shape of the images generated by the electron- and -ray-induced atmospheric showers are almost identical, one can in both cases use the acceptances of the analysis cuts derived for the -ray-induced showers.
The analysis of data taken with a single stand-alone telescope at shower energies around 10 GeV is not straight-forward. Note that there were a number of trials using advanced, sometimes very sophisticated, analysis methods to improve the rejection of the background and consequently to enhance the -ray abundance in data taken with a single telescope. However none of them demonstrated drastically improved performance as compared with the standard multi-parametric approach (”super-cuts”). Recent studies on the multi-variate analysis in application to the data simulated for a 30 m telescope have shown that a realistic quality-factor for such low energy events is of about , which corresponds to the -ray and cosmic ray acceptance of and , respectively (Konopelko et al. 2005). This was achieved using Bayesian decision rules and a non-parametric estimate of the multi-parameter density.
The analysis cuts for a single telescope as well as for a system of telescopes were selected here primarily on the basis of equal -ray acceptance across the entire dynamic energy range. Therefore these cuts do not affect noticeably the position of the peak in the differential detection rate and the estimated value of the energy threshold.
8.4 Sensitivity
The sensitivity of the Čerenkov telescope in observations of the point-like -ray sources can be defined in different ways. One approach, which is widely used, is to calculate the minimum flux of the rays, which can be detectable after 50 hrs of observations at the significance level above 5 ( is one standard deviation of a number of background events). The total number of -ray, proton, and electron showers after applying analysis cuts, which remains in the data sample of observational time , can be calculated as
| (13) |
where is the selected666Here the selection of the energy threshold is defined by the physics of the source, which finally defines the favorable energy range. energy threshold energy. is the upper energy boundary, which is chosen well above the actual threshold of the detector ( is usually the maximal energy of the simulated showers, and ) allowing accurate calculation of the detection rates. The detection areas of proton and electron showers are collection areas averaged over the solid angle . Thus the collection areas used in Eqn. (13) are , and . are the acceptances of the -ray-, proton-, and electron-induced showers after applying directional and shape cuts, respectively. The integral detection rates for the -ray, electron, and proton showers are summarized in Table 4.
The corresponding signal-to-noise ratio after 50 hrs exposure can be calculated as
| (14) |
In order to derive the -ray flux, which yields the desirable significance of 5 one can scale Crab flux as
| (15) |
For the real detection of the source one has to control in addition a number of detected -ray showers, which should not be less than 10, which sets the second condition of the minimum detectable flux
| (16) |
Note that for the detector considered here the first condition is always stronger, which means that the total number of detected -rays is in fact high, and the second condition is almost always holds (). The final results on the sensitivity calculations for the system of two 30 m telescopes are summarized in Table 4.
| , GeV | , Hz | , Hz | , Hz | |
|---|---|---|---|---|
| 5 | 5.5 | 2.5 | 1.0 | |
| 10 | 4.7 | 1.5 | 1.0 | |
| 30 | 2.5 | 0.18 | 0.90 | |
| 50 | 1.7 | 0.06 | 0.68 | |
| 100 | 1.0 | 0.01 | 0.34 |
It is worth noting that at low energies the electron background is dominant over the cosmic ray background. The electron component of the primary cosmic rays at energies about 5 GeV becomes, in fact, a major background. The images of electron and -ray showers are almost indistinguishable in shape, which make the electron background an absolute limiting factor for the detector sensitivity. Improved angular resolutions might help to reject contamination of the isotropic electron flux in observations of the point-like -ray source.
The sensitivity of the system of two 30 m telescopes can be compared to the corresponding sensitivities of the single stand-alone telescope of the same size as well as with the array of five such telescope operating in the stereoscopic mode - STEREO ARRAY. The signal and background rates, as well as resulting sensitivities are given in Table 5777Note that for any of given configurations the peak in the differential detection rate lays well above the chosen energy threshold – =5 GeV..
| Detector: | , Hz | , Hz | |
|---|---|---|---|
| I | 16.8 | 1726 | |
| II | 11.2 | 1098 | |
| V | 20.1 | 3261 |
One can see in Table 5 that single stand-alone telescopes provide rather high -ray rates. However, due to limited rejection power the final sensitivity is by more than a factor of 2 lower than for a system of two telescopes, and by a factor of 5 as compared with the system of five telescopes. At the same time the increase in sensitivity with two to five telescopes is relatively modest. It is provided by the increase in collection area of the -ray showers, as well as a slightly better angular resolution for higher telescope multiplicity events.
Given the results obtained here one can consider an alternative approach, which is a construction of a few systems of two 30 m telescopes spatially separated in the observational plane. In such a case the sensitivity of entire telescope array will be proportional to , where is a number of independent two telescopes subsystems.
8.5 Array Flexibility
The flexibility in operation of the array of the atmospheric imaging Čerenkov telescopes is in fact an important issue. For instance one can use two subsystems of the array for simultaneous observations of two different sources. Apparently it increases the observational time by factor of two, but with a somewhat reduced sensitivity. On other hand in some cases all telescopes of the array can be used independently in a stand-alone mode for the monitoring of a number of potential -ray sources (like AGNs) to perform quick-look discovery observations for the sample of promising candidates.
9 Conclusion
Based on the detailed Monte Carlo simulations we have studied the performance of the system of two, as well as five, 30 m imaging atmospheric Čerenkov telescopes. An array of five 30 m telescopes is very close to the optimum detector for the -ray observations above 10 GeV. Such an array of detectors allows for the reduction of the energy threshold down to a few GeV, and would be the most sensitive instrument in the field of ground-based high energy -ray astronomy in this energy range.
The STEREO ARRAY might be considered as a prototype for a major future detector for ground-based high energy -ray astronomy. Its construction and operation will enable scientists to perform high quality -ray observations from the ground, which will provide an overwhelming insight into the understanding of the mechanics of high energy -ray emission from the various physical environments in the Universe. The physics rationale of the STEREO ARRAY, provided with a sensitivity value as given here, is a subject for another forthcoming paper.
Acknowledgements
I would like to thank James Buckley, Werner Hofmann, and Trevor Weekes for the discussions on a subject of this paper. I would like also thank the referee, who remains anonymous, for comments and suggestions, which have improved the quality of the paper.
References
-
1.
Aharonian et al. The energy spectrum of TeV gamma rays from the Crab Nebula as measured by the HEGRA system of imaging air Čerenkov telescopes, ApJ, 539, 317, (2000)
-
2.
Aharonian et al. The Crab Nebula and Pulsar between 500 GeV and 80 TeV: Observations with the HEGRA Stereoscopic Air Cerenkov Telescopes, ApJ, Volume 614, Issue 2, pp. 897 (2004)
-
3.
Aharonian, F., Hofmann, W., Konopelko, A., Völk, H.J. The potential of the ground based arrays of imaging atmospheric Cherenkov telescopes, Astroparticle Physics, Volume 6, Issue 3-4, 343; 369; (1997)
-
4.
Aharonian, F., Konopelko, A., Völk, H.J., Quintana, H.5@5 - a 5 GeV energy threshold array of imaging atmospheric Cherenkov telescopes at 5 km altitude, Astroparticle Physics, Vol. 15, N4, 335 (2001)
-
5.
Akhperjanian, A., Sahakian, V. Performance of a 20 m diameter vCerenkov imaging telescope, Astroparticle Physics, Volume 21, Issue 2, p. 149 (2004)
-
6.
Atoyan, A., Aharonian, A. On the mechanisms of gamma radiation in the Crab Nebula, MNRAS, 278, 525 (1996)
-
7.
Bernloehr et al. The optical system of the H.E.S.S. imaging atmospheric Cherenkov telescopes, Astroparticle Physics, Vol. 20, Issue 2, 111 (2003)
-
8.
de Jager et al. Gamma-Ray Observations of the Crab Nebula: A Study of the Synchro-Compton Spectrum, ApJ, 457, 253 (1996)
-
9.
DuVernois et al. Cosmic-ray electrons and positrons from 1 to 100 GeV: measurements with HEAT and their interpretation, ApJ, 559, 296 (2001)
-
10.
Hinton, J. The status of the HESS project, New Astronomy Reviews, Vol. 48, Issue 5-6, 331 (2004)
-
11.
Hofmann, W. How to focus a Cherenkov telescope, J. Phys. G: Nucl. Part. Phys. 27, No 4, 933 (2001)
-
12.
Konopelko, A., et al. Performance of the stereoscopic system of the HEGRA imaging air Cerenkov telescopes: Monte Carlo simulations and observations, Astroparticle Physics, Volume 10, Issue 4, p. 275 (1999)
-
13.
Konopelko, A. Space-angular and temporal parameters of Cherenkov light emission in air showers of energy from 1 TeV down to 10 GeV, Proc. of the Kruger Park Workshop on TeV Gamma-Ray Astrophysics ”Towards a Major Atmospherics Cherenkov Detector - V, (ed. O.C. de Jager), Kruger Park, South Africa, August 8-11, 208(1997)
-
14.
Konopelko, A. Altitude effect in Cerenkov light flashes of low energy gamma-ray-induced atmospheric showers, Journal of Physics G: Nuclear and Particle Physics, Volume 30, Issue 12, pp. 1835 (2004).
-
15.
Konopelko, A., Chlingarian, A., Reimer, A., Study on background rejection and energy resolution with a 30 m stand-alone imaging atmospheric Cherenkov telescope using non-parameteric multi-variate methods in a sub-100 GeV energy range, in preparation (2005)
-
16.
Lorenz, E., Mirzoyan, R. What have we learned from the MAGIC telescope developments for a future large IACT ?, Proc. Intern. Symp. “High Energy Gamma-ray Astronomy”, Eds. F.Aharonian and H.J. Völk, AIP Conf. Proceed. 558, 586 (2000)
-
17.
Lucarelli, F., Konopelko, A., Aharonian, F., Hofmann, W., Kohnle, A., Lampeitl, H., Fonseca, V. Observations of the Crab Nebula with the HEGRA system of IACTs in convergent mode using a topological trigger, Astroparticle Physics, Vol. 19, Issue 3, 339 (2003)
-
18.
MAGIC Proposal: “The MAGIC Telescope”: design study for the construction of a 17 m Čerenkov telescope for gamma-ray astronomy above 10 GeV MPI-PhE/98-5 (1998)
-
19.
Masterson, C. Observation of galactic TeV gamma ray sources with H.E.S.S., Proc. 28th Int. Cosmic Ray Conf., Tsukuba, Univ. Academy Press, Tokyo, p. 2323 (2003)
-
20.
Sanuki et al. Precise measurement of cosmic-ray proton and Helium spectra with the BESS spectrometer, ApJ, 545, 1135 (2000)
-
21.
Simpson, J.A. Ann. Rev. Nucl. and Part. Sci., 33, 323 (1983)
-
22.
Wiebel, B. Chemical composition in high energy cosmic rays, Fachbereich Physik Bergische Iniversität Gesamthochschule, Wuppertal, WUB 94-08 (1994)