Inter-occurrence Times in the Bak-Tang-Wiesenfeld Sandpile Model: A Comparison with the Turbulent Statistics of Solar Flares
Abstract
A sequence of bursts observed in an intermittent time series may be caused by a single avalanche, even though these bursts appear as distinct events when noise and/or instrument resolution impose a detection threshold. In the Bak-Tang-Wiesenfeld sandpile, the statistics of quiet times between bursts switches from Poissonian to scale invariant on raising the threshold for detecting instantaneous activity, since each zero-threshold avalanche breaks into a hierarchy of correlated bursts. Calibrating the model with the time resolution of GOES data, qualitative agreement with the inter-occurrence time statistics of solar flares at different intensity thresholds is found.
pacs:
96.60.Rd, 05.45.Tp, 05.65.+b, 47.27.EqA simple picture of intermittency in turbulent flows places rare, hot regions that dissipate energy inside a cold laminar sea. As the hot regions evolve, they maintain a clustered structure, and the dissipation, occurring at small scales, remains correlated at large ones. For instance, examining the sky at night, one sees stars, galaxies and clusters of galaxies against a dark background Ozernoi and Chernin (1968); Bak and Paczuski (2005). Many striking examples of turbulent intermittency occur in astrophysical, space or laboratory plasmas, such as flaring events in the solar corona Aschwanden et al. (2000); Lu and Hamilton (1991), magnetic substorms Chang (1999), bursty bulk flows Angelopoulos et al. (1999), auroral emissions Kozelov et al. (2004), turbulence in the solar wind Freeman et al. (2000); Leubner and Voros (2005), or bursts observed in RFX Spada et al. (2001); Antoni et al. (2001) and RFP experiments Marrelli et al. (2005). Important parameters include the Reynolds number(s), (or , etc.), where is the viscosity, is the magnetic diffusivity, and is the velocity difference over the integral scale . For increasing , characteristic widths of the dissipating regions decrease, while their intensity increases. Thus turbulence becomes an “on/off” phenomena as the appropriate Reynolds number(s) become large Frisch (1995); Bak and Paczuski (2005).
The controversial hypothesis that turbulent intermittency may be a manifestation of self-organized criticality (SOC) has been discussed by Bak and others Bak et al. (1987); Lu and Hamilton (1991); Chang (1999); Bak et al. (1990); De Menech and Stella (2002); Bershadskii and Sreenivasan (2003); Bak and Paczuski (2005); Paczuski and Hughes (2004); Charbonneau et al. (2001); Sánchez et al. (2002); Wheatland (2000). In this scenario, intermittent energy dissipation is a stick-slip or threshold process. Each slip can trigger further slips – either through short or long range interactions. Eventually, a regime materializes where sparse, sporadic avalanches of intense energy dissipation interrupt laminar regions of space-time which rest near static equilibrium with little dissipation despite the continuous, global input of energy.
Up to now, SOC has mostly been studied with vividly plain models, such as the original Bak-Tang-Wiesenfeld sandpile (BTW), that ignore many features of hydrodynamic, plasma or other kinds of turbulence. Rather, they generate patterns of rapid energy dissipation in space and time, which is the hallmark of intermittency. On the other hand, most studies of turbulence Frisch (1995) examine structure functions and multiscaling phenomena She and Leveque (1994); Dubrulle (1994), and/or nonlinear instabilities and coherent structures, etc. Métais and Lesieur (1991); Schekochihin et al. (2004); Chang (1999), all of which are associated with intermittency but do not directly characterize the bursts of energy dissipation in space and time. As a result, some comparisons that have been made are superficial and should be made more definitive. Further, one argument used so far to distinguish SOC from turbulence is misleading and erroneous.
While BTW and other SOC models exhibit a broad distribution of avalanche sizes and durations, which are comparable to e.g. solar flare data, a marked difference has been noted regarding the time intervals between bursts. For instance, Boffetta et al. Boffetta et al. (1999) found that the distribution of times between flares exhibits power law statistics, while intervals between subsequent avalanches in BTW are (approximately) Poissonian. Further, they and other groups Freeman et al. (2000); Spada et al. (2001); Antoni et al. (2001); Carbone et al. (2002); Marrelli et al. (2005) found that shell or reduced magnetohydrodynamics (MHD) models gave a better description of the waiting time statistics, and some Boffetta et al. (1999); Spada et al. (2001); Antoni et al. (2001); Carbone et al. (2002) used this to distinguish SOC from turbulence, or to question the applicability of the SOC paradigm for magnetically confined plasmas in thermonuclear research Spada et al. (2001).
We make three key points. First, intermittent bursts can never be detected, nor distinguished from the background, at arbitrarily low thresholds. For instance, the studies above comparing reduced MHD or shell models with flares or bursts in man-made plasmas use a threshold for defining bursts. Such a threshold is realistic because the emission associated with e.g. flares decays slowly after a local peak, allowing overlaps with subsequent peaks. Although a threshold is unavoidably connected to the precise definition of events, robust features may be observed with rescaled distributions measured at different thresholds Baiesi et al. ; Corral (2003). For such time series, event durations and quiet times between them are measured on a single clock with equal precision. Thus one can consider the hypothesis that the sequence of bursts arises from a single avalanche observed at finite detection threshold. The bursts within an avalanche in a SOC system can be expected to be correlated in space and time, being part of the same, critical process.
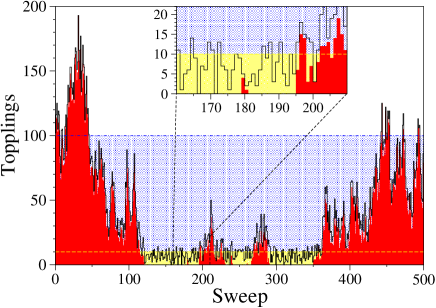
To test this idea, we study a BTW sandpile Bak et al. (1987) in which the time unit is that of a parallel update step, and consider both slow driving (A) and running sandpile Hwa and Kardar (1992); Sánchez et al. (2002); Corral and Paczuski (1999) (B) conditions. In the time series of the activity, , bursts are defined as consecutive intervals during which , where the detection threshold for events is (see Fig. 1). A data analysis technique analogous to that recently developed by Baiesi et al. Baiesi et al. to examine inter-occurrence statistics of flares provides a direct comparison between results from numerical simulations of BTW and solar flares. It turns out that BTW shares several features with the intermittent statistics of flares, as shown below.
The BTW sandpile consists of a lattice with a discrete number of sand grains occupying each site . We study two versions: (A) in the slow driving limit, a grain is added to the pile at a randomly chosen location when the previous () avalanche ends. The durations () and quiet times () then refer to intervals between local peaks within each avalanche and statistics are obtained over many avalanches. In the second case (B), one grain of sand is dropped every update steps at a randomly chosen site. In both cases, at each update step, , all sites that exceed a threshold for stability, , topple in parallel by distributing a single grain of sand to each of their four nearest neighbors or, for boundary sites, over the edge of the lattice. Taken as the instantaneous dissipation signal, the activity is the number of unstable sites toppling at each parallel update step. In model B, if , the sequence of topplings is also interrupted by instances where the activity completely stops () Corral and Paczuski (1999). The quantity is the average duration of avalanches on a lattice of scale in the stationary state of model A. For both A and B, consecutive stopping points separated by intervals where delimit avalanches. The time series of Model B has similar character to the solar flare data studied in Ref. Baiesi et al. , with a broad distribution of events that exceed each threshold , albeit with a finite-size cutoff curtailing the power-law tail observed in Fig. 2a of Ref. Baiesi et al. .
Consider an observer who measures the global activity sequence with a finite error, so that the time series she records is . For instance, let be an independent random number uniformly distributed between 0 and 15. The effect of this noise is shown in Fig. 1 for model B. One way for the observer to separate the signal from the noise is to increase her threshold for detecting events, and coarse-grain her unit of measurement. In observing natural phenomena, such as flares, these detection thresholds are an intrinsic and unavoidable part of the measurement. Hence, we study the original time series together with a finite threshold (e. g. as in Fig. 1) to distinguish bursts, considering all instances with to have no activity. For sufficiently large , the event statistics that the observer measures (at large times) are the same as the actual statistics without noise.
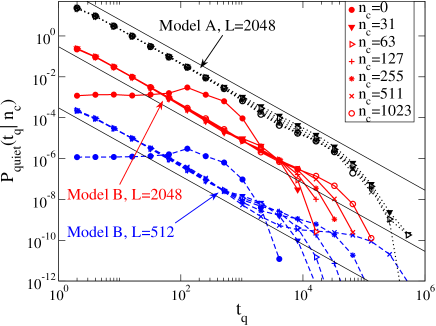
As Fig. 2 shows, on increasing the threshold from zero, the distribution of quiet times for model B switches from an (approximately) exponential distribution to a power law,
| (1) |
For model A one observes an even cleaner and broader scaling regime, with the same 111 Error bars quoted here and elsewhere in the text represent our estimate of statistical and systematic errors associated with finite size effects.. In model A, the power law tail arises from the correlations of bursts within each avalanche. Further, the Abelian property of BTW assures that the power law behavior of quiet times in model B cannot be due to overlapping avalanches. Thus, the natural introduction of detection thresholds leads to the discovery of a hierarchical sequence of correlated bursts (or sub-avalanches) within a large avalanche.
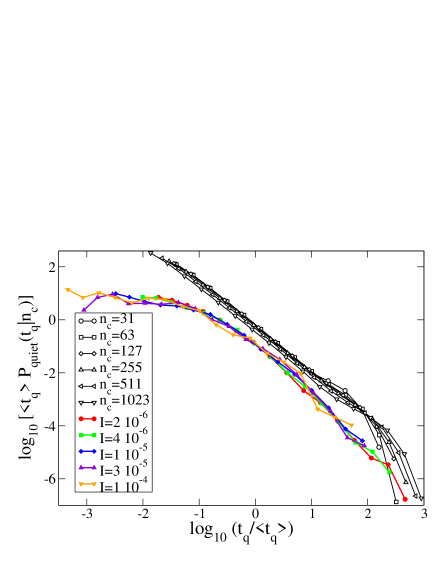
A similar data analysis by Baiesi et al. Baiesi et al. for flares, detected as intervals during which the emission intensity in the GOES time series exceeds , used a particularly simple scaling ansatz for the quiet time distribution,
| (2) |
Here is a scaling function and the average quiet time for a given threshold, , provides a factor that collapses distributions measured at different . While BTW does not obey this particular scaling ansatz, for comparison we apply Eq. (2) to BTW with different values of . This enables us to study the dependence of two dimensionless quantities vs. at different thresholds for both flares and BTW. As shown in Fig. 3, we find that although the scaling functions are clearly different for , they are similar for intermediate arguments.
Event durations, , observed at different thresholds in BTW and for flares occurring during solar minimum, are shown in Fig. 4 222For flares, the distribution of burst durations is independent of threshold, but depends on the phase of the solar cycle Baiesi et al. .. In order to compare with BTW, we set the time resolution of the GOES data equal to the time resolution of BTW. One minute is set equal to one sweep. Using this straightforward calibration, the statistics of event durations are similar as well. In both cases, power law behavior is observed, . For flares at solar minimum Baiesi et al. , while this exponent the bursts in BTW is smaller.
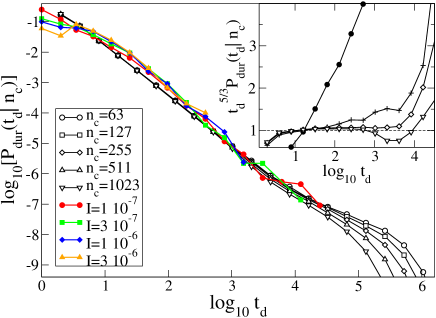
The inset of Fig. 4 shows how the apparent power law behavior for burst durations in BTW changes with increasing threshold . At sufficiently large a plateau appears in the function . This suggests a critical exponent at high thresholds, , similar to . The figure also demonstrates that the scaling behavior of burst durations, for the system sizes that were studied, differs at large from that at . In the latter case, Lübeck and Usadel Lübeck and Usadel (1997) determined a critical exponent , while Stella and De Menech Stella and Menech (2001) found multiscaling.
If the sequence of quiet times are uncorrelated, the cumulative variable exhibits diffusive behavior, with an average variance scaling as , with De Menech and Stella (2000). Our measurements of this quantity confirm that quiet time intervals for BTW at different thresholds are uncorrelated, in all cases giving . However, at solar minimum, we get (see also Leddon (2001)). Therefore, BTW does not reproduce correlations between quiet times for flares.
In fact, a variety of SOC models exhibit power laws in times between events. Previous analyses Norman et al. (2001); Hedges and Takacs (2005); Baiesi and Maes (2005) using a detection threshold considered a completely different limit than that discussed here, namely that of an infinite time scale separation between the driving rate and the durations of events. Consequently, a threshold was imposed on a variable related to the total size or duration of each avalanche, rather than its instantaneous dissipation. However, as explained earlier our limit of overlapping time scales for durations and quiet times may be the correct one to describe intermittency in turbulence. Indeed, cellular automata models of laboratory plasmas are running sandpiles; see e.g. Newman et al Newman et al. (1996). Within this scheme, some works Woodward et al. (2004); Sánchez et al. (2002), also using a threshold, have found power law quiet times for the Hwa-Kardar Hwa and Kardar (1992) running sandpile driven at a sufficiently high rate. This was claimed to be due to interactions between overlapping avalanches. In contrast, here we show that the BTW model, considering one avalanche at a time, generates a power law distribution of quiet times when a finite detection threshold is used. Its Abelian property assures that this correlation remains the same when the model is driven at a finite rate, in agreement with the results shown here. It is unlikely, though, that the Abelian property of BTW is essential to getting a scale free distribution of quiet times, although this remains to be clarified by studying other models in a similar way.
In conclusion, we have demonstrated that SOC remains a viable alternative for the explanation of intermittent dissipation in turbulence by comparing results from numerical simulations of a BTW sandpile with solar flare statistics. By including an inevitable detection threshold in the analysis of BTW, as well as allowing an overlap of time scales between burst durations and quiet times, qualitative correspondence is obtained for the power law statistics of inter-occurrence times for solar flares. Studies of more physically realistic SOC including detection thresholds for short time dissipation in the whole system may improve quantitative agreement.
M. P. thanks Peter Grassberger for comments on the manuscript. M. B. acknowledges support from an FWO post-doctoral position (Flanders). S. B. thanks the Perimeter Institute for its hospitality.
References
- Ozernoi and Chernin (1968) L. M. Ozernoi and A. D. Chernin, Astron. Zh. 45, 1137 (1968).
- Bak and Paczuski (2005) P. Bak and M. Paczuski, Physica A 348, 277 (2005).
- Aschwanden et al. (2000) M. Aschwanden et al., Astrophys. J. 535, 1047 (2000).
- Lu and Hamilton (1991) E. Lu and R. Hamilton, Astrophys. J. 380, L89 (1991).
- Chang (1999) T. Chang, Phys. Plas. 6, 4137 (1999).
- Angelopoulos et al. (1999) V. Angelopoulos, T. Mukai, and S. Kokubun, Phys. Plas. 6, 4161 (1999).
- Kozelov et al. (2004) B. V. Kozelov, V. M. Uritsky, and A. J. Klimas, GRL 31, 20804 (2004).
- Freeman et al. (2000) M. P. Freeman, N. W. Watkins, and D. J. Riley, Phys. Rev. E 62, 8794 (2000).
- Leubner and Voros (2005) M. P. Leubner and Z. Voros, Nonlin. Process. Geophys. 12, 171 (2005).
- Spada et al. (2001) E. Spada et al., Phys. Rev. Lett. 86, 3032 (2001).
- Antoni et al. (2001) V. Antoni et al., Phys. Rev. Lett. 87, 045001 (2001).
- Marrelli et al. (2005) L. Marrelli, L. Frassinetti, P. Martin, D. Craig, and J. S. Sarff, Phys. Plasmas 12, 030701 (2005).
- Frisch (1995) U. Frisch, Turbulence (Cambridge University Press, Cambridge, 1995).
- Bak et al. (1987) P. Bak, C. Tang, and K. Weisenfeld, Phys. Rev. Lett. 59, 381 (1987).
- Bak et al. (1990) P. Bak, K. Chen, and C. Tang, Phys. Lett. A 147, 297 (1990).
- De Menech and Stella (2002) M. De Menech and A. L. Stella, Physica A 309, 289 (2002).
- Bershadskii and Sreenivasan (2003) A. Bershadskii and K. R. Sreenivasan, Eur. Phys. J. B 35, 513 (2003).
- Paczuski and Hughes (2004) M. Paczuski and D. Hughes, Physica A 342, 158 (2004).
- Charbonneau et al. (2001) P. Charbonneau et al., Sol. Phys. 203, 321 (2001).
- Sánchez et al. (2002) R. Sánchez, D. E. Newman, and B. A. Carreras, Phys. Rev. Lett. 88, 06832 (2002).
- Wheatland (2000) M. Wheatland, ApJ. 536, L109 (2000).
- She and Leveque (1994) Z. She and E. Leveque, Phys. Rev. Lett. 72, 336 (1994).
- Dubrulle (1994) B. Dubrulle, Phys. Rev. Lett. 73, 959 (1994).
- Métais and Lesieur (1991) O. Métais and M. Lesieur, Turbulence and Coherent Structures (Springer, New York, 1991).
- Schekochihin et al. (2004) A. A. Schekochihin, S. C. Cowley, J. L. Maron, and J. C. McWilliams, Phys. Rev. Lett. 92, 064501 (2004).
- Boffetta et al. (1999) G. Boffetta et al., Phys. Rev. Lett. 83, 4662 (1999).
- Carbone et al. (2002) V. Carbone et al., Europhys. Lett. 88, 178501 (2002).
- (28) M. Baiesi, M. Paczuski, and A. L. Stella, cond-mat/0411342.
- Corral (2003) A. Corral, Phys. Rev. E 68, 035102(R) (2003).
- Hwa and Kardar (1992) T. Hwa and M. Kardar, Phys. Rev. Lett. 45, 7002 (1992).
- Corral and Paczuski (1999) Á. Corral and M. Paczuski, Phys. Rev. Lett. 83, 572 (1999).
- Lübeck and Usadel (1997) S. Lübeck and K. D. Usadel, Phys. Rev. E 55, 4095 (1997).
- Stella and Menech (2001) A. L. Stella and M. D. Menech, Physica A 295, 101 (2001).
- De Menech and Stella (2000) M. De Menech and A. L. Stella, Phys. Rev. E 62, R4528 (2000).
- Leddon (2001) D. Leddon (2001), cond-mat/0108229.
- Norman et al. (2001) J. P. Norman, P. Charbonneau, S. W. McIntosh, and H.-L. Liu, Astrophys. J. 557, 891 (2001).
- Hedges and Takacs (2005) M. Hedges and G. Takacs (2005), physics/0505015.
- Baiesi and Maes (2005) M. Baiesi and C. Maes (2005), cond-mat/0505274.
- Newman et al. (1996) D. E. Newman, B. A. Carreras, P. H. Diamond, and T. S. Hahm, Phys. Plasmas 3, 1858 (1996).
- Woodward et al. (2004) R. Woodward et al., Phys. Rev. Lett. 93, 249801 (2004).