Dry Mergers in GEMS:
The Dynamical Evolution of Massive Early-Type Galaxies
Abstract
We have used the Hubble Space Telescope image mosaic from the GEMS (Galaxy Evolution from Morphology and SEDs) survey in conjunction with the COMBO-17 photometric redshift survey to constrain the incidence of major mergers between spheroid-dominated galaxies with little cold gas (dry mergers) since . A set of -body merger simulations was used to explore the morphological signatures of such interactions: they are recognizable either as kpc separation close pairs or because of broad, low surface brightness tidal features and asymmetries. Data with the depth and resolution of GEMS are sensitive to dry mergers between galaxies with for ; dry mergers at higher redshifts are not easily recovered in single-orbit HST imaging. Six dry mergers (12 galaxies) with luminosity ratios between 1:1 and 4:1 were found from a sample of 379 red early-type galaxies with and . The simulations suggest that the morphological signatures of dry merging are visible for Myr and we use this timescale to convert the observed merger incidence into a rate. On this basis we find that present day spheroidal galaxies with on average have undergone between 0.5 and 2 major dry mergers since .
We have compared this result with the predictions of a Cold Dark Matter based semi-analytic galaxy formation model. The model reproduces the observed declining major merger fraction of bright galaxies and the space density of luminous early-type galaxies reasonably well. The predicted dry merger fraction is consistent with our observational result. Hence, hierarchical models predict and observations now show that major dry mergers are an important driver of the evolution of massive early-type galaxies in recent epochs.
1 Introduction
Numerical simulations have long predicted that early-type galaxies, with spheroid-dominated stellar light profiles, are a natural outcome of major galaxy mergers (e.g., Toomre & Toomre, 1972; Barnes & Hernquist, 1996; Naab & Burkert, 2003). Yet, both the timing and nature of the violent assembly of early-type galaxies remain frustratingly unclear. Look-back studies have recently become large enough to demonstrate a steady growth in the total stellar mass in the red-sequence galaxy population since (e.g., Chen et al., 2003; Bell et al., 2004a; Faber et al., 2005). The majority of these red-sequence galaxies are morphologically early-type out to at least (Bell et al., 2004b); indeed, recent works have confirmed a growth in the total stellar mass in morphologically early-type galaxies from to the present day (Cross et al., 2004; Conselice et al., 2005). This growth is dominated by a growing number of early-type galaxies (e.g., Bell et al., 2004a; Drory et al., 2004; Faber et al., 2005)111Although it is possible that the number of very massive galaxies, with , does not change by a large amount since (e.g., Saracco et al., 2005).. Interestingly, relatively few blue galaxies bright enough to be the star-forming progenitor of a massive non-star-forming early-type galaxy are observed (Bell et al., 2004a; Faber et al., 2005). Thus, it has been suggested that mergers between non-star-forming early-type galaxies may occur (so-called ‘dry mergers’), and build up the massive early-type galaxy population (Bell et al., 2004a; Faber et al., 2005). Such mergers are observed at least in clustered environments (van Dokkum et al., 1999; Tran et al., 2005). Yet, it is still unclear how important dry mergers are in driving the evolution of luminous, massive early-type galaxies, averaged over all cosmic environments.
Dry mergers may also play an important role in explaining another interesting phenomenon: the strong differences between the observed properties of high-luminosity (with ) and low-luminosity early-type galaxies. Luminous (i.e., massive) early-type galaxies possess boxy isophotes, cores in their light distributions, and are supported primarily by random stellar motions. In contrast, faint early-type galaxies have diskier isophotes, derive more support from organized rotational motions, and have power-law (or Sérsic) light distributions all the way into their central-most regions (e.g., Bender, 1988; Kormendy & Bender, 1996; Lauer et al., 1995; Faber et al., 1997; Graham, 2004). These structural differences may be the results of galaxy merging between different types of progenitors (Khochfar & Burkert, 2003).
There is growing evidence that the faint early-type galaxy population has grown substantially at recent times through galaxy merging and/or disk fading. There is a deficit of faint red-sequence galaxies in galaxy clusters (Kodama et al., 2004; de Lucia et al., 2004a), and those that are present appear to have rather young stellar populations (van der Wel et al., 2004). Furthermore, faint early-type galaxies at the present day can have important contributions from younger stars (Kuntschner, 2000; Trager et al., 2000; Thomas et al., 2005). Simulations of merging disks easily yield remnants with properties consistent with the typically disky, partially rotationally-supported low-luminosity elliptical galaxies (e.g., Toomre & Toomre, 1972; Naab, Burkert, & Hernquist, 1999; Bendo & Barnes, 2000; Naab & Burkert, 2003), especially for unequal-mass interactions. Taken together with observations of a declining merger rate, implying between 0.2 and 1 merger per galaxy (e.g., Le Fèvre et al., 2000; Patton et al., 2002; Conselice et al., 2003, although see Lin et al. 2005), it is likely that mergers between gas-rich galaxies have played an important role in building up low-luminosity early-type galaxies.
In contrast, it is increasingly clear that mergers of gas-rich disks cannot be the main formation route of more massive early-type galaxies. Not only are there relatively few blue star-forming galaxies at luminous enough to fade into present-day massive non-star-forming galaxies, but the boxy isophotes and cores in the light distributions of massive early-type galaxies are challenging to reproduce in mergers of disk galaxies (Naab & Burkert, 2001; Barnes, 2002; Naab & Burkert, 2003). Such properties can, however, be naturally reproduced by mergers of elliptical galaxies (Naab, Khochfar, & Burkert, 2006). This hypothesis is given some observational support by van Dokkum et al. (1999) and Tran et al. (2005), who found that % of bright galaxies in the outskirts of the cluster MS105403 were in bound pairs and were likely to merge on Gyr timescales; most of these are pairs of early-type galaxies. Semi-analytic work by Khochfar & Burkert (2003, 2005) supports the formation of massive early-type galaxies ending up in clusters by this route.
A direct measure of the frequency of dry mergers over the last half of cosmic time will further constrain the importance of this process in driving the evolution of the luminous early-type galaxy population. Furthermore, because the majority of massive galaxies are red early-type galaxies at all epochs since (Bell et al., 2004a), the dry merger rate gives important insight into the merging history of the most massive galaxies at recent times. Finally, gas-free mergers are relatively straightforward to model, and their luminosity and color evolution is easily predicted, significantly simplifying the estimation of merger rates.
The goal of this paper is to use these data to constrain the incidence of dry mergers in the GEMS dataset. To realize this goal, a number of ingredients must be in place. Firstly, a scheme must be devised by which one can reliably and reproducibly identify mergers of gas-poor systems. Secondly, the timescale over which signatures of gas-poor merging are identifiable must be characterized. Finally, these criteria must be applied to the data; coupled with the timescale, a merger frequency can be estimated.
In this paper, we present our first attempt to address this issue using high-resolution HST data from GEMS (Galaxy Evolution from Morphology and SEDs; Rix et al., 2004), photometric redshifts from COMBO-17 (Classifying Objects by Medium-Band Observations in 17 Filters; Wolf et al., 2004), and state-of-the-art -body and semi-analytic simulations. We briefly describe the data in §2. We outline the selection philosophy in §3. In order to devise criteria by which one can select candidate dry mergers and understand over which timescale these selection criteria are sensitive, we explore the characteristics of a suite of -body simulation mergers between spheroid-dominated galaxies (§3.1). We then apply these selection criteria to the data in §3.2. We use these results to derive a dry merger fraction and incidence in §4. In §5 we compare our results with limits on dry merger rates from other observations, compare with published merger rates, and compare the observations with the predictions of a Cold Dark Matter (CDM) based semi-analytic model. In the Appendix, we explore the importance of high-speed fly-by (unbound) interactions, and argue that the vast majority of tidally-distorted interacting spheroids should be in the lowest-density environments capable of hosting spheroid-dominated galaxies, and are therefore likely to merge. Throughout, we assume , , and km s-1 Mpc-1.
2 The Data
COMBO-17 has imaged the extended Chandra Deep Field South using 5 broad and 12 medium passbands complete to apparent -band magnitude limits of . Using these 17-passband photometric data in conjunction with galaxy, star, and AGN template spectra, classifications and redshifts are assigned for % of the objects with sufficient flux. The typical galaxy redshift accuracy is (Wolf et al., 2004), allowing construction of rest-frame colors and absolute magnitudes accurate to mag. In order to probe interactions between gas-free, non-star-forming galaxies, we select only galaxies on the red sequence with photometric redshifts for further study, following Bell et al. (2004a) and McIntosh et al. (2005).
We use F850LP imaging from the gems survey to provide resolution data for our sample of red-selected galaxies. Using the Advanced Camera for Surveys (Ford et al., 2003) on the HST, a area of the Extended Chandra Deep Field was surveyed to a depth allowing galaxy detection to a limiting surface brightness of mag arcsec-2 (Rix et al., 2004); in practice early-type galaxies have relatively high surface brightnesses, and are limited only by the magnitude limit of COMBO-17 redshift classification.
3 The selection of dry mergers
| Galaxy name | RA | Dec | z | Classification | ||
| hh mm ss | dd mm ss | |||||
| Galaxies thought not to be merging | ||||||
| GEMS 033139.25m275303.0 | 03 31 39.25 | 27 53 03.0 | 0.20 | 21.5 | 1.1 | 00000 |
| GEMS 033139.03m275300.1 | 03 31 39.03 | 27 53 00.1 | 0.20 | 21.4 | 1.3 | 00000 |
| GEMS 033145.09m275520.6 | 03 31 45.09 | 27 55 20.6 | 0.49 | 20.9 | 0.9 | 03003 |
| GEMS 033145.09m275517.4 | 03 31 45.09 | 27 55 17.4 | 0.57 | 20.0 | 1.0 | 03003 |
| GEMS 033155.67m273840.0 | 03 31 55.67 | 27 38 40.0 | 0.519 | 20.8 | 1.2 | 03300 |
| GEMS 033155.83m273839.4 | 03 31 55.83 | 27 38 39.4 | 0.526 | 20.1 | 1.2 | 03300 |
| GEMS 033307.89m275150.4 | 03 33 07.89 | 27 51 50.4 | 0.518 | 21.6 | 1.3 | 00003 |
| GEMS 033307.75m275151.2 | 03 33 07.75 | 27 51 51.2 | 0.44 | 20.3 | 1.0 | 00003 |
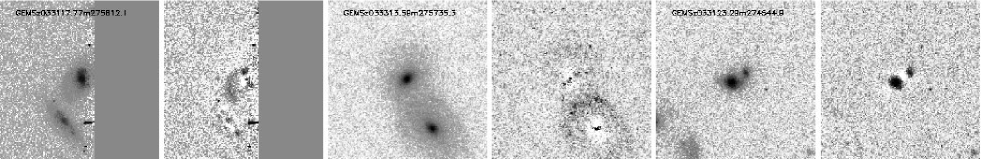
| Contentious cases | ||||||
| GEMS 033117.77m275812.1 | 03 11 17.77 | 27 58 12.1 | 0.58 | 21.0 | 1.0 | 30303 |
| GEMS 033117.82m275814.1 | 03 11 17.82 | 27 58 14.1 | 0.55 | 20.3 | 1.0 | 30303 |
| GEMS 033313.59m275735.3 | 03 33 13.59 | 27 57 35.3 | 0.66 | 23 | 1.25 | 20310 |
| GEMS 033313.51m275737.3 | 03 33 13.51 | 27 57 37.3 | 0.65 | 22.5 | 1.1 | 20310 |
| GEMS 033123.29m274544.9A | 03 31 23.29 | 27 45 44.9 | 0.55 | 20.8 | 0.95 | 22101 |
| GEMS 033123.29m274544.9B | 0.55 | 19.3 | 0.95 | 22101 | ||
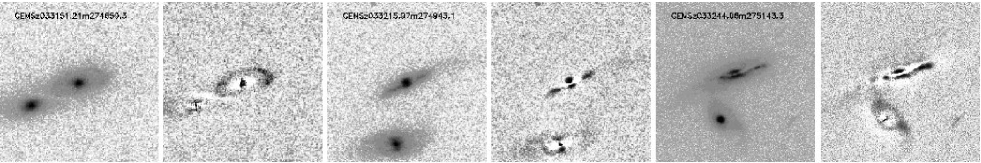
| Mergers of galaxies with significant bulges and gas | ||||||
| GEMS 033244.06m275143.3 | 03 32 44.06 | 27 51 43.3 | 0.26 | 21.7 | 1.3 | 33333 |
| GEMS 033244.27m275141.1 | 03 32 44.27 | 27 51 41.1 | 0.273 | 20.5 | 0.95 | 33333 |
| GEMS 033215.97m274943.1 | 03 32 15.97 | 27 49 43.1 | 0.591 | 22.3 | 1.5 | 33033 |
| GEMS 033216.16m274941.6 | 03 32 16.16 | 27 49 41.6 | 0.67 | 22.1 | 0.9 | 33033 |
| GEMS 033151.21m274659.3 | 03 31 51.21 | 27 46 59.3 | 0.672 | 22.7 | 1.0 | 23333 |
| GEMS 033151.37m274700.3 | 03 31 51.37 | 27 47 00.3 | 0.64 | 21.9 | 1.2 | 23333 |
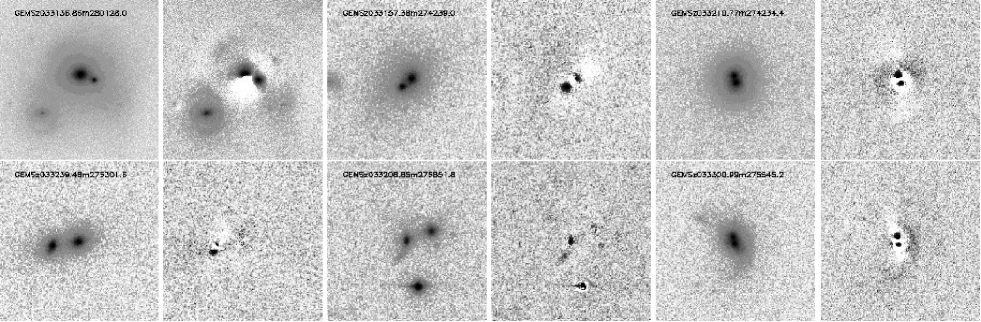
| Galaxies classified as dry mergers by the majority of classifiers | ||||||
| GEMS 033136.86m280128.0A | 03 31 36.86 | 28 01 28.0 | 0.15 | 22.1 | 1.5 | 23222 |
| GEMS 033136.86m280128.0B | 0.15 | 20.6 | 1.5 | 23222 | ||
| GEMS 033157.38m274239.0A | 03 31 57.38 | 27 42 39.0 | 0.62 | 22 | 1.3 | 22222 |
| GEMS 033157.38m274239.0B | 0.62 | 22 | 1.3 | 22222 | ||
| GEMS 033208.85m275851.83 | 03 32 08.85 | 27 58 51.8 | 0.54 | 20.4 | 1.0 | 23321 |
| GEMS 033208.76m275851.23 | 03 32 08.76 | 27 58 51.2 | 0.54 | 20.5 | 1.0 | 23321 |
| GEMS 033210.77m274234.4A4 | 03 32 10.77 | 27 42 34.4 | 0.419 | 21.9 | 1.2 | 22222 |
| GEMS 033210.77m274234.4B4 | 0.419 | 21.9 | 1.2 | 22222 | ||
| GEMS 033239.48m275301.6 | 03 32 39.48 | 27 53 01.6 | 0.65 | 22.5 | 1.25 | 22221 |
| GEMS 033239.47m275300.5 | 03 32 39.47 | 27 53 00.5 | 0.65 | 21.8 | 1.2 | 22221 |
| GEMS 033300.99m275545.2A5 | 03 33 00.99 | 27 55 45.2 | 0.620 | 21.7 | 1.0 | 23321 |
| GEMS 033300.99m275545.2B | 0.620 | 21.7 | 1.0 | 23321 | ||
For the sake of clarity, we present our selection criteria for candidate dry mergers here. Our philosophy is to catch the merging galaxies during the early stage of merging, where the two galaxy nuclei are distinct entities allowing relatively accurate characterization of the progenitors, including, importantly, an estimate of the mass ratio of the merger.
Therefore, we select for further study very close pairs of red-sequence bulge-dominated galaxies with i) projected separation kpc, ii) a -band absolute magnitude difference of 1.5 mag or less (corresponding to a 4:1 luminosity ratio difference, our threshold for a major merger), iii) photometric redshift difference .
However, not all projected close pairs will be merging; some may be projections of galaxies at significantly different redshifts, and some may be unbound fly-by interactions which will not merge. In order to address these problems, it was necessary to add a second layer of selection. Prolonged experimentation with automated merger diagnostics did not yield satisfactory results, and were unable to robustly flag the existence of broad, low surface brightness sheets of debris which are the hallmark of a gas-poor major merger. Therefore, we have used visual classification to screen the automatically-selected subsample of close pairs for signs of dry merging. This second level of visual selection is very stringent: in demanding low-level tidal features or very close separations, many merging systems are thrown out of the sample in phases where the tidal features are unobservably weak (simulations suggest this should be the case around of the time). While this reduces the sample size, it provides some measure of security against projections and fly-bys, and results in a smaller but cleaner sample of dry merger candidates (spectroscopy of our dry merger candidates is being sought and will be discussed in future works).
In order to calibrate out and understand the subjectivity of visual classifications, we have adopted a dual strategy: we have visually classified a suite of simulated dry mergers and fly-bys(selected to have projected separation kpc) in order to understand better the signatures of a dry merger and to characterize the timescale over which the signs of dry merging are recognizable (§3.1), and we use 5 independent sets of classifications to quantify the degree of reproducibility of dry merger classifications (§3.2).
3.1 Expected Morphological Signatures of Dry Mergers
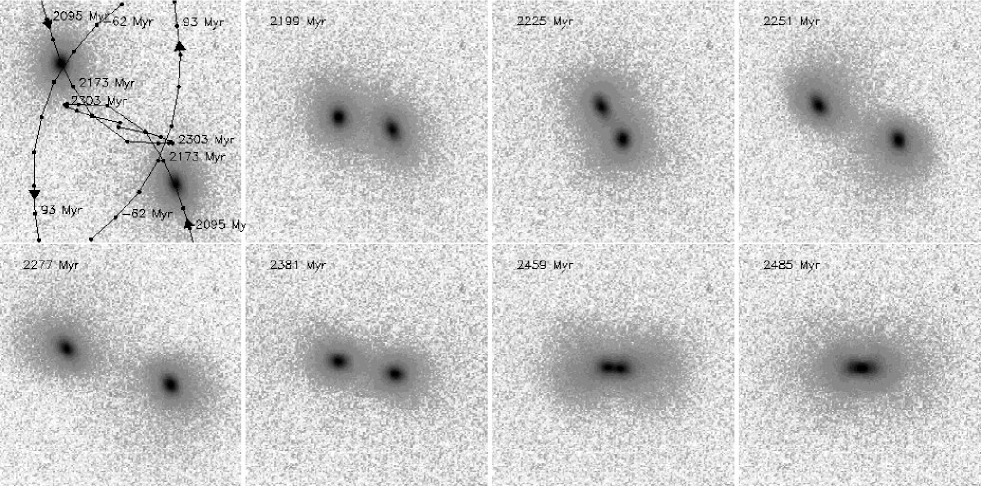
In order to explore the expected appearance of morphological indicators of dry mergers, and the timescales over which these indicators are visible with single-orbit HST imaging, we make use of the simulations of Naab, Khochfar, & Burkert (2006). The progenitors are early-type galaxies, and are themselves the remnants of gas-free disk–disk mergers from Naab & Burkert (2003)222Gas-rich major merger remnants are somewhat diskier than remnants from gas-free major disk mergers (Barnes, 2002, Naab & Burkert, in prep.). The adoption of a gas-rich major merger remnant as the spheroid merger progenitor in what follows does not significantly affect the outcome, while avoiding extra uncertainties associated with the detailed choice of star formation rate and feedback prescriptions. . There are 400000 particles (160000 stars and 240000 dark) per progenitor. A number of simulations with different pericenters and orbital parameters (initially marginally bound, parabolic, or a hyperbolic fly-by) were carried out for two mass ratios: 1:1 and 3:1. A variety of different viewing angles were chosen between face-on and edge-on (with respect to the orbital plane). The simulation output was recorded every 26 Myr. The simulations were used to construct artificial GEMS images; these were created by smoothing to GEMS resolution, re-binning to the appropriate angular diameter distance, and scaling to reproduce a given total luminosity of the remnant. The images were then added to real sky background from GEMS.
From examination of these simulated images (e.g., Fig. 1), some important points become clear. The morphological signatures of interactions between early-type galaxies are often very weak; tidal tails are broad with low surface brightness owing to the high velocity dispersion of the progenitor. Furthermore, there are nearly order-of-magnitude variations in overall merger timescales (i.e., the time from first pass to final coalescence), which depend sensitively on parameters such as mass ratio, pericenter distance and orbit. Importantly, however, the timescale over which one can recognize tidal features in dry mergers is largely independent of these parameters, and is comparable with the galaxies’ internal dynamical times. Tidal features of sufficient strength to be detected in our images occur only when the galaxies are very close together — typically between the last close pass prior to coalescence and coalescence itself333In simulations with small pericenter distances tidal features are visible for a short time after first pass, but become rapidly too weak to observe.. Orientation plays a role: interactions viewed nearly parallel to the orbital plane are visible as very close pairs for 2–3 times longer than the same interactions viewed from ° from face-on.
In order to estimate timescales over which GEMS-depth data will be sensitive to dry mergers, we explored the visibility of a wide range of early-type galaxy interactions at a number of redshifts, and assuming a range in final merger remnant luminosity. Preliminary explorations showed that luminous dry mergers at are visible only as a very close pair (timescales Myr, except for rare projections along the orbital plane); the data lack sufficient depth to robustly detect tidal features. Accordingly, we limit this study to galaxies and simulations.
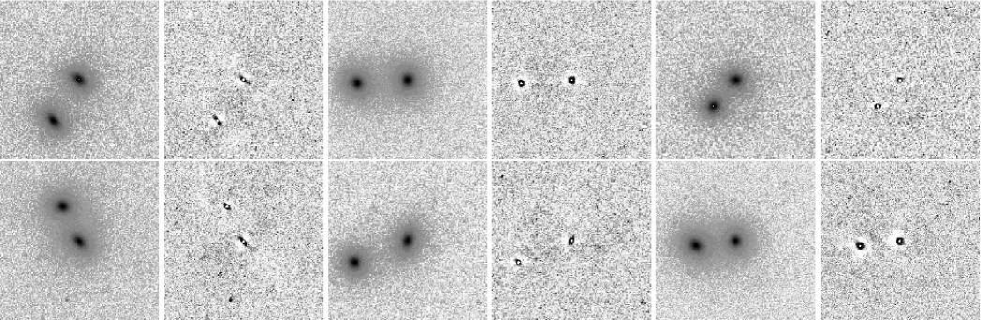
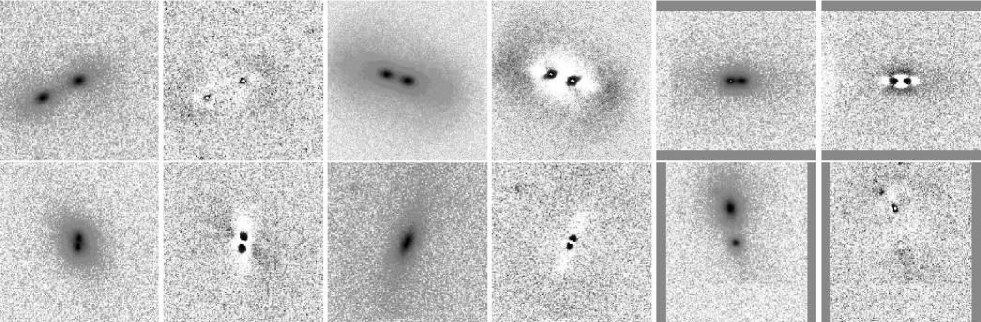
Simulation snapshots were selected randomly from a variety of interaction sequences; the only selection criterion applied was that the nuclei of the galaxies should be separated by kpc (this is an analogous selection to that applied to the data). A total of 174 snapshots from 15 simulations with different mass ratios (1:1 and 3:1), orbital parameters (marginally bound, parabolic, and a hyperbolic fly-by) and viewing angles (viewing angles from 0 from the normal to the orbital plane, 30, 60, 80, and the edge-on 90 orientation) met this separation criterion444Only one of the fly-by snapshots had separation kpc, reflecting the rapidity of fly-bys.. The random selection was weighted to ensure that the different viewing angles were selected approximately uniformly, in terms of solid angle. Given that a simulation snapshot is created every 26 Myr, this implies that the simulations have two distinct nuclei separated by kpc for on average 300 Myr. The snapshots were scaled to a range of luminosities and redshifts 555The redshifts were drawn from a uniform deviate in terms of volume, not redshift, and are therefore weighted towards higher redshift in exactly the same way as the observational dataset (the average redshift of the simulations was 0.53, whereas that of the observational dataset is 0.5)., and a subsample of 25 snapshots were SExtracted666Some very close pairs were deemed to be one object by SExtractor and were therefore fit with a single Sérsic profile., GALFITted and classified by the five classifiers (EFB, TN, DHM, CW and SK) in exactly the same way as the data. The classification was blind: simulation snapshots were intermixed with real dry merger candidates from GEMS.
Systems were deemed to be not merging if 2 classifiers or fewer classified the system as a merger, possibly merging if 3 classifiers argued it was a merger, and merging if 4 or 5 classifiers decided it was a merging system. According to this scheme, 12/25 snapshots were deemed not to be merging and 13/25 were declared merging (there were no cases in which only 3 classifiers declared a system to be merging). Examples of each class are shown in Figs. 2 and 3. It is apparent that snapshots with very weak/nonexistent tidal features were typically classified as non-interacting, while snapshots with either i) kpc separation and/or ii) tidal distortions (tails or asymmetries) were classified as interacting. Accordingly, we assign a timescale of Myr over which dry mergers are both automatically selected (with separations kpc; timescales Myr) and visually classified as a merger (13/25 of the snapshots, plus associated counting uncertainties).
3.2 Selection of Dry Merger Candidates
The dry merger simulations indicated that dry merger identification is a well-posed problem with quantifiable selection effects for galaxies with and : at larger redshift and/or fainter limits tidal features are no longer easily visible in single-orbit depth HST/ACS imaging. Accordingly, we adopt as the parent sample the sample of red sequence galaxies with , , and — a sample of 468 galaxies. Galaxy morphologies were assigned by eye for these galaxies: see e.g., McIntosh et al. (2005), Wolf et al. (2005), or Bell et al. (2004b) for a description of the morphological typing criteria and for some examples from each type. A total of 379/468 galaxies are classified to have early morphological types, E/S0/Sa777Systems with small amounts of ongoing star formation in a weak disk component were allowed into the sample, as long as they were on the red sequence and their light distributions were dominated by a smooth bulge component.
Adopting the 468-galaxy red sequence and sample as the parent sample, we have selected all close pairs satisfying the following criteria: i) projected separation kpc, ii) a -band absolute magnitude difference of 1.5 mag or less (corresponding to a 4:1 luminosity ratio difference, our threshold for a major merger), iii) photometric redshift difference . Ten pairs were found with these properties.
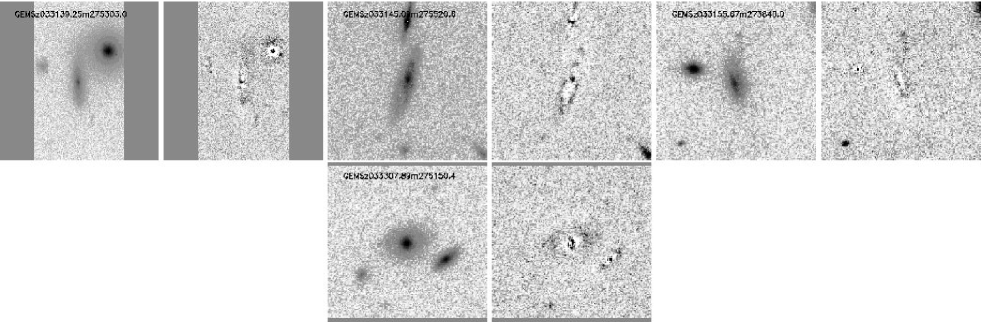
However, from the visual classifications there were a number of merging systems which were classified by COMBO-17 as one object. It is important to augment the sample of merger candidates with such blended mergers. Every one of the 468-galaxy parent sample has been fit using the GALFIT galaxy fitting code Peng et al. (2002) using a single Sérsic profile888The Sérsic (1968) model has a profile with surface brightness , where is the radius and is an index denoting how concentrated the light distribution of a given galaxy is: corresponds to an exponential light distribution, and corresponds to the well-known de Vaucouleurs profile.. A sample of 34 galaxies was automatically selected which had strong residuals from the Sérsic profile fit (within one half-light radius, the sum of the absolute values of the residuals exceeded % of the total flux within the half-light radius). The vast majority of these 34 systems were bulge/disk systems or had strong dust features and lanes: only 6 systems had evidence for multiple nuclei. These 6 systems were added to the sample of 10 COMBO-17-selected close galaxy pairs, forming the final sample of 16 dry merger candidates. Postage stamps and GALFIT residuals of all 16 candidates can be found in Figs. 4–7.
4 Results
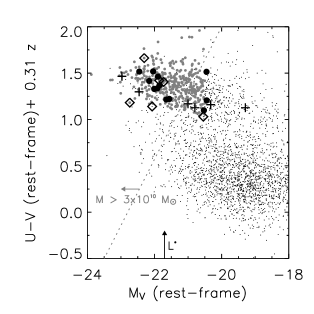
The 16 dry merger candidates were classified by the 5 classifiers (EFB, TN, DHM, CW and SK), with 4 different classification categories: (0) no evidence for an interaction, (1) possible merger, (2) dry merger, and (3) gas-rich merger. The results from all classifiers are given in Table 1. On the whole, agreement between the classifiers was good, and the galaxies separated reasonably cleanly into 4 subsamples: galaxies where the majority of classifiers felt that there was no evidence for merging (Fig. 4), systems where classification was uncertain (Fig. 5), gas-rich mergers (Fig. 6), and dry mergers (Fig. 7). A firm classification as a merging system required that 4 or 5 classifiers felt that a given system was a definite merger. A total of 6 systems were identified as dry mergers, three were identified as gas-rich mergers (these systems all had prominent bulge components and red colors), and 2 of the possible mergers could qualify as a dry merger as both components were bulge-dominated (GEMS 033123.29m274544.9 and GEMS 033313.59m275735.3). Fig. 8 shows the color-magnitude diagram of all galaxies from COMBO-17 (points), all red-sequence early-type galaxies (gray circles), and the merger candidates (black symbols, where symbol type denotes classification).
On this basis, it is possible to estimate the incidence of major mergers between luminous early-type galaxies from to the present day. Among the 379 red, early-type galaxies in GEMS with and , we find a total of 12 galaxies (6 pairs) that are strong dry major merger candidates. Classifications of dry merger simulation snapshots suggest that we will be able to recognize a dry merger for roughly an internal dynamical time, or approximately 150 Myr. Assuming a constant dry merger fraction over the 6.3 Gyr interval , an average, luminous early-type galaxy will undergo dry major merger (with mass ratios between 1:1 and 4:1). Yet, because there are only 6 merging pairs, we cannot strongly constrain the merger fraction evolution. The evolution of the merger fraction has been argued to evolve as rapidly as (e.g., Le Fèvre et al., 2000). If the dry merger fraction were to evolve similarly, an average luminous early-type galaxy will undergo major dry merger between and the present day. Obviously, our limited number statistics are currently a dominant source of uncertainty; nonetheless, our results indicate that dry merging plays an important role in shaping the properties of luminous early-type galaxies and building up the mass contributed by red-sequence galaxies since .
5 Discussion
5.1 Are our observations consistent with other observational constraints?
Is our suggestion that nearly every luminous early-type galaxy in the nearby universe has experienced a major gas-free merger since consistent with existing observational constraints? Dissipationless (gas-free) merging preserves the fundamental plane (e.g., Nipoti, Londrillo, & Ciotti, 2003; González-García & van Albada, 2003; Boylan-Kolchin, Ma & Quataert, 2005); therefore the thickness of the fundamental plane is not a strong constraint on the prevalence of dry merging. In contrast, simulations and models have demonstrated that dry merging will lead to scatter in the stellar mass–size relation (equivalently, the Kormendy relation; Nipoti, Londrillo, & Ciotti, 2003) and the color–magnitude relation (CMR; Bower, Kodama, & Terlevich, 1998). Observations of the evolution and scatter of these scaling relations limit the amount of dry merging to around a factor of two increase in mass since (McIntosh et al., 2005; Bower, Kodama, & Terlevich, 1998)999The CMR limit applies since the epoch when the CMR was imprinted on the early-type galaxy population.. A similar limit is derived from the stellar mass evacuated from the cores of luminous elliptical galaxies by their merging black holes in the absence of gas (Graham, 2004).
5.2 Comparison with previous measurements of merger fraction
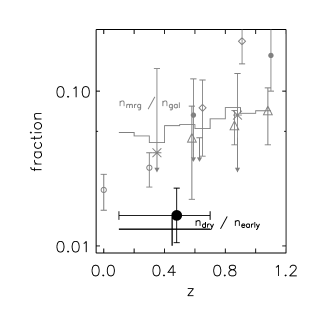
It is interesting to compare our results with previous observational estimates of the overall galaxy merger fraction. In Fig. 9, we show the dry merger fraction (black solid point) of red early-type galaxies, along with the fraction of galaxies in close pairs with kpc separation taken from Le Fèvre et al. (2000, open diamonds) and Patton et al. (2002, open circles). The results for Lin et al. (2005) are shown as triangles (separations between 10 and 30 kpc; ). Bundy et al. (2004) argued that many close pairs with nearly equal optical magnitudes were minor mergers where the satellite galaxies had boosted optical flux from tidally-induced bursts of star formation; they used near-infrared photometry to estimate the major merger fraction (crosses, and the upper limit at ). The solid circles denote the merger fraction of galaxies, inferred using morphological disturbance as an indicator of past merging activity (Conselice et al., 2003).
It is clear that the dry merger fraction is lower than the general merger fraction. A number of factors may contribute to this reduction. Close pairs and morphologically-selected gas-rich mergers are expected to be visible for a timescale Gyr (Le Fèvre et al., 2000; Patton et al., 2002; Conselice et al., 2003), whereas dry mergers are visible for Myr. Episodes of star formation in gas-rich mergers will increase the brightness of the merging galaxies, increasing their prominence relative to the star formation-free dry mergers. Finally, gas-rich galaxies tend to inhabit lower-density environments than gas-poor galaxies; this difference in environment will also affect the likelihood of a major merger.
5.3 Theoretical Expectations in a Hierarchical Universe
Do hierarchical models predict that dry mergers are an important mode of transformation and mass growth for luminous elliptical galaxies? To address this question, we make use of an updated version of the Somerville et al. semi-analytic galaxy formation model (see Somerville & Primack, 1999; Somerville, Primack, & Faber, 2001, for a description of the basic ingredients), based in the standard CDM paradigm of hierarchical structure formation. The models are based on Monte Carlo realizations of dark matter halo merger histories, constructed using the method described in Somerville & Kolatt (1999), and include fairly standard recipes treating gas cooling, star formation, and supernova feedback. The star formation rate is given by , where is the cold gas mass in the galaxy, is the dynamical time of the disk, and is a free parameter, which is adjusted to obtain agreement with observed gas fractions in spiral galaxies at the present day. We convolve the resulting star formation histories with the multi-metallicity stellar SED models of Bruzual & Charlot (2003), and include the effects of dust extinction using a simple relationship between face-on B-band optical depth and star formation rate (), based on the observational results of Wang & Heckman (1996, we assume ). Merging of galaxies (sub-structure) within virialized dark matter halos is tracked by computing the time it takes for a satellite galaxy to lose all of its orbital angular momentum via dynamical friction against the background of the dark matter halo, using the standard Chandrasekhar approximation. Mergers with mass ratio 1:4 or greater are assumed to result in a burst of star formation, and all pre-existing ’disk’ stars are transferred to a ’bulge’ component.
Earlier versions of this model, like many other models in the literature, had difficulty producing enough luminous red galaxies, particularly at high redshift (see, e.g., Somerville et al., 2004), and therefore could not produce a useful prediction of the merger rate for these systems. Somerville et al. (in prep.) find that introducing an ad hoc ‘quenching’ of star formation when the mass of the bulge component grows larger than leads to much improved agreement with the observed color distributions as a function of absolute magnitude, including the observed bimodality of the color distributions at –2. A full description of this model will be presented in this forthcoming work: at this stage, we argue that as the model approximately reproduces the global luminosity functions and observed number of red, early type galaxies at –1, it is at least a useful starting point to examine the overall merger rate and the dry merger rate.
In Fig. 9, we show the predicted fraction of galaxies that have experienced a major merger within the past 1 Gyr (the grey line; major mergers are defined as having mass ratios between 1:1 and 4:1). These predictions are derived from a mock light cone from covering a sky area of 1 sq. deg. (corresponding to about four times the volume of GEMS). Bearing in mind on one hand the difficulties of measuring galaxy merger rate from close pairs, and on the other hand uncertainties in physical prescriptions for dynamical friction, tidal stripping of galaxy halos, and tidally-induced star formation, the agreement between the model and observations is rather good. There is a hint that the model merger fraction decreases rather less rapidly than the observations; interestingly, this behavior is also seen in the semi-analytic models of Benson et al. (2002), as shown in Fig. 13 of Conselice et al. (2003).
The black naked error bar shows the dry merger fraction predicted by this model. We identify dry mergers in the model as galaxies with magnitudes , colors on the red sequence, and which have had a major merger in the past 150 Myr. The mock catalog has roughly four times the volume of GEMS; there are 13 merging systems from 982 early-type red sequence galaxies in this mock catalog in the interval . The inferred merger fraction is in excellent quantitative agreement with our observational determination (6 systems from 379 galaxies). This result lends further theoretical support to hydrodynamical studies of elliptical galaxy formation (Domínguez-Tenreiro, Sáiz, & Serna, 2004) and semi-analytic studies of galaxy clusters (Khochfar & Burkert, 2003), both of which argue that dry mergers are an important process in driving the buildup of massive early-type galaxies at recent times.
6 Conclusions
We have used the GEMS and COMBO-17 surveys in conjunction with -body and semi-analytic galaxy formation simulations to explore the frequency of gas-free major mergers between spheroid-dominated galaxies (dry mergers) since . We focused on this aspect of galaxy merging both because identifying gas-free mergers is less likely to be complicated by the effects of merger-induced star formation and the accompanying dust extinction, and because it can be modeled relatively straightforwardly (for similar reasons). The morphological signatures of such interactions were calibrated using mock GEMS-like images based on -body simulations, and include kpc separation of close nuclei and/or broad tidal tails and asymmetries. The simulations showed that such features are visible only for galaxies with in single-orbit HST F850LP data at ; higher-redshift galaxies show unobservably weak tidal features in the GEMS data. A total of 809 red-sequence galaxies were visually-inspected for morphological signatures of spheroid merging; 6 systems (12 galaxies) with luminosity ratios between 1:1 and 4:1 were found out of a total of 379 red sequence early-type galaxies with . The simulations suggest that morphological signatures of spheroid merging are visible for Myr; we therefore argue that an average early-type galaxy has experienced between 0.5 and 2 major spheroid mergers since . This merger frequency is consistent with limits of major gas-free merger at recent times, as derived from the color–magnitude and stellar mass–size relations, and from core mass deficits. We have compared this result with an updated semi-analytic model. This model reproduces the evolution of the number of luminous red early-type galaxies and the overall merger fraction reasonably well, and can therefore be used to obtain a plausible prediction of the frequency of dry mergers in a hierarchical universe. The predicted dry merger fraction is consistent with the observations to within their combined uncertainties. Thus, both observations and theory lend strong support to the notion that major spheroid mergers are an important driver of the evolution of luminous early-type galaxies in recent epochs.
Appendix A A. Are fly-bys important?
Tran et al. (2005) recently showed that all luminous dry merger candidates in the outskirts of the MS1054 galaxy cluster with sufficient S/N to measure velocity offsets were indeed bound kpc pairs (with velocity differences less than ). Noting that Tran et al. (2005) and van Dokkum et al. (1999) argue that most of these galaxies are in the cluster infall region (and therefore are in group environments which are about to be incorporated into the cluster proper), their study supports the notion that the majority of the dry merger candidates studied in this paper are bound and will likely merge.
Yet, one of the few published examples of an E–E interaction in the local universe (NGC 4782/4783) has been shown by Madejsky, Bender & Möllenhoff (1991) to have an unbound hyperbolic orbit. Based on simulated images from simulations of unbound dry mergers similar to those discussed in the main text, we find that morphological disturbances generated by fly-by interactions are short-lived, Myr for systems of a similar luminosity to the ones we observe here. Nonetheless, if the number of fly-by interactions is much larger than the number of mergers, fly-bys could significantly contaminate a spheroid major merger sample.
Because galaxies with velocity differences greatly in excess of their internal velocity dispersion are extremely unlikely to merge, it is worth understanding the likely contribution of high-velocity fly-bys to tidally-disturbed spheroid-dominated systems in a cosmic-averaged sense. Relative velocity difference is a strong function of the velocity dispersion of the local environment. We explore the likelihood of producing a given tidal effect in different environments by adopting the impulse approximation. We wish to work out the number of interactions as a function of environment, characterized by the velocity dispersion of the local environment . The number of interactions , where is the number density of E/S0 galaxies and is the pericentric distance. The dependence of cross-section on velocity can be estimated by assuming that the relative velocity . In order to work out the cross-section for interaction producing a given displacement in stars as a function of , we note that tidal forces . Since interaction timescale , the displacement in stars . Thus, given a constant tidal displacement of stars , the impact parameter . The number of E/S0 galaxies can be estimated assuming a constant group stellar M/L; . Since and , alone; we assume for simplicity . Thus, . To estimate the fraction of galaxies with this given displacement of stars owing to tidal affects, , one divides by the total number of E/S0 galaxies ; thus, . A cosmic-averaged fraction must be further weighted by the halo mass function of group and cluster-sized halos, . Thus, despite the dominance of E/S0 galaxies in clusters, the vast majority of tidally-disturbed spheroid-dominated galaxies are in the lowest velocity-dispersion groups capable of hosting E/S0 galaxies, and are therefore likely to merge.
A complementary analysis following Makino & Hut (1997), asking what the average environment of spheroid mergers should be (using the scalings above), comes to a similar conclusion: , and weighting by the mass function of groups and clusters, the cosmic-averaged fraction is again completely dominated by low-speed E/S0 mergers in low-mass groups.
References
- Barnes (2002) Barnes, J. E. 2002, MNRAS, 333, 481
- Barnes & Hernquist (1996) Barnes, J. E., & Hernquist, L. 1996, ApJ, 471, 115
- Bell et al. (2004a) Bell, E. F., et al. 2004a, ApJ, 608, 752
- Bell et al. (2004b) Bell, E. F., et al. 2004b, ApJ, 600, L11
- Bender (1988) Bender, R. 1988, A&A, 202, L5
- Bendo & Barnes (2000) Bendo, G. J., & Barnes, J. E. 2000, MNRAS, 316, 315
- Benson et al. (2002) Benson, A. J., Lacey, C. G., Baugh, C. M., Cole, S., & Frenk, C. S. 2002, MNRAS, 333, 156
- Bower, Kodama, & Terlevich (1998) Bower, R. G., Kodama, T., & Terlevich, A. 1998, MNRAS, 299, 1193
- Boylan-Kolchin, Ma & Quataert (2005) Boylan-Kolchin, M., Ma, C.-P., & Quataert, E. 2005, MNRAS, 362, 184
- Bruzual & Charlot (2003) Bruzual, G. & Charlot, S. 2003, MNRAS, 344, 1000
- Bundy et al. (2004) Bundy, K., Fukugita, M., Ellis, R. S., Kodama, T., & Conselice, C. J., 2004, ApJ, 601, L123
- Chen et al. (2003) Chen, H.-W., et al. 2003, ApJ, 586, 745
- Conselice et al. (2003) Conselice, C. J., Bershady, M., Dickinson, M., & Papovich, C. 2003, AJ, 126, 1183
- Conselice et al. (2005) Conselice, C. J., Blackburne, J. A., & Papovich, C. 2005, ApJ, 620, 564
- Cross et al. (2004) Cross, N. J. G., et al. 2004, AJ, 128, 1990
- de Lucia et al. (2004a) de Lucia, G., et al. 2004a, ApJ, 610, L77
- de Lucia et al. (2004b) de Lucia, G., Kauffmann, G., & White, S. D. M. 2004b, MNRAS, 349, 1101
- Domínguez-Tenreiro, Sáiz, & Serna (2004) Domínguez-Tenreiro, R., Sáiz, A., & Serna, A. 2004, ApJ, 611, L5
- Drory et al. (2004) Drory, N., Bender, R., Feulner, G., Hopp, U., Maraston, C., Snigula, J., & Hill, G. J. 2004, ApJ, 608, 742
- Faber et al. (1997) Faber, S. M., et al. 1997, AJ, 114, 1771
- Faber et al. (2005) Faber, S. M., et al. 2005, submitted to ApJ (astro-ph/0506044)
- Ford et al. (2003) Ford, H., et al. 2003, SPIE, 4854, 81
- Giavalisco et al. (2003) Giavalisco, M., et al. 2003, ApJ, 600, L93
- González-García & van Albada (2003) González-García, A. C., & van Albada, T. S. 2003, MNRAS, 342, L36
- Graham (2004) Graham, A. 2004, ApJ, 613, L33
- Khochfar & Burkert (2003) Khochfar, S., & Burkert, A. 2003, ApJ, 597, L117
- Khochfar & Burkert (2005) Khochfar, S., & Burkert, A. 2005, MNRAS, 359, 1379
- Kodama et al. (2004) Kodama, T., et al. 2004, MNRAS, 350, 1005
- Kormendy & Bender (1996) Kormendy, J., & Bender, R. 1996, ApJ, 464, L119
- Kroupa (2001) Kroupa, P. 2001, MNRAS, 322, 231
- Kuntschner (2000) Kuntschner, H. 2000, MNRAS, 315, 184
- Lauer et al. (1995) Lauer, T. R., et al. 1995, AJ, 110, 2622
- Le Fèvre et al. (2000) Le Fèvre, et al. 2000, MNRAS, 311, 565
- Le Fèvre et al. (2004) Le Fèvre, et al. 2004, A&A, 428, 1043
- Lin et al. (2005) Lin, L., et al. 2005, ApJ, 671, L9
- Madejsky, Bender & Möllenhoff (1991) Madejsky, R., Bender, R., & Möllenhoff, C. 1991, A&A, 242, 58
- Makino & Hut (1997) Makino, J., & Hut, P. 1997, ApJ, 481, 83
- McIntosh et al. (2005) McIntosh, D. H., et al. 2005, ApJ, 632, 191
- Melbourne et al. (2005) Melbourne, J., et al. 2005, ApJ, 625, L27
- Naab & Burkert (2001) Naab, T., & Burkert, A. 2001, in The Central Kiloparsec of Starbursts and AGN: The La Palma Connection, eds. J. H. Knapen, J. E. Beckman, I. Shlosman, and T. J. Mahoney. ASP conference proceedings v. 249, 735 (San Francisco: Astronomical Society of the Pacific)
- Naab & Burkert (2003) Naab, T., & Burkert, A. 2003, ApJ, 597, 893
- Naab, Burkert, & Hernquist (1999) Naab, T., Burkert, A., & Hernquist, L. 1999, ApJ, 523, L133
- Naab, Khochfar, & Burkert (2006) Naab, T., Khochfar, S., & Burkert, A. 2005, submitted to ApJ Letters (astro-ph/0509667)
- Nipoti, Londrillo, & Ciotti (2003) Nipoti, C., Londrillo, P., & Ciotti, L. 2003, MNRAS, 342, 501
- Patton et al. (2002) Patton, D. R., et al. 2002, ApJ, 565, 208
- Peng et al. (2002) Peng, C. Y., Ho, L. C., Impey, C. D., & Rix, H.-W. 2002, AJ, 124, 266
- Rix et al. (2004) Rix, H.-W., et al. 2004, ApJS, 152, 163
- Saracco et al. (2005) Saracco, P., et al. 2005, MNRAS, 357, 40
- Schweizer & Seitzer (1992) Schweizer, F., & Seitzer, P. 1992, AJ, 104, 1039
- Sérsic (1968) Sérsic, J. L. 1968, Atlas de Galaxies Australes (Cordoba: Observatorio Astronomico)
- Somerville & Kolatt (1999) Somerville, R. S. & Kolatt, T. S. 1999, MNRAS, 305, 1
- Somerville & Primack (1999) Somerville, R. S., & Primack, J. R., 1999, MNRAS, 310, 1087
- Somerville, Primack, & Faber (2001) Somerville, R. S., Primack, J. R., & Faber, S. M. 2001, MNRAS, 320, 504
- Somerville et al. (2004) Somerville, R. S., et al. 2004, ApJ, 600, L135
- Thomas et al. (2005) Thomas, D., Maraston, C., Bender, R., & Mendes de Oliveira, C. 2005, ApJ, 621, 673
- Trager et al. (2000) Trager, S. C., Faber, S. M., Worthey, G., & González, J. J. 2000, AJ, 120, 165
- Tran et al. (2005) Tran, K.-V. H., van Dokkum, P., Franx, M., Illingworth, G. D., Kelson, D. D., & Förster Schreiber, N. M. 2005, ApJ, 627, L25
- Toomre & Toomre (1972) Toomre, A., & Toomre, J. 1972, ApJ, 178, 623
- van der Wel et al. (2004) van der Wel, A., Franx, M., van Dokkum, P. G., & Rix, H.-W. 2004, ApJ, 601, L5
- van Dokkum et al. (1999) van Dokkum, P. G., Franx, M., Fabricant, D., Kelson, D. D., & Illingworth, G. D. 1999, ApJ, 520, L95
- Wang & Heckman (1996) Wang, B. & Heckman, T. 1996, ApJ, 457, 645
- Wolf et al. (2004) Wolf, C., et al. 2004, A&A, 421, 913
- Wolf et al. (2005) Wolf, C., et al. 2005, ApJ, 630, 771