Red clump distances to the inner Galactic structures
Abstract
The least well known structure of the Galaxy is its central region, because of the high extinction, the crowding and the confusion between disk and bulge sources along the line of sight. We show how the structure of the inner Galaxy and the dust distribution can be strongly constrained by using red clump stars as distance indicator. The results of this method applied on the deep near-infrared survey of the inner Galactic bulge made with the Cambridge Infrared Survey Instrument (CIRSI) are presented.
1 Institute of Astronomy, University of Cambridge, Cambridge, CB30HA, UK
2 Institut d’Astronomie et d’Astrophysique, Université Libre de Bruxelles,
B-1050 Bruxelles
1. Introduction
The study of the Milky Way Galaxy offers a unique opportunity for understanding the complexity of galaxy formation and evolution. However our point of view from within the Galactic disk has its drawbacks when trying to obtain large scale properties of the Galaxy, and in particular of its central region. The high interstellar extinction, the crowding and the confusion between foreground disk stars and bulge sources complicates the studies of the inner Galactic regions. We would like to know how the bulge formed and evolved, what is it link with the disk and the halo. But we still doesn’t know the shape of the bulge. We still can’t say what the Milky Way looks like from the outside.
The central region of the Galaxy has been subject to many studies in the past few years, thanks to technology developments allowing wider and deeper multi-wavelength surveys. There is now substantial evidence for the presence of a triaxial structure in the inner Galaxy. Those evidences mainly come from gas kinematics, infrared luminosity distribution, star counts, and since recently, red clump stars. There is general agreement that the near end of this triaxility is in the first quadrant, however the values given for its orientation with respect to the Sun-Galactic center line range from 10∘ to 45∘ and can be interpreted either as a triaxial bulge or a bulge plus a bar.
To disentangle the different structures that may be present in the inner Galaxy, distance estimators are needed. Red clump stars are well known distance indicators thanks to their bright and narrow luminosity distribution. They were first used to constrain the Galactic bar structure by the OGLE team (Stanek et al. 1994, Stanek et al. 1997), followed very recently by Babusiaux & Gilmore (2005) and Nishiyama et al. (2005). We present here this method with its application to the CIRSI Galactic bulge survey of Babusiaux & Gilmore (2005).
2. The CIRSI Galactic bulge survey
The CIRSI Galactic bulge survey is a deep near-infrared survey of the bulge/bar in the Galactic plane. Fields have been selected at Galactic latitudes and Galactic longitudes and . A field at , has also been included as a calibration field of the expected asymmetry caused by the Galactic bar between positive and negative longitudes. The observations in the J, H and Ks were obtained with the Cambridge Infrared Survey Instrument (Beckett et al. 1997, Mackay et al. 2000) on the du Pont 2.5m telescope at Las Campanas Observatory. CIRSI is a mosaic imager with a pixel scale of 0.2 arcsec pixel-1, leading to a field of view of about 13 x 13 arcmin2. The magnitude limits are around J=20, H=18.5 and Ks=18 mag. The details of the observations and data reductions are presented in Babusiaux & Gilmore (2005).
3. Deriving the distances from red clump stars
3.1. The method
To counteract the effect of extinction, reddening-independent magnitudes can be derived using any two colors for a given extinction law, for example:
| (1) |
In the near-infrared, the extinction curve is well defined by a single power-law function (Cardelli et al. 1989). Unlike in optical studies where extinction law variations remain a source of possible systematic uncertainty (Udalski 2003, Sumi 2004), near-infrared reddening-independent magnitudes should not be significantly affected by variations of the interstellar medium properties along the different lines of sight. In the following we adopt = 0.64 from He et al. (1995).
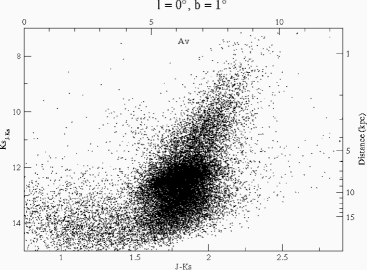
In a color magnitude diagram (CMD) made with a reddening-independent magnitude, the effect of distance and extinction are disentangled: a star of a given spectral type moves vertically with distance, horizontally with extinction. This is illustrated in figure 1, which is the color - reddening-independent magnitude diagram of the low-extinction minor axis bulge field at (, ). On this diagram the bulge red giant branch from a well-defined, almost single distance feature with a distinct red clump. The location of the red clump stars in this (, ) diagram is translated into an (, distance) estimate on the opposite axes of figure 1.
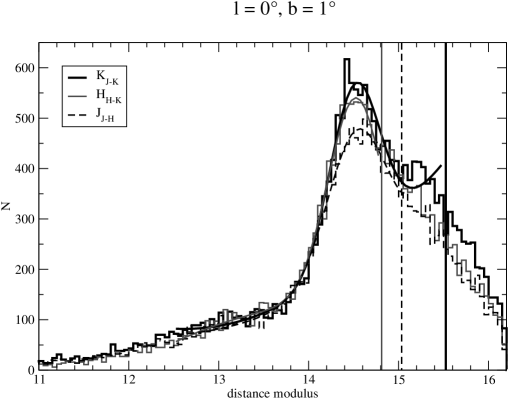
To quantify the distance estimate given by the red clump stars from CMDs like figure 1, a non-linear least-squares fit of function 2 to the histogram of reddening-independent magnitudes of red giant stars is applied, following Stanek & Garnavich (1998) and Salaris & Girardi (2002):
| (2) |
The Gaussian term represents a fit to the bulge/bar red clump. The first three terms describe a fit to the background distribution of non-bulge-clump red giant stars, which in our case contains not only the other bulge giants, but also the disk red clump stars that fall into the bulge red clump. This fit is illustrated in figure 2.
3.2. Calibration of the distances
To translate reddening-independent magnitudes into distance modulus estimates, the red clump absolute magnitude and colors need to be known. We used the red clump stars colors predicted by the Padova isochrones provided in the 2MASS system Bonatto et al. (2004) for a 10 Gyr population of solar metallicity: ()0=0.68 and ()0=0.07. We calibrated the absolute magnitude of the red clump using our bulge calibration field at (, ).
If we assume the absolute red clump distance of mag, derived by Alves (2000) for the Hipparcos red clump, we obtain a distance for the Galactic center of kpc. However according to Salaris & Girardi (2002), a small population correction should be applied to the Alves (2000) calibration for bulge stars. Using their population correction for Baade’s window with solar metallicity we derive mag and kpc, while with enhanced -elements it leads to mag and kpc. However if we assume -enhancement, we also have to change the assumed ()0, which leads us back to kpc. All those values are consistent with the latest Galactic center distance estimates (e.g. Reid 1993, McNamara et al. 2000, Eisenhauer et al. 2003) which give kpc. Considering the different uncertainties in the absolute magnitude of the red clump, we decided to calibrate this latter to mag, assuming a distance for the Galactic center of 8 kpc.
As we calibrated the absolute magnitude of the red clump on the bulge field at , our distance estimates should not depend on the population corrections suggested by Salaris & Girardi (2002). However this applies only if we assume that we are probing the same population in the different fields of the survey. A hint that this may not be the case is given by the fact that the fits of the reddening-independent magnitudes derived with our different colors do not perfectly match for the calibration field at if we assume colors derived for solar abundances, while the fits converge if we assume colors derived for -enhanced abundances (figure 2). On the opposite the fits match better for solar abundance colors for the other fields of the survey (figure 5 of Babusiaux & Gilmore 2005).
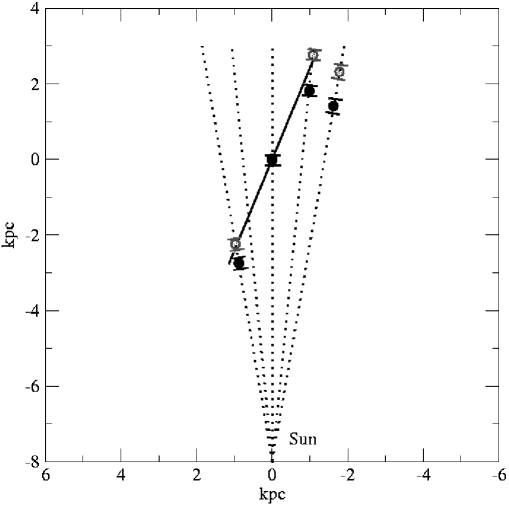
To illustrate the effect of systematics in the assumed stellar populations, figure 3 presents the distances estimated from the red clump stars with two different hypothesis. First we assume the same calibrations for all fields. Then we assume for the calibration bulge at a 10 Gyr old population with enhanced -element abundances (McWilliam & Rich 1994, Matteucci et al. 1999) and for the others, associated with a younger bar population, an age of 6 Gyr (Cole & Weinberg 2002) and solar abundances. The deduced distances of the second hypothesis show a better fit to a simple linear regression model for the Galactic bar structure. If confirmed by spectral observations, this implies a bar population which is formed from the inner disk and not from the old bulge.
4. Constraining the structure of the inner Galaxy
4.1. The asymmetric structure
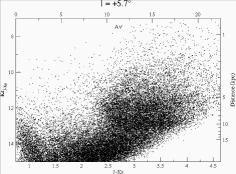
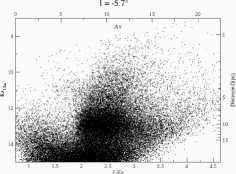
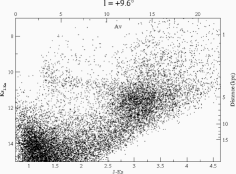
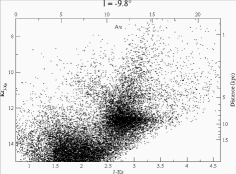
The color reddening-independent magnitude diagrams of our different survey fields show clear differences in the distribution of their stellar densities (figure 4). The derived spatial map is summarized in figure 5. The mean distances down each line of sight are represented as well as an indication of the distance range. This distance range corresponds to the measured 1 dispersion in distance modulus deconvolved from the intrinsic dispersion of the red clump luminosity and the photometric errors. This is only a qualitative estimation as the distribution in distance has no reason to be Gaussian. Furthermore, due to our observation angle our distance estimates are slightly biased towards larger distances. On the other hand those distance estimates are independent of any Galactic model.
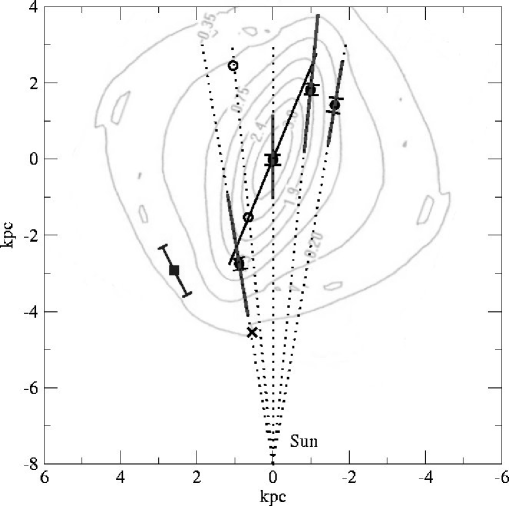
The mean red clump distances measured at and are consistent with the more recent bar models, particularly those derived considering both gas dynamics and available surface brightness luminosity distributions, and the model derived from the OGLE data by Stanek et al. (1997). Those models deduce a bar orientation with respect to the Sun-Galactic center direction of (e.g. Gerhard 2001, Merrifield 2004). The model of Bissantz & Gerhard (2002) (their figure 11) is overlaid on figure 5. This model assumes a bar with an angle , a length of 3.5 kpc and an axis ratio 10:3-4. Their is a good overall agreement with our direct distance determinations.
Our red clump distance derived at is however not simply consistent with the bar model described above. A single linear fit to the four mean distances measured at has all four points more than 3 from the ‘best fit’. Nishiyama et al. (2005) also find that a simple linear fit does not reproduce their data but their distance estimates are not coherent with ours and they still find a highly significant distance difference between and . To understand the discrepancy with Nishiyama et al. (2005) examinations of both CMDs are needed. The OGLE data also seem to infer that a flattening of the distances occurs around (figure 6 of Sumi 2004). Our feature observed at does seem real: inspection of figure 4 shows a clear overdensity of the whole red giant branch at the same distance as the mean clump distance, determined to be 9 kpc, in this field. Moreover, in this line of sight, the most likely source of distance bias, which is the presence of disk red clump stars, would bias the distance estimate towards larger distances, not shorter. On the opposite, this could have biased our distance estimate at . A possible physical interpretation to the fact that our red clump distances measured at and are equivalent is that we have detected the signature of the end of the bar. Star count peaks have also been detected in this region in studies of old OH/IR stars by Sevenster (1999) and in the DENIS star counts by López-Corredoira et al. (2001).
López-Corredoira et al. (2001) suggest that their local density maximum at may be related to the red clump overdensity detected by Hammersley et al. (2000) at . The Hammersley et al. (2000) density maximum is indicated in figure 5 by a square. The presence of these two local features at and and their mean red clump distance estimates could imply the presence of a double triaxiality in the inner Galaxy, a double bar, or a triaxial bulge oriented at with a longer, thiner bar oriented at . However, if such a second structure did exist, we should have detected its signature in our other survey fields. No such complex signature is evident (cf. figure 4). If two complex spatial distributions were projected down our lines of sight without being resolved, this would imply that our distance determinations are biased so that the angle of the first structure is in fact smaller than the 22∘ we measured, and that the spread of the red clump distances observed down each line of sight would encompass both structures. The latter does not seem to correspond to the rather small distance dispersions we derived. Furthermore, Picaud et al. (2003) do not detect a density excess at , confirming that the structure seen at could be local and unrelated to the larger bulge or bar.
An alternative, and perhaps more consistent, interpretation of the structure we observe is the presence of a stellar ring or pseudo-ring at the end of the Galactic bar. If so, the bar and the stellar ring would have a radius of 2.30.25 kpc. Our observations at indicate that the radius of the bar is at least 2.70.2 kpc long. Those two determinations are consistent within 1. We note that assuming the bulge/bar stellar population differences used for figure 3 leads to a larger bar radius of about 3 kpc. A bar radius of about 2.5 kpc would agree with the model of Lépine & Leroy (2000) and Sevenster (1999), but is smaller than the value indicated by Gerhard (2001) in his review. The presence of a ring has been suspected by several authors. A molecular ring at about 4-5 kpc is a well known feature deduced from CO maps. Comeron & Torra (1996) link their derived distribution of ultracompact HII regions to the molecular ring, but also detect a star forming ring at about 2 kpc from the Galactic centre. A stellar ring was suspected to lie at 3.5 kpc from the Galactic centre by Bertelli et al. (1995). From an OH/IR star study Sevenster (1999) suggests that an inner ring lies between between 2.2 and 3.5 kpc. From star counts in the DENIS survey López-Corredoira et al. (2001) also argue for the presence of a stellar ring, mainly from the detection of a density peak at that, following Sevenster (1999), they associate with the tangential point to the 3-kpc arm, which is likely to be a (pseudo-)ring. The presence of a Galactic ring would also help to reproduce the observed microlensing optical depth (Sevenster & Kalnajs 2001).
4.2. The line of sight towards
The reddening-independent colour-magnitude diagram for the line of sight towards (figure 4) differs significantly from those in other directions, in that the red clump stars indicate a very considerable range of distances, with no clear local maximum density. The broad apparent distance distribution observed for the red clump stars at could be explained by the presence of two features, one at 6 kpc and a second at 11 kpc. The first distance range is consistent with the bar structure confirmed above. It is also consistent with the fact that the OGLE data of Stanek et al. (1994), observed at a lower latitude of , show similar photometric behaviour at compared to , except for the expected shift in distance modulus.
The fainter feature in our low-latitude data could then be due to another structure, further away. This feature could be due to disk red clump stars. Indeed with increasing distance both the volume observed and the extinction increase, and considering the logarithmic relation between distance and magnitude, any distant red clump stars visible would concentrate in the high-extinction high distance-modulus bottom-right part of the CMD. Deeper data than we have available are then needed to determine if we are indeed seeing the distant disk beyond the bulge or a local structure which could be associated with the ring. This region is also interesting for further study as a broad velocity-width molecular clump has been detected at (e.g. Boyce & Cohen 1994, Bitran et al. 1997, Dame et al. 2001), which may be a manifestation of gas shocks (Kumar & Riffert 1997, Fux 1999). An estimate of the distance of those two structures, if the fainter one is real and indeed a local maximum, is presented in figure 5 as the open circles.
4.3. The dust distribution
The red clump star locus on the color reddening independent magnitude diagrams allows to quantify the distribution of the extinction along the line of sight. For example, at a clear flattening of the disk red clump distribution at indicates the presence of a specific source of extinction located at about 3.5 kpc from the Sun, which increases by about 7.5 mag in only 1.5 kpc. This feature is consistent with the steep increase in absorption at 3.4-4 kpc seen at =12.9∘ by Bertelli et al. (1995), that they associated with the molecular ring. It is indicated by a cross in figure 5.
In all our Galactic plane fields, the bulk of bulge red clump stars becomes visible at mag, and apparently suffer a range of internal extinction of more than mag. López-Corredoira et al. (2001) detect an asymmetry in the Galactic plane extinction distribution, with more extinction at negative than at positive longitudes. We do not confirm this result. The fact that we do not find any asymmetry in the extinction of red clump stars between positive and negative longitudes (figure 4), while there is an asymmetry in distance, is certainly consistent with a minimum in the dust distribution in this region. Interior of the bar outer radius a lower global density of stars and gas is often seen in observations of other galaxies. Several authors have suggested that such a stellar density decrease may be present in the Galactic disk (Binney et al. 1991, Bertelli et al. 1995, Freudenreich 1998, Lépine & Leroy 2000, López-Corredoira et al. 2004). Our observations are consistent with such a decrease in the dust distribution of the inner disk.
Another interesting feature often observed in barred galaxies is the presence of dust lanes associated with the bar. From DIRBE surface brightness maps, Calbet et al. (1996) suggested the presence of such a thick dust lane, preceding the Galactic bar in its rotation. They estimate the extra absorption present at negative longitudes to be between 1 and 2.6 mag in K. The presence of such a feature is clearly ruled out by our observations.
5. Conclusion
Red clump stars are very powerfull distance indicators to the inner Galactic structures. Colour - reddening-independent magnitude diagrams have been shown to disentangle the effects of distance and extinction, allowing a direct conversion of red clump star photometry (,) into an (,distance) estimate. The use of the near-infrared allows to observe red clump stars within the Galactic plane, where the extinction is too high for optical studies, and provides reddening-independent magnitudes that are not influenced by variations of the ISM properties between the different lines of sights. Warnings should however be raised for contamination by disk red clump stars and differencial effects of population corrections.
This method have been applied to the CIRSI Galactic bulge survey and produced the following main results:
-
-
The presence of a triaxial structure at the centre of our Galaxy is confirmed. Its angle relative to the Sun-Galactic centre line is ∘. It extends to at least 2.5 kpc from the Galactic Centre. A large axis ratio is excluded, but our data are consistent with a 10:3-4 ratio. In particular the distance dispersion of the bulge along the (, ) line of sight is less than 1 kpc.
-
-
A structure present at is not aligned with this triaxiality. We suggest that the structure present at is likely to be the signature of the end of the Galactic bar, which is therefore circumscribed by an inner pseudo-ring.
-
-
A decrease in the dust distribution inside the bar radius is inferred from the extinction distribution in our fields.
-
-
Our observations are not consistent with the existence of the dust lane preceding the Galactic bar at negative longitudes suggested by Calbet et al. (1996).
References
- Alves (2000) Alves D. R., 2000, ApJ, 539, 732
- Babusiaux & Gilmore (2005) Babusiaux C., Gilmore G., 2005, MNRAS, 358, 1309
- Beckett et al. (1997) Beckett M. G., Mackay C. D., McMahon R. G., et al., 1997, CIRSI: the Cambridge Infrared Survey Instrument, in Proc. SPIE Vol. 2871, p. 1152-1159, Optical Telescopes of Today and Tomorrow, Arne L. Ardeberg; Ed., p. 1152
- Bertelli et al. (1995) Bertelli G., Bressan A., Chiosi C., Ng Y. K., Ortolani S., 1995, A&A, 301, 381
- Binney et al. (1991) Binney J., Gerhard O. E., Stark A. A., Bally J., Uchida K. I., 1991, MNRAS, 252, 210
- Bissantz & Gerhard (2002) Bissantz N., Gerhard O., 2002, MNRAS, 330, 591
- Bitran et al. (1997) Bitran M., Alvarez H., Bronfman L., May J., Thaddeus P., 1997, A&AS, 125, 99
- Bonatto et al. (2004) Bonatto C., Bica E., Girardi L., 2004, A&A, 415, 571
- Boyce & Cohen (1994) Boyce P. J., Cohen R. J., 1994, A&AS, 107, 563
- Calbet et al. (1996) Calbet X., Mahoney T., Hammersley P. L., Garzon F., Lopez-Corredoira M., 1996, ApJ, 457, L27
- Cardelli et al. (1989) Cardelli J. A., Clayton G. C., Mathis J. S., 1989, ApJ, 345, 245
- Cole & Weinberg (2002) Cole A. A., Weinberg M. D., 2002, ApJ, 574, L43
- Comeron & Torra (1996) Comeron F., Torra J., 1996, A&A, 314, 776
- Dame et al. (2001) Dame T. M., Hartmann D., Thaddeus P., 2001, ApJ, 547, 792
- Eisenhauer et al. (2003) Eisenhauer F., Schödel R., Genzel R., et al., 2003, ApJ, 597, L121
- Freudenreich (1998) Freudenreich H. T., 1998, ApJ, 492, 495
- Fux (1999) Fux R., 1999, A&A, 345, 787
- Gerhard (2001) Gerhard O. E., 2001, Structure and Mass Distribution of the Milky Way Bulge and Disk, in ASP Conf. Ser. 230: Galaxy Disks and Disk Galaxies, p. 21
- Hammersley et al. (2000) Hammersley P. L., Garzón F., Mahoney T. J., López-Corredoira M., Torres M. A. P., 2000, MNRAS, 317, L45
- He et al. (1995) He L., Whittet D. C. B., Kilkenny D., Spencer J ones J. H., 1995, ApJS, 101, 335
- Kumar & Riffert (1997) Kumar P., Riffert H., 1997, MNRAS, 292, 871
- Lépine & Leroy (2000) Lépine J. R. D., Leroy P., 2000, MNRAS, 313, 263
- López-Corredoira et al. (2004) López-Corredoira M., Cabrera-Lavers A., Gerhard O. E., Garzón F., 2004, A&A, 421, 953
- López-Corredoira et al. (2001) López-Corredoira M., Hammersley P. L., Garzón F., et al., 2001, A&A, 373, 139
- Mackay et al. (2000) Mackay C. D., McMahon R. G., Beckett M. G., et al., 2000, CIRSI: the Cambridge infrared survey instrument for wide-field astronomy, in Proc. SPIE Vol. 4008, p. 1317-1324, Optical and IR Telescope Instrumentation and Detectors, Masanori Iye; Alan F. Moorwood; Eds., p. 1317
- Matteucci et al. (1999) Matteucci F., Romano D., Molaro P., 1999, A&A, 341, 458
- McNamara et al. (2000) McNamara D. H., Madsen J. B., Barnes J., Ericksen B. F., 2000, PASP, 112, 202
- McWilliam & Rich (1994) McWilliam A., Rich R. M., 1994, ApJS, 91, 749
- Merrifield (2004) Merrifield M. R., 2004, The Galactic Bar, in ASP Conf. Ser. 317: Milky Way Surveys: The Structure and Evolution of our Galaxy, p. 289
- Nishiyama et al. (2005) Nishiyama S., Nagata T., Baba D., et al., 2005, ApJ, 621, L105
- Picaud et al. (2003) Picaud S., Cabrera-Lavers A., Garzón F., 2003, A&A, 408, 141
- Reid (1993) Reid M. J., 1993, ARA&A, 31, 345
- Salaris & Girardi (2002) Salaris M., Girardi L., 2002, MNRAS, 337, 332
- Sevenster (1999) Sevenster M. N., 1999, MNRAS, 310, 629
- Sevenster & Kalnajs (2001) Sevenster M. N., Kalnajs A. J., 2001, AJ, 122, 885
- Stanek & Garnavich (1998) Stanek K. Z., Garnavich P. M., 1998, ApJ, 503, L131
- Stanek et al. (1994) Stanek K. Z., Mateo M., Udalski A., et al., 1994, ApJ, 429, L73
- Stanek et al. (1997) Stanek K. Z., Udalski A., Szymanski M., et al., 1997, ApJ, 477, 163
- Sumi (2004) Sumi T., 2004, MNRAS, 349, 193
- Udalski (2003) Udalski A., 2003, ApJ, 590, 284