Near-Infrared water lines in V838 Monocerotis
Abstract
V838 Monocerotis had an intriguing, nova-like outburst in January 2002 which has subsequently led to several studies of the object. It is now recognized that the outburst of V838 Mon and its evolution are different from that of a classical nova or other classes of well-known eruptive variables. V838 Mon, along with two other objects that have analogous properties, appears to comprise a new class of eruptive variables. There are limited infrared studies of V838 Mon. Here, we present near-infrared band (1.5 - 1.75m) spectra of V838 Mon from late 2002 to the end of 2004. The principal, new result from our work is the detection of several, rotation-vibration lines of water in the band spectra. The observed water lines have been modeled to first establish that they are indeed due to water. Subsequently the temperature and column densities of the absorbing material, from where the water absorption features originate, are derived. From our analysis, we find that the water features arise from a cool 750-900 K region around V838 Mon which appears to be gradually cooling with time.
1 Introduction
Water vapor is the most important gas phase molecule in astrophysical environments after H2 and CO. It is an abundant molecule in the atmospheres of cool, oxygen rich (O/C 1) stars and it constitutes the major opacity source in the infrared in such stars. The detection of water vapor, through clearly identified spectral lines, whilst not a common event has been made in a variety of sources. Some of the previous detections are in the photospheres of K and M giants/supergiants (e.g. Ori and Sco - Jennings Sada 1998; Boo - Ryde et al. 2002; Tau and other stars - Tsuji, 2001); in sunspots (Wallace et al. 1995, Polyansky et al. 1997); in young stellar objects (Carr, Tokunaga Najita 2004) and in comets (Crovisier et al.1997, Dello Russo et al. 2005 ). Detection in other sources such as Herbig-Haro objects, star forming regions, planetary atmospheres and in outflows from evolved stars like VY CMa are described in Neufeld et al (1999; and references therein). From a survey of the literature, it appears that the detection of water lines in novae or nova-like variables is either rare or has not been made earlier. Most of the water detections described above are in the infrared region at wavelengths beyond the band (i.e. beyond 2.4 m). Several of them have been made by the Infrared Space Observatory (ISO) from spectra obtained in the 2.48-40 m region. In the (1.0 to 2.4 m) region or its vicinity, there are limited reports of water line detections. In this context we note the detection by Spinrad and Newburn (1965) of a water band at 9400A in the spectra of cool M type stars and also the detection of water bands in the Mira variable R Leo by Hinkle and Barnes (1979) from high-resolution spectra.
V838 Mon was reported in eruption on 2002 January 6 by Brown (2002). This initial outburst had a peak magnitude of Vmax = 10. Subsequent observations showed two more outbursts in the object (reaching a Vmax of 6.7 and 7 respectively) within the next two months. V838 Mon also showed a fast cooling to a cool, late M spectral type. The multi-peaked lightcurve and the decrease of the effective temperature with time suggested that the object was different from a classical nova. The early photometric and spectroscopic observations are described in Munari et al. (2002), Kimeswenger et al. 2002), Crause et al. (2003) and Wisniewski et al. (2003). An expanding light-echo was also seen around the star (Henden, Munari Schwartz 2002, Bond et al. 2003). Estimates based on the expanding light echo, suggest that the object is at a large distance, in the 8-10 kpc range (Tylenda 2004, Crause et al. 2005, van Loon et al. 2004). There is some debate about whether the scattering medium causing the light echo is an interstellar sheet of dust in the line of sight or matter lost in an earlier episode from the progenitor of V838 Mon - which would thereby imply it to be an evolved red giant or AGB star (van Loon et al. 2004; Tylenda, Soker Szczerba 2005). Several suggestions have been made, that V838 Mon has similar properties as V4332 Sgr and M31-RV (two other objects which have erupted in the last 10-15 years) and that these objects taken together could form a new class of eruptive variables. Our recent results on V4332 Sgr certainly show it to be an unusual object (Banerjee Ashok 2004, Banerjee et al. 2004). Since the outburst properties of V838 Mon are different from known eruptive variables, new mechanisms have been proposed for the outburst in such objects. Soker Tylenda (2003) propose a merger between main sequence stars while Retter Marom (2003) suggest a planetary capture for the eruption. In the case of V4332Sgr specifically, observations suggest (Banerjee et al., 2004) that the second mechanism could be plausible. V838 Mon has been the subject of several other studies viz. polarization studies (Desidera et al. 2004, Wisniewski, Bjorkman Magalhaes 2003), elemental abundance determinations (Kipper et al. 2004, Kaminsky Pavlenko 2005), interferometric measurements to determine the size of the object (Lane et al. 2005) and investigations of the progenitor of V838 Mon (Munari et al. 2005, Tylenda et al. 2005). However many aspects of V838 Mon still remain unclear, including the definitive cause for its eruption.
There are two studies of V838 Mon in the infrared which are specially relevant to the present work. Evans at al. (2003), based on an IR spectrum obtained in October 2002 in the 0.8-2.5m region, showed that the spectrum of V838 Mon has similarities to a cool L type dwarf. Lynch et al (2004), using multi-epoch IR spectra between January 2002 to March 2003, computed a detailed model of V838 Mon and its circumstellar environment. Their model indicates a cool central star with a photospheric temperature of 2100 K surrounded by a large, spherical envelope of molecular matter at 750-800 K. In both these studies, the authors point out the presence of water in V838 Mon (see Figs. 1 2 in Evans et al. 2003 and Figs. 6 7 in Lynch et al. 2004). In these figures, the presence of water is indicated through the wide and deep absorption troughs seen between the spectral bands e.g at 1.4 m between bands and at 1.9m between the bands. Such inter-band, water features are well known and commonly observed in cool M stars (e.g. see the IR catalog of stellar spectra by Lancon and Rocca-Volmerange 1992) and also in brown dwarfs (e.g. the spectral catalog by Geballe et al.2002). In addition, Figure 12 of Lynch et al. (2004) shows water lines in the band in both their model and observed data. However, the studies by Evans et al. (2004) and Lynch et al. (2004) do not identify and label specific water lines as we do here. Furthermore, our spectra extend to late 2004, beyond the observations reported in the above studies.
2 Observations
Since its outburst in early 2002, near-IR spectra of V838 Mon have been taken, until the present day, at approximately bi-monthly intervals from the 1.2m telescope at the Mt. Abu Observatory. Observations from mid-June to early October are not possible due to the rainy season. Spectra early after the outburst until May 2002) are presented in Banerjee Ashok (2002). The band spectra presented here cover the period from end-2002 to end-2004 and are taken at fairly equi-spaced epochs - they are thus suitable to study the evolution of the object. The present spectra, like those of our earlier study, were obtained at a resolution of 1000 using a Near Infrared Imager/Spectrometer with a 256256 HgCdTe NICMOS3 array. Generally, a set of at least two spectra were taken with the object dithered to two different positions along the slit. The spectrum of the comparison star HR 2714 (A2V spectral type), after removing the hydrogen lines in its spectrum, was used to ratio the spectra of V838 Mon. HR 2714 is spatially close to V838 Mon ( 3 degrees away) and furthermore its spectra were recorded immediately preceding/after the V838 Mon observations. Thereby it is ensured that the object and the comparison star are observed at similar air-mass. The ratioing process should therefore reliably remove telluric lines in the V838 Mon spectra. Wavelength calibration was done using OH sky lines that register with the spectra. Spectral reduction and analysis were done using IRAF. The observational details are presented in Table 1.
3 Results
The H band spectra are shown in Figure 1. Apart, from several prominent absorption features beyond 1.73m which we establish below to be due to water, there are other strong features in the spectra attributable to AlO and the second overtone of 12CO. We briefly discuss these features here but a more comprehensive modeling and analysis of their evolution, supplemented by our simultaneous and band spectra in which these molecules have strong spectral signatures, will be presented in a future work. This work will also incorporate our photometry results between 2002-2004. The most prominent features in Fig. 1 are the deep absorption features at 1.6480m and 1.6837 m which are due to the (1,0) vibronic transitions from the A-X band system of the AlO radical. Along with its possible analog V4332 Sgr, V838 Mon appears to be the only other object to show these rare AlO bands (Banerjee et al. 2003). AlO has a strong (4,0) A-X band in the band also which can be seen in the spectra of Lynch et al. (2004) and Evans et al. (2003). The expected positions of the 12CO first overtone bands ( = 3) are marked in Figure 1. Transitions from 3-0 to 7-4 are fairly prominent, especially in the later spectra. In general, the CO emission in V838 Mon is rather complex, especially in the first overtone bands starting from 2.29m in the band. These first overtone CO overtone bands are unusually deep in V838 Mon and show a very complex structure and evolution (Banerjee Ashok 2002, Lynch et al. 2004, Evans et al. 2003 ). An integrated modeling, using both and band spectra, is necessary to understand the behavior of CO in V838 Mon.
3.1 Synthetic spectra of water
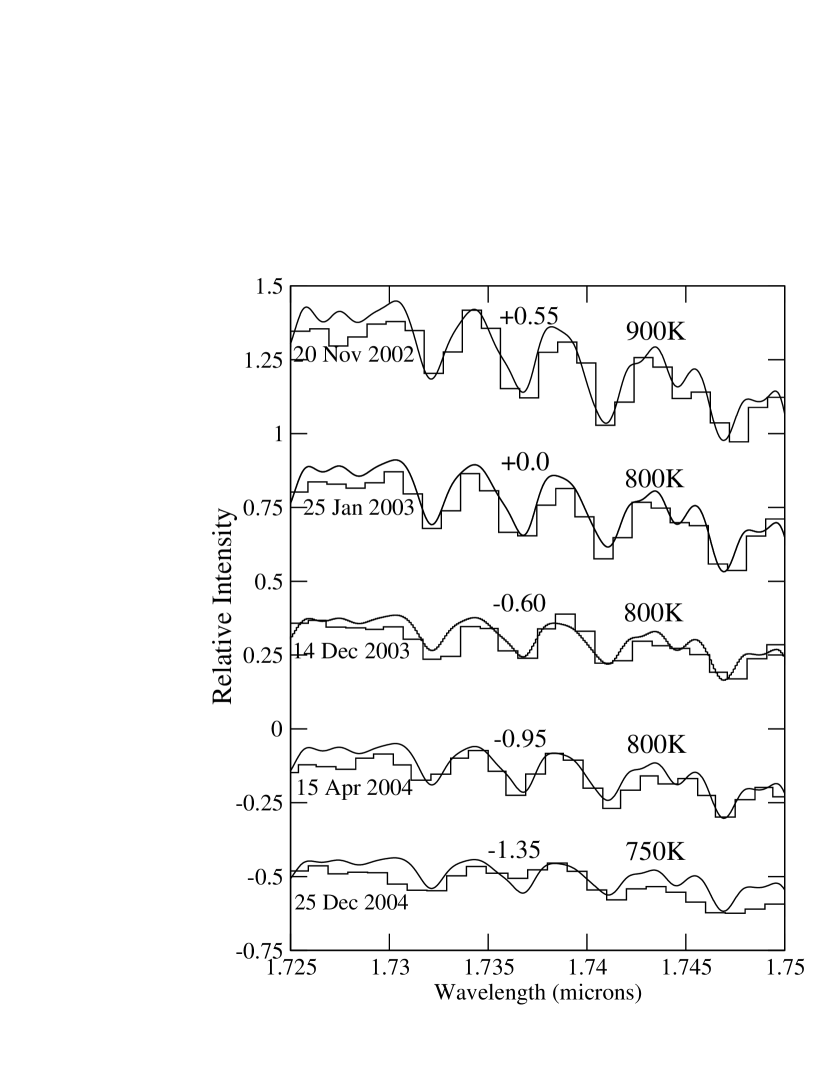
Our focus, in this study, is on the presence of water in V838 Mon. We tested for the signature of water in the spectra using the BT2 line list. BT2 (Barber et al 2005) is a variational line list, computed at University College London using the DVR3D suite of programs that calculates the rotation-vibration spectra of triatomic molecules (Tennyson et al., 2004). It is the most complete water line list in existence, comprising over 500 million transitions (65% more than any other list) and is also the most accurate (over 90% of all known experimental energy levels are within 0.3 cm-1 of the BT2 values). The final module of the DVR3D suite, ‘SPECTRA’, was used to generate synthetic spectra at the appropriate wavelengths and temperatures, the output being convolved at 4 cm-1 (similar to the resolving power of the instrument). Finally the output was ‘binned’ with the same bin sizes and positions as the observed spectrum. Water features were clearly identified. Moreover, the relative intensities of the various features in the synthetic spectra are temperature-dependent, and by testing for a best fit with the observed spectra, it was possible to determine the temperature of the region within which absorption was taking place on each of the five dates (Figure 2). Fig. 2 shows the best fit temperature on each date. The observed spectra are shown as histograms, whilst the synthetic spectra are presented in their un-binned form. It will be seen from Fig. 2 that between 20 November 2002 and 25 December 2004 the temperature at which absorption occurred decreased from 90030 K to 75050 K, that is to say a reduction of 15060 K over a period of 767 days.
Many of the transitions within the BT2 line list have been labeled, and consequently it was possible to assign the 17 strong lines that comprise the five main absorption features in Fig. 2. The details are given in Table 2. The lower and upper levels for each of these transitions are labeled in the manner: ( )[J KK], where the terms in round brackets are the vibrational quantum numbers, those in the square brackets represent the asymmetric top rotational quantum number and its projection onto two orthogonal axes (A and C) respectively. It will be seen that with the exception of one line at 1.74454 m all of these strong transitions are in the (0 0 0)-(0 1 1) band. Table 2 also contains information about intensity. The fourth column gives the relative intensities of the 17 strongest synthetic H2O lines in the wavelength range 1.726 to 1.751 m at a temperature of 800 K, whilst the last column gives the relative intensity of the five strong absorption features that are the result of the blending of these lines. The intensity is expressed as the total integrated line intensity within the bin whose position corresponds to that of maximum absorption within the feature. The apparent discrepancies between the two sets of data are explained by the fact that the features comprise not only the strong lines listed in Table 2, but a large number of weak lines which, individually, are insignificant, but collectively can make an important contribution to total absorption.
Lastly, it has been possible to estimate the H2O column densities using exp, where N is the number of water molecules per cm, S is the distance in cm and the product NS is the column density (molecules cm-1). is the opacity at wavelength and is one of the outputs of SPECTRA. Once the best temperature fit had been established, the optimum values of I0 and NS which gave the best fit to the observed data were obtained. The effect of increasing I0 is to raise the overall level of the synthetic plot, whilst increasing NS had the effect of increasing the depth of the strong absorption features relative to the weak ones. The data used for this fitting, prior to applying the exponential factor above, was first convolved with a gaussian with a FWHM of 1 cm-1 which is equivalent to a Doppler velocity spread of 50 km/s. Such a velocity spread in the cool expanding shell around V838 Mon is suggested from the analysis of Lynch et al. (2004). Subsequently the model data was convolved with a 4 cm-1 FWHM gaussian to take account of the resolving power of the instrument. Table 3 details our estimates of column density on each of the five dates. We believe that our methodology is liable to suffer from systematic errors and consequently we estimate the errors as being +100%, -50%. However, the comparison between the column densities at the different dates will be more accurate, and we estimate the error in the relative numbers at +25%, -20%.
4 Discussion
We have compared our column density and temperature estimates with those derived by Lynch et al. (2004). The temperature of 80030 K on 25 January 2003 is consistent with the 750-790 K suggested by Lynch et al. (2004) for the ‘cool cloud’ surrounding V838 Mon based on observations of H2O and CO molecular bands and the SiO (2) feature made at about the same date. Our estimate of the H2O column density on 25 January 2003 is 63 of the Lynch et al. (2004) value at a similar date and is therefore in reasonably good agreement (within our estimated error) with their work. The presence of an envelope at 800 K around V838 Mon, as our analysis shows, confirms the findings of Lynch et al. (2004) that a cool cloud surrounds the central star of V838 Mon. The derived temperature of 800K is close to that expected for an expanding grey body which absorbs stellar energy in the VIS-NIR and reradiates it at longer wavelengths (see equation 4, Lynch et al. 2004. If the cooling of the water-bearing envelope continues at the suggested rate of 75 K per year, its temperature may reach the ice sublimation temperature ( 150 K) to form water-ice in a few years from now. Such a development would further enhance the similarity between V838 Mon and its possible analog V4332 Sgr in which water ice is detected strongly 10 years after the object’s outburst (Banerjee et al. 2004).
References
- ref (1) Banerjee, D.P.K., Ashok, N.M. 2002, AA, 395, 161
- ref (2) Banerjee, D.P.K., Ashok, N.M. 2004, ApJ, 604, L57
- ref (3) Banerjee, D.P.K., Varricatt, W.P., Ashok, N.M. 2004, ApJ, 614, L53
- ref (4) Banerjee, D.P.K., Varricatt, W.P., Ashok, N.M., Launila, O. 2003, ApJ, 598, L31
- ref (5) Barber, R.J., Tennyson, J., Harris, G.J., Tolchenov, R.N. 2005, MNRAS(to be submitted).
- ref (6) Bond, H.E., et al. 2003, Nature, 422, 405
- ref (7) Brown N.J, 2002, IAU Circ. 7785
- ref (8) Carr, J.S., Tokunaga, A.T., Najita, J. 2004, ApJ, 603, 213
- ref (9) Crause, L.A., Lawson, W.A., Warrick, A., Kilkenny, D., Van Wyk, F., Marang, F., Jones, A.F., 2003, MNRAS, 341, 785
- ref (10) Crause, L. A., Lawson, W.A., Menzies, J.W., Marang, F. 2005, MNRAS, (in press), also available in astro-ph/0501490
- ref (11) Crovisier, J., et al. 1997, Science, 275, 1904
- ref (12) Dello Russo, N., et al ApJ, 2005, 621, 537
- ref (513) Desidera, S., et al. 2004, AA, 414, 591
- ref (14) Evans, A. et al. 2003, MNRAS, 343, 1054
- ref (15) Geballe, T.R., et al. 2002, ApJ, 564, 466
- ref (16) Henden, A., Munari, U., Schwartz, M. 2002, IAUC 7859
- ref (17) Hinkle, K.H., Barnes, T.G. 1979, ApJ, 227, 923
- ref (18) Jennings, D.E., Sada, P.V. 1998, Science, 279, 844
- ref (19) Kaminsky, B. M., Pavlenko, Y.V. 2005, MNRAS, 357, 38
- ref (20) Kimeswenger, S., Lederle, C., Schmeja, S. Armsdorfer, B. 2002, MNRAS, 336, L43
- ref (21) Kipper, T., et al. 2004, AA, 416, 1107
- ref (22) Lancon A., Rocca-Volmerange B. 1992, A&AS 96, 593
- ref (23) Lane, B. F., Retter, A., Thompson, R. R. Eisner, J. A. 2005, ApJ, 622, L137
- ref (24) Lynch, D.K. et al. 2004, ApJ, 607, 460
- ref (25) Munari, U., et al. 2002, AA, 389, L51
- ref (26) Munari, U., et al. 2005, astro-ph/0501604
- ref (27) Neufeld, D.A., Feuchtgruber, H., Harwit, M., Melnick, G. 1999, ApJ, 517, L147
- ref (28) Polyansky, O.L., Zobov, N.F., Viti, S., Tennyson, J., Bernath, P.F., Wallace, L. 1997, ApJ, 489, L205
- ref (29) Retter, A., Marom, A. 2003, MNRAS, 345, L25
- ref (30) Ryde, N., Lambert, D.L., Richter, M.J., Lacy, J.H. 2002, ApJ, 580, 447
- ref (31) Soker, N., Tylenda, R. 2003, ApJ, 582, L105
- ref (32) Spinrad, H., Newburn, R.L. 1965, ApJ, 141, 965
- ref (33) Tennyson, J., M. A. Kostin, M.A., Barletta, P., Harris, G.J., Polyansky, O.L., Ramanlal, J., Zobov, N.F. 2004, Computer Phys. Com, 163, 85-116
- ref (34) Tsuji, T. 2001, AA, 376, L1
- ref (35) Tylenda, R. 2004 AA, 414, 223
- ref (36) Tylenda, R., Soker, N., Szczerba, 2005, astro-ph/0412183
- ref (37) Van Loon, J.Th, Evans, A., Rushton, M.T., Smalley, B. 2004 AA, 427, 193
- ref (38) Wallace, L., et al. 1995, Science, 268, 1155
- ref (39) Wisniewski, J.P. et al. 2003, ApJ, 588, 486
- ref (40) Wisniewski, J.P., Bjorkman, K.S., Magalhaes, A.M. 2003, ApJ, 598, L43

| Date UT | Integration time (s) | Airmass | Std. star | Airmass |
|---|---|---|---|---|
| V838 Mon | V838 Mon | Standard star | ||
| 20 Nov 2002(0.9056) | 20 | 1.114 | HR 2714 | 1.148 |
| 25 Jan 2003(0.8000) | 45 | 1.203 | ” | 1.161 |
| 14 Dec 2003(0.8771) | 40 | 1.144 | ” | 1.109 |
| 15 Apr 2004(0.6542) | 30 | 1.655 | ” | 1.567 |
| 25 Dec 2004(0.8250) | 60 | 1.150 | ” | 1.080 |
| Lower level | Upper level | I(line)aaThe relative intensities of the individual strong lines are computed at 800K | Center | I(fea.)bbThe relative intensities of the features are computed for 25 Jan 2003 | ||
|---|---|---|---|---|---|---|
| (122)[JKaKc] | (122)[JKaKc] | m | Rel. | m | Rel. | |
| (0 0 0)[7 3 4] | (0 1 1)[8 5 3] | 1.73202 | 1.93 | 1.7329 | 1.77 | |
| (0 0 0)[6 3 4] | (0 1 1)[7 5 3] | 1.73239 | 1.61 | |||
| (0 0 0)[9 2 7] | (0 1 1)[10 4 6] | 1.73686 | 2.83 | 1.73686 | 1.93 | |
| (0 0 0)[15 7 8] | (0 1 1)[16 7 9] | 1.73987 | 1.23 | |||
| (0 0 0)[15 5 10] | (0 1 1)[16 5 11] | 1.74036 | 2.07 | |||
| (0 0 0)[16 6 11] | (0 1 1)[17 6 12] | 1.74082 | 1.03 | 1.74071 | 2.21 | |
| (0 0 0)[15 6 9] | (0 1 1)[16 6 10] | 1.74121 | 1.91 | |||
| (0 0 0)[5 3 2] | (0 1 1)[6 5 1] | 1.74128 | 1.26 | |||
| (0 0 0)[14 8 7] | (0 1 1)[15 8 8] | 1.74269 | 1.27 | Shoulder | 1.36 | |
| (0 0 0)[7 0 7] | (0 1 1)[8 2 6] | 1.74445 | 1.24 | |||
| (0 0 0)[13 5 8] | (1 1 0)[14 6 9] | 1.74454 | 1.23 | 1.74456 | 1.77 | |
| (0 0 0)[13 9 4] | (0 1 1)[14 9 5] | 1.74471 | 1.12 | |||
| (0 0 0)[14 7 8] | (0 1 1)[15 7 9] | 1.74650 | 2.12 | |||
| (0 0 0)[6 2 5] | (0 1 1)[7 4 4] | 1.74674 | 2.29 | |||
| (0 0 0)[16 5 12] | (0 1 1)[17 5 13] | 1.74680 | 1.50 | 1.74688 | 2.59 | |
| (0 0 0)[8 2 6] | (0 1 1)[9 4 5] | 1.74728 | 1.36 | |||
| (0 0 0)[14 6 8] | (0 1 1)[15 6 9] | 1.74750 | 1.13 | |||
| Obs. | Temperature | Error | Column Density |
|---|---|---|---|
| Date | (K) | (K) | molecules cm-2 |
| 20 Nov 2002 | 900 | 30 | 9.3x10²¹ |
| 25 Jan 2003 | 800 | 30 | 9.0x10²¹ |
| 14 Dec 2003 | 800 | 30 | 3.8x10²¹ |
| 15 Apr 2004 | 800 | 40 | 5.1x10²¹ |
| 25 Dec 2004 | 750 | 50 | 4.6x10²¹ |