119–126
The IMF in Extreme Star-Forming Environments:
Searching for Variations vs. Initial Conditions
Abstract
Any predictive theory of star formation must explain observed variations (or lack thereof) in the initial mass function. Recent work suggests that we might expect quantitative variations in the IMF as a function of metallicity [Larson (2005), (Larson 2005)] or magnetic field strength [Shu et al. (2004), (Shu et al. 2004)]. We summarize results from several on-going studies attempting to constrain the ratio of high to low mass stars, as well as stars to sub- stellar objects, in a variety of different environments, all containing high mass stars.
First, we examine the ratio of stars to sub–stellar objects in the nearby Mon R2 region utilizing NICMOS/HST data. We compare our results to the IMF by [kroupa2002, Kroupa (2002)] and to the observed ratios for IC 348 and Orion. Second, we present preliminary results for the ratio of high to low mass stars in W51, the most luminous H II region in the galaxy. Based on ground–based multi–colour images of the cluster obtained with the MMT adaptive optics system, we derive a lower limit to the ratio of high-mass to low-mass stars and compare it to the ratios for nearby clusters. Finally, we present the derived IMF for the R136 region in the LMC where the metallicity is solar using HST/NICMOS data. We find that the IMF is consistent with that characterizing the field [chabrier, (Chabrier 2003)], as well as nearby star–forming regions, down to 1.0 M⊙ outside 2 pc. Whereas the results for both Mon R2 and R136 are consistent with the nearby clusters, the ratio of high to low mass stars in W51 tentatively indicates a lack of low–mass objects.
keywords:
stars: formation, stars: low-mass, brown dwarfs, stars: mass function1 Introduction
What are the physical processes determining the shape of the IMF? Closely linked to this question is whether the IMF is universal or not. Studies of nearby, resolved, young star clusters indicate the IMF is remarkably similar, for higher mass stars and a flattening around 0.5 M⊙ where the slope changes from the Salpeter value to [Lada & Lada (2003), (Lada & Lada 2003]. Although these studied indicate the stellar IMF might be roughly similar in nearby star forming regions above 0.1 M⊙ [Meyer et al. (2000), (Meyer et al., 2000)], all the clusters studied to date essentially cover the same parameter space in terms of metallicity and cluster mass (to within an order of magnitude). In the brown dwarf regime, there are indications Taurus and Orion differ in the sense that Taurus is deficient in brown dwarfs relative to Orion [Luhman (2004), (Luhman 2004)].
For resolved stellar populations in more extreme environments, the evidence for variations in the IMF is relatively sparse. In the Arches cluster near the Galactic centre, the derived IMF is flatter than Salpeter [figer;stolte, (Figer et al. 1999; Stolte et al. 2002)]. However, [Portegies Zwart et al. 2002, Portegies Zwart et al. (2002)] showed the flattening observed could be due to dynamical mass segregation. For the metal–poor massive cluster R136 in the LMC, [Sirianni et al. 2000, Sirianni et al. (2000)] presented an IMF that showed a distinct flattening at 2 M⊙ down to 1.4 M⊙.
Theoretical considerations indicate the IMF should depend on environment. In particular it has been suggested it should depend on the magnetic field [Shu et al. (2004), (Shu et al. 2004)] or on a critical density where the gas changes from a phase where it cools through molecular lines to a phase where it is heated due to coupling to the dust [Larson (2005), (Larson 2005)]. [Shu et al. (2004), Shu et al. (2004)] suggested that the stellar mass is decided by the supercritical fraction of the molecular core which is inversely proportional to the magnetic field strength. To date, very little has been done in searching for variations in the IMF as a function of mass to magnetic flux density ratio in star forming regions. The magnetic field component along the line of sight has been measured in some star forming molecular clouds [Crutcher (1999), (Crutcher 1999)], and variations in the mass to magnetic flux density ratio of a factor of 6 has been found. In contrast, [Larson (2005), Larson (2005)] has suggested a characteristic mass is associated with the critical density where the gas undergoes a change in the polytropic index from to . Simulations have shown that an increase in the polytropic index tends to increase the average fragmentation mass [Li et al. (2003), (Li et al. 2003)]. The increase in the typical mass of a fragment results in a natural characteristic mass corresponding to the Jeans mass at the critical density. Since it is the interplay between cooling and heating that determines the critical density, it should be expected to vary with metallicity. Due to the lower amount of dust at low metallicities, the coupling of gas and dust occurs at a higher density and the Jeans mass at this point might actually be lower than for solar metallicity [Larson (2005), (Larson 2005)]. Clusters with different metallicities can be found within the Galaxy by probing both inner and outer Galaxy young clusters.
Possibly the IMF is already imprinted in the molecular clump mass spectrum before any star formation has taken place. Combining the clump mass spectrum recently derived for IRAS19410+2336 for the mass range 3–20 M⊙ [Beuther & Schilke (2003), (Beuther & Schilke 2003)] with the clump mass spectrum for the low mass region Rho Oph [motte, (Motte et al. 1998)], the shape is similar to the stellar IMF. This could indicate that the stellar IMF might not be determined by e.g. outflows and stellar winds. Probing clusters of different masses might indicate if this is true or not. Massive clusters have more massive stars and can therefore have a stronger effect on their environment through their UV flux and strong winds.
Variations of the characteristic mass will have a strong effect on the relative numbers of high- to low-mass stars. Changing the mass where the IMF flattens from a Salpeter power law to +1 dex shallower from 0.5 M⊙ to 0.3 M⊙ will lower the ratio of 1.0–10 M⊙ stars to 0.1–1.0 M⊙ by 30%. A change to 0.7 M⊙ will increase this ratio by 40%. We have begun a study of possible variations in the IMF by choosing clusters at different masses, metallicities and mass to magnetic flux density ratios. Here, we present preliminary results for three of them: Mon R2, W51, and R136.
2 Mon R2, constraining the sub–stellar IMF
With its earliest–type member a B0 star, Mon R2 is expected to have a total mass intermediate between IC 348 and Orion. Due to its relative youth ( 1 Myr) and its proximity of 830 pc [Herbst & Racine (1976), (Herbst et al. 1976)], the embedded cluster can be probed far below the hydrogen burning limit. We have obtained near-infrared imaging data with HST/NICMOS 2 in order to constrain the ratio of low mass stars objects (0.1–1 M⊙) to sub–stellar objects (0.04–0.1 M⊙). A mosaic covering 1′ (corresponding to 0.240.24 pc at a distance of 830 pc) was observed in the F110W, F160W, and the F220M filters, roughly corresponding to the J, H, and K filters. The data were transformed to the CIT system for comparison with the colors of normal stars and the interstellar reddening vector.
In total, we detect 182 sources brighter than , showing a wide variety of extinction, as expected for a young embedded cluster. The J–H versus J colour–magnitude diagram is shown in Fig. 1 together with a 1 Myr [Baraffe et al. (1998), Baraffe et al. (1998)] isochrone and the same isochrone reddened by A mag. Following [Wiling et al. (2004), Wilking et al. (2004)], we de–redden to the 1 Myr isochrone for stars with no detected near-infrared excess and to the T-Tauri locus for stars with near-infrared excess [Meyer et al. (1997), (Meyer et al. 1997)]. In this way, we have created an extinction limited sample between A mag and A mag. Stars with a de–reddened H–K colour 1.0 have been excluded because it is not clear how to interpret their colors. A total of 62 objects are located within the AV limit imposed by the completeness limit corresponding to 40 Mjup, assuming an age of 1 Myr.
Because the uncertainties on any individual estimate of stellar mass are large we have chosen not to analyze the mass spectrum. Instead, we derive the ratio of stars between 0.1 and 1 M⊙ and objects in the mass range 0.04 M⊙ to 0.1 M⊙. We have compared that ratio with the predicted ratio from a [Kroupa (2002), Kroupa (2002)] single star IMF where the expected distribution of ratios is found by Monte Carlo experiments. Our derived ratio is 5.3 2.1, significantly higher than the mode found for the Monte Carlo experiments. Since we have not corrected for field stars, the ratio is expected to be a lower limit since field stars will be more numerous at faint magnitudes. However, due to the rather small field of view and since Mon R2 is out of the Galactic plane we expect a small number of interlopers.

The comparison with the single star IMF is problematic since that assumes a binary fraction of 0%. Adopting the other extreme, all stars are in binaries, [kroupa2001, Kroupa (2001)] finds a much lower fraction of low–mass stars and brown dwarfs than the single star IMF. Thus, the disagreement between the derived ratio and the predicted value by the [Kroupa (2002), Kroupa 2002] IMF can be resolved by assuming many of the stars in Mon R2 are in binaries. We will explore this further in Andersen et al., in prep.
A similar ration can be derived for other regions. The same ratio as derived above for IC 348 is 4.00.8, using the data from [Luhman (2003), Luhmann (2003)]. Similarly, spectroscopic data for the Orion Nebula Cluster by [Slesnick et al. (2004), Slesnick et al. (2004)] gives a ratio of 7.2. Within the errors, the ratios derived for these two clusters seem to be in agreement with our findings here. More details can be found in [Andersen et al. 2005, Andersen et al., in prep. ]
3 W51, a massive young cluster
W51 is the most massive H II region in the Galaxy and is an excellent place to determine the IMF in an extreme environment. At a distance of 7 kpc, deep near–infrared imaging can penetrate the dust in the young region and probe the IMF to sub–stellar masses. We have performed a preliminary study of a small region (30′′30′′, 0.1 pc0.1 pc) in W51 using the MMT/ARIES Adaptive Optics system [Kenworthy et al. (2004), (Kenworthy et al. 2004)]. Total integration times were 600 seconds in H and 1100 seconds in K and the effective seeing for the images was 014, enabling us to reach 0.1 M⊙ through A mag. The colour–magnitude diagram plotted together with a [Siess et al. (2000), Siess et al. (2000)] 1 Myr isochrone is shown in Fig. 2.

We de–reddened the sources to the presented isochrone by sliding the objects along the reddening vector, and thereby ignoring any potential near–infrared excess. Due to the uncertainties in the individual mass estimates, we only constrain the ratio of stars in a given mass range. The data allows us to determine the ratio of stars in the interval 1.0–10 M⊙ to that from 0.1–1.0 M⊙, where we find a ratio of 0.360.11. A comparison with the [Kroupa (2002), Kroupa (2002)] IMF is shown on the right side of Fig. 2. Again,we find a ratio higher than what is predicted by the [Kroupa (2002), Kroupa (2002)] IMF. Only three percent of the Monte Carlo simulations produce a ratio as high as we have observed within one sigma errors. The lack of field star subtraction will make this value a lower limit as we expect significant contamination at the low mass end in this field.
[meyer2000, Meyer et al. (2000)] present similar ratios for several nearby star–forming regions. Our derived value is significantly higher than some of the regions, including the ONC and OMC–2, and Rho Oph with ratios of 0.070.02, 0.070.04, and 0.10.04, respectively. Within the errors, our measured ratio is consistent with NGC 2024, Mon R2, RCrA and IC 348. A larger area sampled with longer integrations times together with a control field will place much better constraints on this ratio. We should also be able to sample to lower masses, beyond the hydrogen burning limit.
4 The low–mass stars in R136
Powering the most luminous H II region in the Local Group, 30 Dor is considered a scaled-down version of distant star bursts. At a distance of 50 kpc, it is possible to resolve the stellar population down to 1 M⊙ and thus derive the IMF by direct star counts. Using HST/WFPC2 observations, [Sirianni et al. 2000, Sirianni et al. (2000)] derived the IMF down to 1.35 solar masses and found a distinct flattening of the IMF at 2 M⊙ at a distance of 1.5 pc from the center. However, the authors did not take into account that R136 suffers from differential extinction, AV=1–3 mag [brandl, (Brandl et al. 1996)].
We have observed the central one arcminute of the 30 Dor cluster, which has R136 in its centre, using HST/NICMOS 2 with the F160W filter. The total integration time per position in the mosaic is 1 hour. Source detection was done with great care to avoid identifying diffraction features as stars and in total, photometry was obtained for some 10000 stars within our field of view. Fig. 3 shows the derived IMF outside 1 pc, assuming an age of 3 Myr, justified by the presence of WR stars and the location of pre–main sequence stars in the colour–magnitude diagrams.
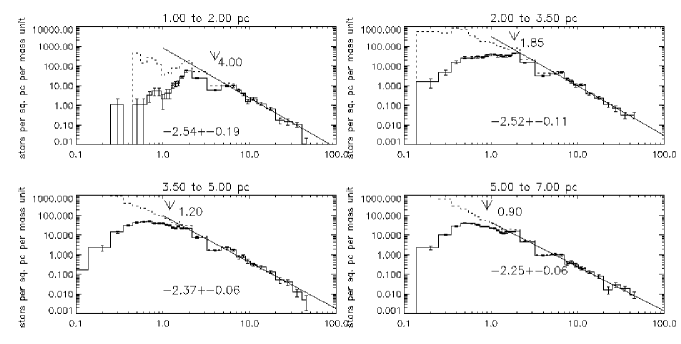
Outside 1 pc, the slopes are consistent with a Salpeter slope. In particular, there is no evidence for a flattening at 2 M⊙ as found in the optical HST data set by [Sirianni et al. 2000, Sirianni et al.] We believe the different results can be explained of differential extinction within the cluster which was not taken into account by [Sirianni et al. 2000, Sirianni et al.] By not creating an extinction limited sample, preferentially the lower mass stars will not be detected. More details can be found in [Andersen et al. 2005, Andersen et al. in prep]
5 Conclusions
We have presented results on the IMF for the three young star forming regions containing massive stars: R136, W51, and Mon R2. These three clusters cover a large range of cluster masses from less than M⊙ for Mon R2 to around M⊙ for R136. Despite the lower metallicity, the IMF in R136 appears to be a power law with a Salpeter slope down to 1 M⊙. Similarly, the ratio of 0.1–1 M⊙ stars over 0.04–0.1 M⊙ in Mon R2 is consistent with the same ratio derived for IC 348 and Orion. On the other hand, we find a deficit of low-mass objects in W51 relative to nearby less massive clusters like ONC and OMC–2, although our derived ratio is consistent with several other nearby regions. Future observations of a larger region in W51 will enable us to reduce the error bars on our derived ratio and hence firmly establish if the IMF in W51 is “bottom light”.
Acknowledgements.
We would like to thank our collaborators in the different projects: Bernhard Brandl, Wolfgang Brandner, John Carpenter, Angela Cotera, Catherine Dougados, Lynne Hillenbrand, Georges Meylan, and Andrea Moneti. MA was partially funded through DLR grant 50OR9912. This work was supported by a Cottrell Scholar’s Award to MRM from the Research Corporation and NASA grant HST13-9846References
- [Andersen et al. 2005] Andersen, M., Meyer, M.R., Oppenheimer, B.D., Hillenbrand, L.A., Coterra, A., Carpenter, J.M., Allard, F., Dougados, C. & Strom, S.E., 2005 in prep
- [Andersen et al. 2005] Andersen, M., Zinnecker, H., B. Brandl, Brandner, W., Moneti, A., Meylan, G., 2005 in prep
- [Baraffe et al. (1998)] Baraffe, I., Chabrier, G., Allard, F. & Hauschildt, P. H., 1998 A&A 337, 403
- [Beuther & Schilke (2003)] Beuther H. & Schilke P. 2003 Sci 303, 1167
- [Carpenter et al. (1997)] Carpenter, J.M., Meyer, M.R., Dougados, C., Strom, S.E. & Hillenbrand, L.A, 1997 AJ 114, 198
- [Crutcher (1999)] Crutcher, R.M. 1999 ApJ 520, 706
- [Figer et al. (1999)] Figer, D.F., Kim, S.S., Morris, M., Serabyn, E., Rich, R.M. & McLean, I.S. 1999 ApJ 525, 750
- [Herbst & Racine (1976)] Herbst, W. & Racine, R., 1976 ApJ 81, 840
- [Kenworthy et al. (2004)] Kenworthy, M. A., Miller, D. L., Brusa, G., et el. 2004 In Advancements in Adaptive Optics. Domenico B. Calia, Brent L. Ellerbroek, and Roberto Ragazzoni (Eds)., SPIE, 5490, 351
- [Kroupa (2002)] Kroupa, P., 2002 Sci 292, 82
- [Lada & Lada (2003)] Lada, C.J. & Lada, E.A 2003, ARAA 41, 57
- [Larson (2005)] Larson, R.B. 2005 MNRAS 359, 211
- [Li et al. (2003)] Li, Y., Klessen, R.S. & Mac Low, M., 2003 ApJ 592, 975
- [Luhman (2003)] Luhman, K.L., Stauffer, J.R., Muench, A.A., Rieke, G.H., Lada, E.A., Bouvier, J. & Lada, C. J, 2003 ApJ 593, 1093
- [Luhman (2004)] Luhman, K. L. 2004, ApJ 617, 1216
- [Meyer et al. (1997)] Meyer, M. R., Calvet, N. & Hillenbrand, L. A. 1997 AJ 1997, 114
- [Meyer et al. (2000)] Meyer, M. R., Adams, F.C., Hillenbrand, L.A., Carpenter, J.M. & Larson, R.B., 2000 Protostars and Planets IV Mannings, V., Boss, A.P., Russell, S. S. (Eds), University of Arizona Press.
- [Mengel et al. (2002)] Mengel, S., Lehnert M.D., Thatte, N. & Genzel, R. 2002, A&A 383, 137
- [Portegies Zwart et al. 2002] Portegies Zwart, S.F., Makino, J., McMillan, S.L.W &. Hut, P.2002 ApJ 565, 265
- [Shu et al. (2004)] Shu, F.H, Li, Z. & Allen, A., 2004 ApJ 601, 930
- [Siess et al. (2000)] Siess, L., Dufour, E. & Forestini, M., 2000 A&A 358, 593
- [Sirianni et al. 2000] Sirianni, M., Nota, A., Leitherer, C., De Marchi, G., & Clampin, M., 2000 ApJ 533, 203
- [Slesnick et al. (2004)] Slesnick, C.L. & Hillenbrand, L.A. & Carpenter, J.M., 2004 ApJ 610, 1045
- [Wiling et al. (2004)] Wilking, B. A., Meyer, M. R., Greene, T. P., Mikhail, A., Carlson, G. 2004 AJ 127, 1131