The open cluster initial-final mass relationship and the high-mass tail of the white dwarf distribution
Abstract
Recent studies of white dwarfs in open clusters have provided new constraints on the initial - final mass relationship (IFMR) for main sequence stars with masses in the range . We re-evaluate the ensemble of data that determines the IFMR and argue that the IFMR can be characterised by a mean initial-final mass relationship about which there is an intrinsic scatter. We investigate the consequences of the IFMR for the observed mass distribution of field white dwarfs using population synthesis calculations. We show that while a linear IFMR predicts a mass distribution that is in reasonable agreement with the recent results from the PG survey, the data are better fitted by an IFMR with some curvature. Our calculations indicate that a significant () percentage of white dwarfs originating from single star evolution have masses in excess of obviating the necessity for postulating the existence of a dominant population of high-mass white dwarfs that arise from binary star mergers.
keywords:
Stars: white dwarfs - stars: evolution; open clusters and associations: individual: Pleiades, NGC2516, NGC2168 (M35), Praesepe, Hyades, NGC3532, NGC2099 (M37), Sirius.1 Introduction
A knowledge of the Initial - Final mass relationship (IFMR) of stars is of fundamental importance in many astrophysical contexts and plays a key role in our understanding of chemical enrichment and the efficiency of star formation in galaxies. The low and intermediate mass end of this relationship can be probed by studying the properties of white dwarfs in open clusters.
The IFMR can also be investigated by looking at the mass distribution of field white dwarfs. Here, we are dealing with white dwarfs which would have had an origin in stellar clusters with a variety of parameters during the history of the galactic disc. Earlier studies (e.g. Koester & Weidemann 1980) showed that the predominant characteristic of the mass distribution, a sharp peak at , could be explained by the steep initial mass function and the finite age of the galactic disc. This peak corresponded very closely to the current turn-off mass of the stellar population in the galactic disc. The nature of the mass distribution above and below this peak clearly contained important additional information on the progenitors of the white dwarfs, but this could not be fully exploited at that time because of lack of data.
Recently, detailed studies have been carried out on large samples of white dwarfs in surveys such as the PG and the SDSS. With these new data, the relative importance of massive () white dwarfs only became apparent when attempts were made to correct observations based on magnitude limited surveys for the mass dependence of the intrinsic luminosity of the white dwarfs. The first such results for the PG survey were presented for the magnetic white dwarfs by Liebert Bergeron & Holberg (2003). They showed that when corrections were made to allow for the fact that the more massive magnetic white dwarfs had smaller radii, and hence were less luminous at a given effective temperature, the space density of high-field magnetic white dwarfs (HFMWDs) more than doubled from the previously estimated value of percent to percent. Wickramasinghe & Ferrario (2005, hereafter WF05) used population synthesis calculations to show that these observations could be explained if a significant fraction of the HFMWDs had massive progenitors. The mass distribution of the entire DA white dwarf population (magnetic and non-magnetic) in the PG sample has only recently been established by Liebert, Bergeron & Holberg (2005a). These data, when corrected to an equivalent volume limited sample, showed the presence of a significant high-mass tail with per cent of DA white dwarfs having masses in excess of . The details of this mass distribution must hold important clues on the nature of the mean IFMR appropriate to stars in the galactic disc.
In this paper we re-evaluate the open cluster data that are currently being used to define an IFMR and characterise this relationship. We show that the nature of this relationship has observable consequences for the mass distribution of field white dwarfs and show how the latter can be used to place constraints on the IFMR.
2 Analysis of Cluster Data
We use data for the clusters listed below. Only white dwarfs which are probable cluster members are included from the published data sets. The masses of the progenitor stars are calculated using the nuclear lifetimes from the tables of Girardi et al. (2002) for . The white dwarf mass and cooling age are obtained from the Fontaine, Brassard, & Bergeron (2001) evolutionary models which incorporate improvements in the equation of state and conductive opacities.
Hyades and Praesepe — The data points are from Claver et al. (2001) supplemented with recent results on two new stars in Praesepe (Dobbie et al. 2005). Perryman et al. (1998) estimate an age Myr with the errors given by von Hippel (2005) for the Hyades. The isochrone fit in Claver et al. (2001) led these authors to adopt the same age for Praesepe. Both have been linked to the same Hyades Supercluster and have a metallicity of [Fe/H] = (King & Hiltgen 1996; Cayrel, Cayrel de Strobel & Campbell 1985; Boesgaard & Friel 1990). We have used .
Pleiades— The age of the Pleiades is Myr from isochrones calculated with moderate convective core overshooting (Mazzei & Pigatto 1989; Meynet, Mermilliod & Maeder 1993; Ventura et al. 1998). This is in agreement with the age determined from the luminosity at which lithium is detected in the substellar objects (Stauffer, Schulz, & Kirkpatrick 1998). Since the metallicity of the Pleiades does not differ more than dex from solar (e.g. King & Soderblow 2000), the Girardi et al. (2002) table was used. We have adopted the obtained from the spectral fit, but have modified the gravity to give the gravitational redshift mass of .
NGC2168 (M35) — The cluster data are from Williams et al. (2004) supplemented by new data on LAWDS 2 and LAWDS 27. We adopt an age Myr given by von Hippel (2005) and used by Williams et al. (2004). A separate study by Steinhauer (2003) gives an age of Myr. Sung & Bessell (1999) obtain a value of [Fe/H] = -0.3 while Twarog et al. (1997) give [Fe/H] = -0.16. In our studies, we use .
NGC2516 — The cluster data are from Koester & Reimers (1996). Meynet et al. 1993 estimate an age Myr. Sung et al. (2002) give an abundance [Fe/H]= . We have used .
NGC3532 — The cluster data are from Koester & Reimers (1993). The and used by us are the mean values of the observations in Koester & Reimers (1996). This sparse cluster has an estimated age of Myr. Twarog et al. (1997) give a metallicity [Fe/H] = . Thus, we have used the table.
NGC2099 (M37) — We have used the results of Kalirai et al. (2005). This set of data are of somewhat lower quality because these stars are much fainter than all other stars considered here () and as a result. the coverage of the high Balmer lines which are most sensitive to gravity (and stellar mass) was generally of poorer quality. In addition, the stars WD 1, 15, 17, 24 are excluded because they are at the wrong distance to be members of this cluster. We note also that WD 15 and 17 have cooling ages that are much larger than any plausible cluster age. WD6 and WD21 are also excluded because the gravity was determined assuming cluster membership, rather than from the spectrum. We have adopted the age of and solar metallicity (Twarog et al. 1997).
Sirius — We include new data by Liebert et al. (2005b) who used the well determined luminosity and radius of Sirius A and stellar evolution models with a solar metallicity to accurately constrain the age for this system to .
Error bars for the initial and final masses were determined using a Monte Carlo simulation. 1000 white dwarfs were created with Gaussian distributions of and with equivalent to the published errors on these quantities. This makes the implicit assumption that the derived and are independent. The and were then calculated for each simulated sample, and the 68 percent confidence limits. These results are presented together with the white dwarf cooling ages in Table 1. Two sets of results are given for the errors. The first assumes the best estimate for the age of a cluster so that the errors are those from the white dwarf spectral observations. The second gives the systematic errors that result purely from the uncertainties on the cluster ages. The total error bars are obtained by adding these errors in quadrature as shown in Figure 1.
| Cluster | White Dwarf | |||||||
|---|---|---|---|---|---|---|---|---|
| (random) | (systematic) | |||||||
| Pleiades | LB1497 | |||||||
| Haydes | 0352+098 | |||||||
| & | 0406+169 | |||||||
| Praesepe | 0421+162 | |||||||
| 0425+168 | ||||||||
| 0431+125 | ||||||||
| 0438+108 | ||||||||
| 0437+138 | ||||||||
| 0836+197 | ||||||||
| 0836+201 | ||||||||
| 0836+199 | ||||||||
| 0837+199 | ||||||||
| 0837+218 | ||||||||
| 0837+185 | ||||||||
| 0840+200 | ||||||||
| NGC2516 | 2516-1 | |||||||
| 2516-2 | ||||||||
| 2516-3 | ||||||||
| 2516-5 | ||||||||
| NGC3532 | 3532-8 | |||||||
| 3532-9 | ||||||||
| 3532-10 | ||||||||
| NGC2099 | 2099-WD2 | |||||||
| (M37) | 2099-WD3 | |||||||
| 2099-WD4 | ||||||||
| 2099-WD5 | ||||||||
| 2099-WD7 | ||||||||
| 2099-WD9 | ||||||||
| 2099-WD10 | ||||||||
| 2099-WD11 | ||||||||
| 2099-WD12 | ||||||||
| 2099-WD13 | ||||||||
| 2099-WD14 | ||||||||
| 2099-WD16 | ||||||||
| NGC2168 | NGC2168 LAWDS 1 | |||||||
| (M35) | NGC2168 LAWDS 2 | |||||||
| NGC2168 LAWDS 5 | ||||||||
| NGC2168 LAWDS 6 | ||||||||
| NGC2168 LAWDS 15 | ||||||||
| NGC2168 LAWDS 27 | ||||||||
| Sirius | Sirius B |
3 Initial to final mass relationship
The data in Figure 1 span the initial mass range and thuse do not provide information at the low and high mass ends of single stars evolving into white dwarfs. We note that the IFMR of most clusters appears to have an intrinsic spread, that is, there is a range of initial masses which gives rise to a given final mass. If this spread is real (that is, if we can dismiss the possibility that the spread is not caused, for example, by non membership of the cluster, effects introduced by binaries, or by the underestimation of errors, as could be the case for NGC2099) then the IFMR should be characterised by a mean relationship and a spread about this mean. This spread could in principle also be modelled in future when enough data become available.
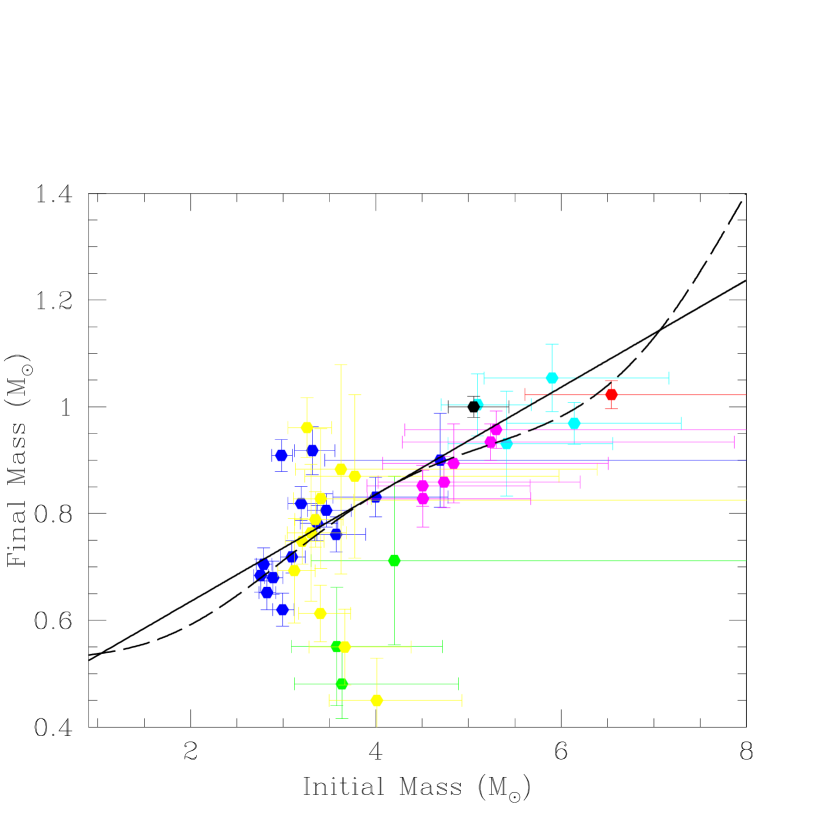
Given the various uncertainties involved, we cannot justify the use of any but a linear relationship to model the cluster data. When allowance is made for the uncertainties in the cluster ages, the error bars increase significantly particularly at the high mass end, and the weight is shifted from the high-mass end to the low-mass end of this diagram. Given the scatter in this part of the diagram, a least squares linear fit to the data leads to a meaningless result. We have circumvented this problem by introducing an anchor point at () (c.f. Weidemann 2000) which we justify as a requirement to reproduce the well established peak in the field white dwarf mass distribution at (see next section). With this anchor point, we obtain the best fit linear relationship to be
We note that if we adopt the best estimate for the cluster ages, a best fit linear relationship can be obtained from the cluster data alone without an anchor point at the low-mass end. The linear relationship that we obtain with this assumption is indistinguishable from the above equation within the given errors.
4 Population synthesis
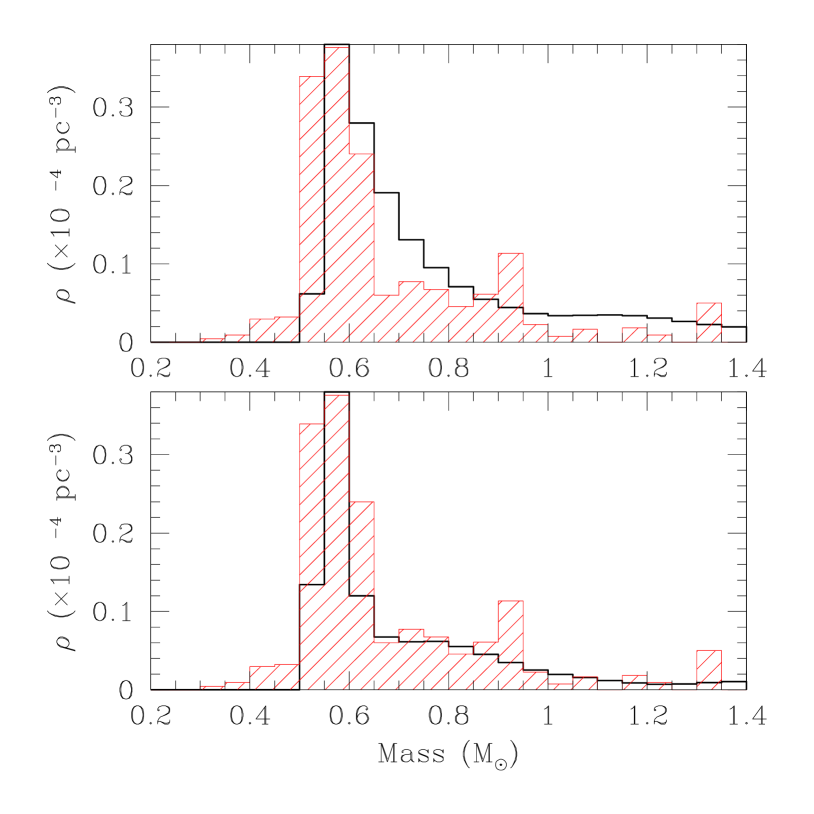
We show in Figure 2 the expected mass distribution of DA white dwarfs deduced from the PG survey corrected to an equivalent volume limited sample (Liebert et al. 2005a).
Carbon-Oxygen white dwarfs resulting from single star evolution are not expected to have a mass less than . The white dwarfs with lower masses in the PG survey must have interiors composed of helium and result from binary evolution during which the envelopes have been stripped off before helium ignition. We do not consider such stars in our population synthesis calculations.
We have carried out calculations of the expected mass distribution of field white dwarfs for different assumptions on the IFMR. We follow closely the method described by WF05 and we refer to that paper for details.
In essence, we calculate the number of white dwarfs per unit volume per unit final mass interval with luminosities in the range to by the integral
with:
and where is the initial mass function, is the star formation rate per unit area of the galactic disc, is the age of the disc, is the time of evolution of a Main Sequence star of mass to the beginning of the white dwarf phase (we assume that all white dwarfs are born at luminosity ), is the white dwarf cooling time to a luminosity and is a possibly time-dependent scale factor which allows for the inflation of the galactic disc. The parameters used here are as in WF05.
At the basis of our calculations is the assumed form for the IFMR. We consider only those stars with , which corresponds to the luminosity of a white dwarf of at (Wood 1995). We consider this to be appropriate in an average sense for comparison of our results with the data histogram obtained from the PG survey. We show in Figure 2 the results that we obtain when we use the linear IFMR overlapped to the data. The theoretical predictions are in overall agreement with the observations for although the shape is not reproduced in detail. The model predicts percent of white dwarfs of all types to have masses greater than . This value is similar to the percent in the PG survey (Liebert et al 2005a). The inclusion of non-DA spectral types could also have a small ( percent) effect on the relative numbers and percentages.
The observed white dwarf mass distribution appears to show a deficit of stars relative to the model in the mass range and an excess in the mass range . Rapid changes in the slope of the IFMR are reflected in the white dwarf mass distribution so that these deviations can be explained if we move away from a linear IFMR. A well determined white dwarf mass distribution can in principle be inverted to establish the appropriate IFMR. We demonstrate that the introduction of curvature into the IFMR in the appropriate mass ranges does indeed result in better overall agreement with the observed white dwarf mass distribution. The relationship that we have used is given by
With this relationship, there are changes in slope in the white dwarf mass distribution at and at as indicated by the PG survey. The cluster data may provide independent evidence for the presence of such a curvature when a larger and better refined dataset becomes available through future cluster observations.
The interpretation of the mass distribution of field white dwarfs is complicated by the fact that there will be a component that has resulted from close binary evolution. We expect in particular that white dwarf mergers will play a dominant role at the very high mass end () of this distribution.
5 Discussion and Conclusions
The initial-final mass distribution can be derived empirically by studying white dwarfs in open clusters, or by modelling the observed mass distribution of white dwarfs. Uncertainties in cluster ages, metallicity, and in atmospheric model fitting to spectral data result in larger error bars being associated with many of the cluster data points. In this paper, we have brought together all presently available data on the IFMR and made the simplest hypothesis that the the IFMR can be modelled by a mean relationship about which there is an intrinsic scatter. We have taken the point of view that a linear fit is all that can be warranted by the presently available cluster data and that the data set is not sufficiently extensive to warrant the modelling of the scatter.
The IFMR can be used to predict the white dwarf mass distribution. Here, the analysis depends on the input to the population synthesis calculations, such as the well established initial mass function, and the age of the galactic disc. The peak in the observed mass distribution is determined by the lowest mass main sequence stars that evolve into white dwarfs, while the high-mass tail is determined by the profile of the IFMR for high-mass progenitors. We have shown while the best fit linear relationship to the ensemble of cluster data with a suitably chosen anchor point at the low mass end predicts a white dwarf mass distribution that is in general agreement with observations, a relationship with curvature improves the quality of the fit to the white dwarf mass distribution. For both the linear and curved IFMRs, some percent of the stars in the white dwarf mass distribution has masses above . It is therefore not necessary to postulate the presence of a dominant component in the high-mass tail that arises from mergers (e.g. Liebert et al. 2005a), even though we may expect more mergers in high galactic latitude surveys such as the PG, compared to, for example, the EUV survey which roughly tracks the B-type stars of Gould’s belt.
An interesting corollary to our present study relates to the properties of the HFMWDs. It has been know for quite some time that the HFMWDs had masses that were, on the average, higher than for the non-magnetic white dwarfs. Early studies suggested that percent of the white dwarfs were magnetic, and such a percentage could be explained by assuming that their progenitors were the known magnetic Ap and Bp stars which comprised percent of all A and B stars. However, when appropriate corrections were made to allow for the fact that most surveys were magnitude limited, the predicted proportion of magnetic white dwarfs increased by a factor of (Kawka 2004, Liebert et al. 2003). WF05 argued that if one dismissed the possibility of a IFMR that is affected by magnetic fields, both the observed mass distribution, and the observed space density of the HFMWDs could be reproduced if in addition to the currently recognised group of magnetic Ap and Bp stars, percent of stars with masses in the range also evolved into HFMWDs.
This conclusion is now seen to be consistent with the results of the present study where percent of the percent of stars in the high-mass tail of the white dwarf mass distribution provides the observed percent of the HFMWDs.
Acknowledgements
The authors are indebted to Pierre Bergeron for providing access to his white dwarf models, Ted von Hippel for valuable discussions and the Referee, Detlev Koester, for his helpful comments.
6 References
Boesgaard A.M., Friel E.D., 1990, ApJ, 351, 467
Cayrel R., Cayrel de Strobel G., Campbell B., 1985 A&A, 146 249
Claver C.F., Liebert J., Bergeron P., Koester D., 2001, ApJ, 563, 987
Dobbie P.D., Pinfield D.J., Napiwotzki R., Hambly N.C., Burleigh M.R., Barstow M.A., Jameson R.F., Hubeny I., 2004, 355, L39
Fontaine G., Brassard P., Bergeron P., 2001, PASP, 113, 409
Girardi L., Bressan A., Bertelli G., Chiosi C., 2000, A&A. (Suppl. Ser.), 141, 371
Girardi L., Bertelli G., Bressan A., Chiosi C., Groenewegen M.A.T., Marigo P., Salasnich B., Weiss A., 2002, A&A, 391, 195
Kalirai J.S., Richer H.B. Reitzel D., Hansen B.M.S., Rich R.M., Fahlman G.G., Gibson B.K., von Hippel T., 2005, ApJL, 618, L123
Kawka A., 2004, Ph.D. (Thesis), ‘A study of white dwarfs in the solar neighbourhood’, Murdoch University
King J.R., Hiltgen D.R., 1996, AJ 112, 2650
King J.R., Soderblow D.R., 2000, ApJ, 533, 944
Koester D., Reimers D., 1993, A&A, 275, 479
Koester D., Reimers D., 1996, A&A, 313, 810
Koester D., Weidemann V., 1980, A&A, 81, 145
Liebert J., Bergeron P., Holberg J.B., 2003, AJ, 125, 348
Liebert J., Bergeron P., Holberg J.B., 2005a, ApJS, 156, 47
Liebert J., Young P.A., Arnett D., Holberg J.B., and Williams K.A., 2005b, ApJL, submitted
Mazzei P., Pigatto L., 1989, A&A, 193 148
Meynet G., Mermilliod J.-C., Maeder A., 1993, A&AS, 98, 477
Perryman M.A.C., Brown A.G.A., Lebreton Y., Gomez A., Turon C., de Strobel G.C., Mermilliod J.C., Robichon N., Kovalevsky J., Crifo F., 1998, A&A, 331, 81
Sarajedini A., Brandt K., Grocholski A.J., Tiede G.P., 2004, AJ, 127, 991
Stauffer J.R., Schulz G., Kirkpatrick J.D., 1998 ApJ, 499, 199.
Steinhauer A., 2003, PhD thesis (Indiana U)
Sung H., Bessell M.S., 1999, MNRAS, 306, 361
Sung H., Bessell M.S., Lee B.-W., Lee S.-G., 2002 AJ, 123, 290
Twarog B.A., Ashman K.M., Anthony-Twarog B.J., 1997, AJ, 114, 2556
Ventura P., Zeppieri A., Mazzitelli I., D’Antona F., 1998, A&A, 331, 1011
von Hippel T., 2005, ApJ, 622, 565
Weidemann, V., 2000, A&A, 363, 647
Wickramasinghe D.T., Ferrario L., 2005, MNRAS, 356, 1576 (WF05)
Williams K.A., Bolte M., Koester D., 2004, ApJL, 615, L49
Wood, M.A., 1995, LNP Vol. 443: White Dwarfs, 41