The ACS Virgo Cluster Survey V: SBF Calibration for Giant and Dwarf Early-type Galaxies
Abstract
As part of the Advanced Camera for Survey (ACS) Virgo Cluster Survey, we have measured Surface Brightness Fluctuations (SBF) in a sample of 100 early-type Virgo galaxies. Distances derived from these measurements are needed to explore the three-dimensional structure of the Virgo Cluster, study the intrinsic parameters of globular clusters associated with the program galaxies, and compare with the galaxy distances derived from globular cluster luminosity functions. Our SBF measurements have been performed in the F850LP bandpass of the Wide Field Channel of the ACS on the Hubble Space Telescope. These are the first measurements of this kind, and we present the first SBF calibration for this bandpass. The measured fluctuations depend on galaxy stellar population variations, which we quantify by galaxy color , where and are the galaxy magnitudes, respectively, in the F475W and F850LP ACS filters. We derive the following calibration for the absolute SBF magnitude :
in the range , and
in the range . The quoted zero-point uncertainty here includes all sources of internal error; there is an additional systematic uncertainty of 0.15 mag, due to the uncertainty in the distance scale calibration.
Physically, the two different color regimes correspond to different galaxy types: giant ellipticals and S0s at the red end, and early-type dwarfs at the blue end. For the first time in SBF studies, we are able to provide a firm empirical calibration of SBF in early–type dwarf galaxies. Our results agree with stellar population model predictions from Bruzual & Charlot (2003) in the range , while our empirical slope is somewhat steeper than the theoretical prediction in the range .
1 Introduction
The Advanced Camera for Surveys (ACS; Ford et al. 1998) Virgo Cluster Survey is a project based on observations with the ACS on the Hubble Space Telescope (HST), aimed at the exploration of the properties of 100 early–type galaxies in the Virgo Cluster, the study of their globular cluster systems, and the reconstruction of Virgo’s three dimensional structure. To measure the galaxy distances needed to realize these goals, we have used measurements of Surface Brightness Fluctuations (SBF). The SBF method was first proposed by Tonry & Schneider (1988) and it is based on the fact that the variance of normalized poissonian fluctuations of the galaxy stellar population depends on galaxy distance (for reviews see Jacoby et al. 1992 and Blakeslee et al. 1999). At present, SBF measurements have been used to determine galaxy distances out to 7000 km s-1, using data from ground–based telescopes and HST (Ajhar et al. 1997, 2001; Tonry et al. 1997, 2001; Jensen et al. 1999, 2003; Blakeslee et al. 2001, 2002; Mei et al. 2001, 2003; Liu et al. 2001, 2002; Mieske et al. 2003; and references in Mei et al. 2005, hereafter Paper IV).
For the Virgo Cluster in particular, SBF measurements have been published by several groups using data from both ground–based telescopes (Tonry et al. 1990, 2000, 2001; Pahre & Mould 1994; Jensen et al. 1998; Jerjen et al. 2004) and HST (Ajhar et al. 1997; Neilsen & Tsvetanov 2000; Jensen et al. 2003). West & Blakeslee (2000) have used published ground-based SBF data in a first examination of the three-dimensional structure of this cluster, particularly the cluster’s “principal axis” and its relations to the surrounding large-scale structure. Our new ACS dataset (for details, see Côté et al. 2004; Paper I) constitutes the largest, most complete, and most homogeneous SBF sample of Virgo galaxies yet assembled.
Since the absolute magnitude of the SBF varies as a function of the stellar population age and metallicity, SBF distance measurements in a given observational bandpass must be carefully calibrated in terms of stellar population observables, typically the galaxy color. Using an extensive ground-based -band SBF survey, Tonry et al. (1997, 2001) have established that it is possible to calibrate the SBF method using the integrated galaxy colors. In particular, they find that for bright ellipticals: 1) the absolute SBF magnitude is a linear function of the galaxy color over the range with an internal scatter mag; 2) the zero-point of this relation is universal over this color range; 3) the slope of the relation is consistent with theoretical predictions from recent stellar population models. For observational bands other than the -band, the relation between SBF absolute magnitude and galaxy colors has to be calibrated in that particular band. Ajhar et al. (1997) and Jensen et al. (2003) have calibrated SBF absolute magnitudes as a linear function of galaxy color for use, respectively, with the Wide Field and Planetary Camera-2 (WFPC-2) and NICMOS on the HST.
This paper provides the first calibration for SBF using the F850LP filter with the ACS, i.e, calibration of the absolute F850LP SBF magnitude , as a function of dereddened color in the F475W and F850LP filters. Observations and SBF reductions have already been described in Paper I, Jordán et al. (2004; Paper II) and Paper IV. In § 2 the main steps of the SBF reduction are briefly summarized. In § 3 the calibration method is discussed and the results are presented and analyzed. In § 4 the theoretical predictions from Bruzual & Charlot (2003) stellar population models are discussed. We summarize and conclude in § 5. The calibration presented here will be used in future papers to derive SBF distances for the galaxies in our sample and to explore the three-dimensional structure of the Virgo Cluster.
2 SBF measurements
2.1 Observations and SBF reduction
Our observations and data reduction procedures have been discussed in Paper I and Paper II, respectively. In Paper IV, we have addressed the specific issues related to SBF measurements with the ACS. Since the ACS camera presents significant geometrical distortions, the correction of these distortions involves image resampling by an interpolation kernel. For our SBF measurements we use images geometrically corrected with the drizzle software (Fruchter & Hook 2002) using the Lancsoz3 interpolation kernel. We have shown in Paper IV that, when using this kernel, the distortion correction does not add significant error to the SBF distance measurements. The main steps of SBF measurements are also described in Paper IV. We summarize here the main points.
We measure SBF in the F850LP bandpass of the ACS Wide Field Camera. The process involves fitting a smooth model to each galaxy in both the F850LP and the F475W band (Papers II and IV) and subtracting the models from the original images to produce “residual images”. The residual images in each band are then used to construct catalogs of external sources, i.e. globular clusters and background galaxies. From these catalogs we create a ’source mask’ to remove the contamination from the sources to the surface brightness variance. All sources brighter than a completeness magnitude , that corresponds to a completeness of at a given radius, are masked from the image. The power spectrum of the residuals is then calculated in multiple concentric annuli centered on the galaxy center, by multiplying successive annular mask functions with the ’source mask’ (i.e., the total mask function). The image power spectrum is the sum of two components: a flat, white noise power spectrum and the combined power spectrum of the SBF and undetected external sources, both convolved by the PSF (Point Spread Function) in the spatial domain. In the Fourier domain, this sum can be written as:
| (1) |
where the “expectation power spectrum” is the convolution of the power spectra of the normalized PSF and of the total mask function of the annular region being analyzed. In Paper IV we have shown that this power spectrum is not significantly modified by pixel correlation induced by our interpolation kernel (see Paper IV for details). Armed with a clearer understanding of the systematic errors arising from the data interpolation, we have measured unbiased values of and for multiple annuli in each galaxy as described in Paper IV. As the minimum innermost radius, we have taken . However when dust is present in the galaxy center, the dust regions are masked (see Paper I), and the minimum radius without dust contamination has been taken as the minimum annular radius. For the maximum outermost annular radius, we have chosen the radius where the galaxy brightness falls to half that of the sky (the range of maximum outermost radii being between and ). The next step is then to extract the SBF signal from by subtracting off the residual variance from faint sources including undetected globular clusters and distant background galaxies. Because of the exquisite resolution and depth of our ACS images, these correction are very small (see the following section).
2.2 Contribution to the SBF from external sources
The contribution to the power spectrum from these external sources is indistinguishable from the SBF contribution, since both are spatially convolved with the PSF. Following Tonry et al. (1990) and Blakeslee & Tonry (1995), we can write
| (2) |
where
| (3) |
is the contribution to the fluctuations due to globular clusters, and is the contribution due to background galaxies. The mean galaxy brightness in the denominator is chosen for compatibility with the definition above.
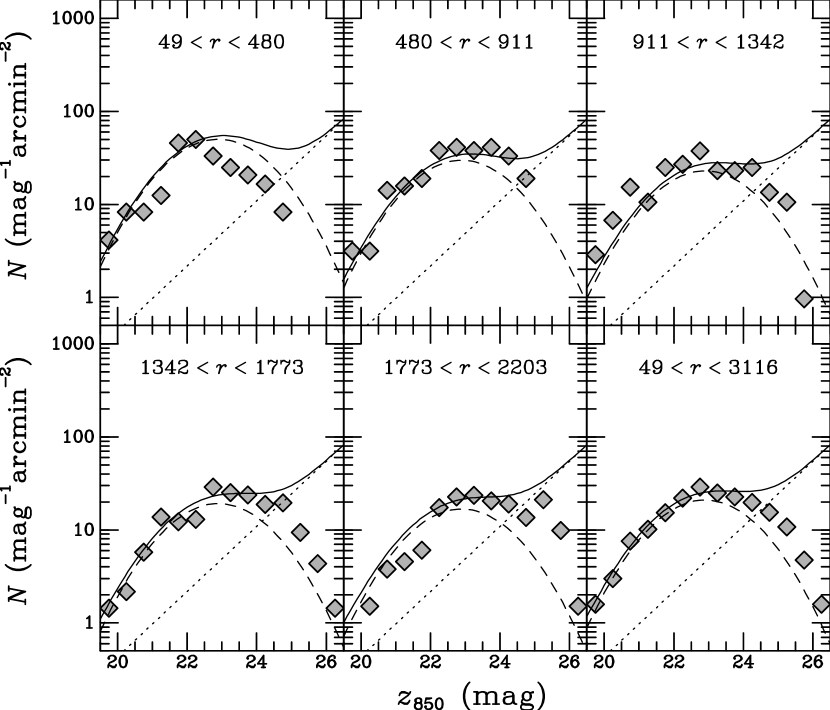
To estimate the contribution, sources were extracted from the same catalog used for masking external sources from the residual images (see above and Paper IV). Source counts were fitted to a composite globular cluster and external source luminosity function using a maximum likelihood approach. For the former, we adopted a Gaussian luminosity function, where is a function of both radius (distance from the galaxy center) and magnitude :
| (4) |
For the Virgo Cluster in the F850LP filter, we expect 23 mag and Harris (1991); Whitmore et al. (1995); Ferrarese et al. (2000, 2003); pen05. We use these values as our initial estimates but iterate on to improve the fitted luminosity functions.
For the background galaxies, we assumed a power-law luminosity function:
| (5) |
with . From the ACS faint galaxy counts of Benitez et al. (2004) in the F814W filter. At present, a value for in F850LP is unavailable in the literature. However, the F814W and F850LP bandpasses are quite similar so we expect no strong differences in between these filters. A fit of faint galaxy counts in our ACS blank fields gives us a slope of (Peng et al. 2005). If we vary in the range 0.33 to 0.37, our fits produce differences of only a few thousandths of a magnitude in the final SBF magnitudes.
In fitting the total source counts ( and ), we kept as fixed parameters and , and iterated on , as a function of the galaxy distance. Sources identified as bright foreground stars were removed from the images but not included in the fits. From the estimated and per pixel, was calculated as the sum of Blakeslee & Tonry (1995)
and
| (7) |
where is the photometric zero-point on the AB system (24.862 mag for the F850LP; Sirianni et al. 2005) plus reddening corrections (Schlegel et al. 1998) as given in Paper II. An example of the external source luminosity function is shown in Fig 1 for NGC 4472 (VCC 1226). Finally, the -band SBF magnitudes are given by
| (8) |
The uncertainty on in each galaxy has been calculated by propagating the measurement errors in Eq. 8 for the different annuli. This means that we have added in quadrature the errors due to the uncertainty in the fit of , the uncertainty in the galaxy flux, and the uncertainty in ( 25% , calculated as the variance in when different initial fit parameter are chosen). We neglect the 1% systematic uncertainty in (Sirianni et al. 2005) for the calibration, since it is common to all galaxies. The total uncertainty on the average for each galaxy has been calculated as the quadrature sum of the errors for the different annuli which we are averaging, divided by the number of annuli.
Finally, since , where is the galaxy distance, two more sources of uncertainty must be added in quadrature to the measurement error in for the purpose of this calibration. First, we include an expected “cosmic scatter” of 0.05 mag in (see Tonry et al. 1997), representing the intrinsic dispersion in for galaxies at the same observed color. Second, an uncertainty of 0.11 mag is introduced to account for the actual distance dispersion from depth effects in the Virgo Cluster. This value has been derived from the rms scatter of in position on the sky of the 100 galaxies in our sample.


3 Calibration of the ACS
3.1 Color measurements
We seek to calibrate as a function of the galaxy color (F475WF850LP), hereafter referred to , since the ACS approximates the SDSS and F850LP the SDSS . The galaxy colors are measured in the same annuli, and with the same masks, as those used for measuring the SBF. The sky values in the two filters for our final calibration sample are the same as in Paper II. Galaxies for which the sky estimates were especially difficult (due to strong gradients from bright neighboring galaxies) have been excluded for the purposes of this calibration (see below). The errors on the colors have been calculated by summing in quadrature the error in galaxy flux and the error due to sky subtraction. When the colors have been averaged on more annuli, the errors in each one have been added in quadrature, squared and divided by number of annuli. An additional uncertainty of 0.01 mag in color is added in quadrature as an estimate of the error due to imperfect flatfielding (see, e.g., Sirianni et al. 2005).
The colors have been dereddened as explained in Paper II, with the reddening for each galaxy position from Schlegel et al. (1998). The mean reddening for the sample is mag, with a standard deviation of 0.008 mag. The adopted extinction corrections are appropriate for elliptical galaxies, and . Hereafter, we use 0 to refer to the reddening-corrected galaxy color.
3.2 Calibration Slope
For the calibration of the -band SBF survey, Tonry et al. (1997) divided their sample into galaxy groups and clusters, and assumed that, since the galaxies within an individual group or cluster are at nearly the same distance, SBF magnitudes will simultaneously fit the relation:
| (9) |
where is the group mean value at the chosen fiducial color mag, that was fitted for each group to establish the universality of the SBF calibration. To obtain the absolute SBF magnitude , Tonry et al. (1997) calibrated the zero-point in Eq. 9 with Cepheid distances to galaxies in their groups. Thus, they obtained the following calibration, valid in the color range :
| (10) |
The Ajhar et al. (1997) HST/WFPC2 sample spans a range in galaxy 0 color between 1.15 and 1.3 mag. Their calibration for the WFPC2 F814W bandpass is
| (11) |
The Jensen et al. (2003) HST/NICMOS sample in the F160W (m) filter was calibrated over the range as:
| (12) |
These three samples were heavily weighted towards bright, red, early–type galaxies. The Ajhar et al. and Jensen et al. samples (due the small field sizes) were mainly confined to the central regions of bright galaxies, which tend to be quite red. Blakeslee et al. (2001) concluded that this fact explained the steep slope found by Ajhar et al., since the stellar population models predict a steepening of the SBF–color relation for very red populations.

Calibrations of bluer samples of dwarf early-type galaxies have been proposed by Jerjen et al. (1998, 2000, 2003, 2004) and Mieske et al. (2003) using ground–based observations of dwarfs coupled with the predicted color-dependence from stellar population models. However, until now, there has not been a sufficient sample of high-quality SBF measurements in dwarf ellipticals to permit a dependable empirical calibration.
Our ACS VCS sample is the most extensive and homogeneous early–type galaxy sample available for SBF measurements. The galaxies span a range in color of mag, corresponding to a range in 0 between 0.94 and 1.3 mag (based on the color transformations from Sirianni et al. 2005). We adopt here the same technique that Tonry et al. (1997) have used for galaxy groups, fitting the relation:
| (13) |
for the Virgo Cluster.
Among the 100 galaxies in our full sample, 14 have been omitted from our calibration sample because they are edge–on disk or barred galaxies which are especially challenging for SBF measurements, or because of difficult sky subtraction. These galaxies include: VCC 571, VCC 654, VCC 685, VCC 1025, VCC 1125, VCC 1192, VCC 1199, VCC 1327, VCC 1535, VCC 1627, VCC 1720, VCC 1857, VCC 2048, and VCC 2095. One galaxy in the sample, VCC 1499, has , and is too blue to be reliably included in a calibration. There are also several outliers that do not appear to lie on the average SBF magnitude versus color relation for the cluster. Fig. 2 shows the SBF and color measurements for the remaining 85 galaxies.
To calibrate our SBF measurements in the F850LP filter as a function of the average galaxy color, we calculate average SBF measurements for each galaxy and fit the relation in Eq. 13 to average galaxy colors, as Tonry et al. (1997) have done for each group in their sample. All galaxies included in the fit have an uncertainty on less than 0.15 mag (not considering the uncertainty due to the ‘cosmic’ scatter on the SBF calibration; see above). Errors on average galaxy colors are typically 0.01 mag. Both uncertainties on magnitude and color are included in the calculations below.
To exclude the outliers from the final calibration, we first make a linear fit to Eq. 13 to the overall sample with a robust least absolute deviation technique (Press et al. 1992). We obtain mag and . We identify four outlier galaxies from iterative 3- clipping. The four 3– outliers are: VCC 21, VCC 538, VCC 575, and VCC 731. Of these, VCC 21 contains numerous bright young star clusters, indicative of recent star formation, while VCC 731 (NGC 4365) is known from the ground-based SBF survey to be a Virgo member which lies on the far side of the cluster; we suspect that the other two may be similar cases. After excluding these four outliers and the very blue VCC 1499, our final sample consists of 82 galaxies.

In Fig. 3 our final galaxy sample and an overall fit (the continuous straight line) are shown. Both uncertainties on magnitude and color have been included in the fit estimation. We obtain:
in the overall color range . This color range includes both bright and faint galaxies. Various lines of evidence have suggested that the slope of the -band SBF–color relation is steeper for redder galaxies: for instance, the steep empirical slope found by Ajhar et al. (1997) for the red centers of bright ellipticals, which was also reproduced by the reddest composite stellar population models of Blakeslee et al. (2001). Conversely, the few dwarf galaxies in the Tonry et al. (1997) sample indicated a significantly shallower slope at the blue end, and the SBF measurements for Galactic globular clusters (Ajhar & Tonry 1994) showed no dependence on color. Most recent models also show a flattening of the relation for bluer populations.
Our sample, more clearly than any previous study, suggests that changes in color range affect the fitted slope, so we have studied the stability of the above relation as a function of the lower color limit, . When we repeat the fit in different ranges , we obtain the results shown in Fig 4. On the top of the figure the fitted slope is shown as a function of . On the bottom is shown the corresponding value of . Red galaxies tend to have slopes that are steeper ( 2) than those obtained by fitting to the overall sample. This suggests that our sample would be better represented by two distinct samples of red and blue galaxies, each one having its own calibration slope.
We fit Eq. 13 in two complementary color ranges : (blue) and (red), with (as suggested from Fig. 4). In Fig. 5 the fitted slopes (top) and the respective (bottom) are shown as a function of . Dot-dashed lines correspond to the fit in the color range and dashed lines to the fit in the color range . The continuous line is the total from both fits. The minimum total is obtained at , where the red slope is and the blue slope is . The two slopes cross at , which we take to be the color at which the two regimes separate. The for the total fit is minimized for both slope and zero-point, and the errors in both magnitude and color have been taken into account.
As in Tonry et al. (1997), we find the SBF in S0 and ellipticals to follow the same trend as a function of . Interestingly, as Figs. 2 and 5 show, the dividing color of is close to that which separates the two most basic galaxy types in our survey: giant and dwarf early-type galaxies. In fact, in our final sample, of 37 galaxies with color , only one is classified as dwarf. For , 10 galaxies are dwarfs and 8 are giants. For , of 26 galaxies, 20 are dwarfs. Physically then, the two different calibration slopes correspond to different galaxy types (giants corresponding to the red end, and dwarfs to the blue end).
Jerjen et al (2000, 2004) adopted a theoretical calibration to dwarf elliptical galaxies, based on a two branch prediction in the R–band SBF versus the galaxy color from Worthey et al. (1994) theoretical stellar population models using the Padova isochrones. While the scatter becomes larger for the bluest dwarfs, we see no evidence for distinct branches in our large data set; nor do the Bruzual & Charlot (2003) models predict such branches in vs .

Our sample is sufficiently complete at the blue end that we are able to provide, for the first time in SBF studies, an empirical calibration of SBF in early–type dwarf galaxies.
Splitting the galaxy sample at , we derive the following calibration for :
in the range , and
in the range . The reduced values for the red and blue subsamples are 0.99 and 0.8, respectively. The value of the total reduced is calculated as the appropriately weighted sum of the values from the two independent fits. When normalized by the total number of objects used in the fits, its value is 0.9. The reduced for the blue subsample is lower than that for the red sample. This might be due to the difficulty in accounting for the intrinsic distance dispersion within Virgo, or to overly conservative error estimates for the dwarfs. One of the outliers rejected above, VCC 21, is no longer an outlier with respect to the final, shallower, blue-end calibration, and we have added it to the final calibration above, by iteration.
We show in Fig. 6 the average and standard deviation of in color bins (top) and the color histogram (bottom) of our final calibration sample (82 galaxies, plus VCC 21). From the scatter in , we are aware that our calibration has a large scatter for colors . We will limit our absolute magnitude calibration to the color range .
We observe a similar behavior of as a function of the color for the multiple annuli within individual galaxies. However, the precise value of the slope is less robust and more sensitive to errors in the sky.
3.3 Calibration Zero-Point
Empirical calibration of the zero-point of the SBF relation requires computing the SBF absolute magnitude from independent distance measurements. The ideal situation would be to have Cepheid distances for multiple galaxies in our sample, however there are no galaxies in our sample with Cepheid distances. We thus calibrate our zero-points to the Virgo Cluster distance modulus found in the -band SBF survey of Tonry et al. (2001), but revised in accordance with the final set of HST Key Project Cepheid distances from Freedman et al. (2001). Tonry et al. (2001; Table 4) reported mag as the Virgo SBF distance modulus, where the SBF zero-point was calibrated from SBF measurements for individual early-type spiral galaxies with Cepheid distances given by Ferrarese et al. (2000).
However, using the final set of Key Project distances from Freedman et al. (2001), who adopted the Udalski et al. (1995) period-luminosity relation and added a metallicity correction, the Tonry et al. (2001) distance modulus for Virgo has to be corrected with a shift of 0.06 mag, and becomes mag (see discussions by Ajhar et al. 2001; Blakeslee et al. 2002). Here, the errorbar reflects the internal error on the mean Virgo SBF distance; the uncertainties in tying the ground-based SBF distances to the Cepheid distance scale, and in the zero-point of the Cepheid distance scale itself, contribute another 0.15 mag systematic error. If the metallicity corrections to the Cepheid distances tabulated by Freedman et al. are not applied, then the Tonry et al. (2001) Virgo distance modulus would shift instead by mag to mag (see Jensen et al. 2003). For our SBF calibration, we will adopt mag as the Virgo distance modulus.
Thus, scaling the zero-points from Eq.3.2, we obtain
in the range , and
in the range .
4 Predictions from stellar population models
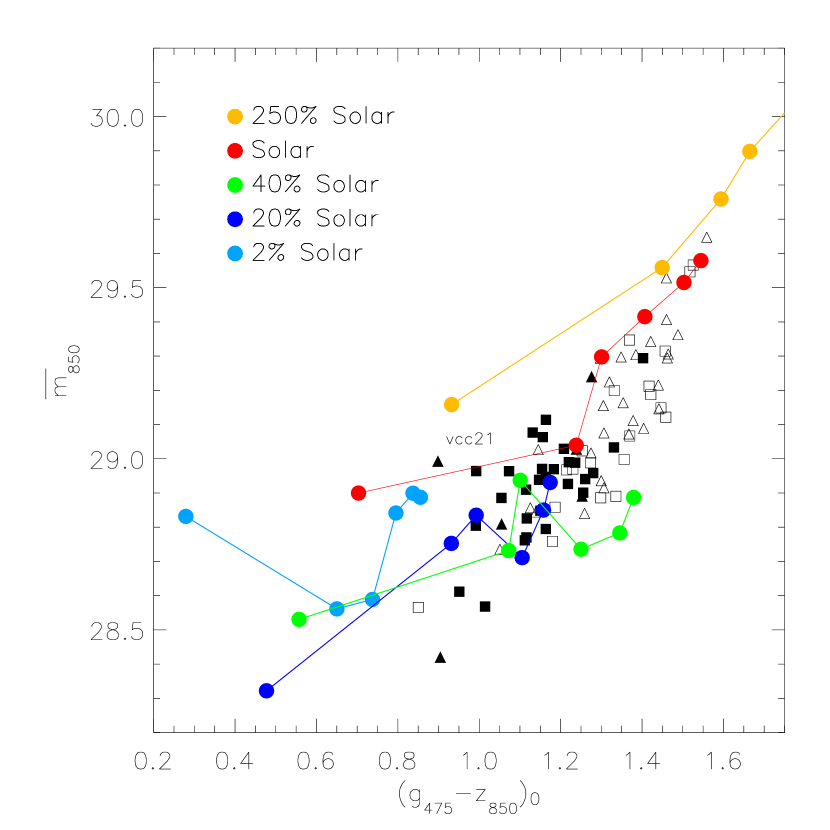
We now compare our results to predictions from the Bruzual & Charlot (2003) stellar population models, which we have calculated from the models and stellar luminosity functions kindly provided by S. Charlot. In Fig. 7 we show our data as compared to Bruzual & Charlot (2003) model predictions for different stellar populations. The lines connect models of the same metallicity: the red line is for solar metallicity, the green for 40% solar, the blue for 20% solar, the light blue for 2% solar, and the orange for 2.5 times solar metallicity. The dots on the lines represent, respectively from left to right, ages of 1, 3, 5, 8, 12 and 15 Gyr.
The Bruzual & Charlot models predict . To compare these predictions with the data, we add to the theoretical a distance modulus such that the predicted average for solar and 40% solar metallicity at mag is equal to the average observed at the same for our calibration sample. This procedure yields a theoretically predicted SBF Virgo Cluster distance modulus of mag, which is entirely independent of the Cepheid distance scale, but we caution that it depends on the color range we have chosen for shifting the models into agreement with the data.
This theoretically calibrated SBF Virgo Cluster distance modulus differs by 0.15 mag with respect to the revised Tonry et al. (2001) Virgo distance modulus of 31.09 mag adopted above. However, the two are consistent within the uncertainties from the zero-point of the Cepheid distance scale, the anchoring of the ground-based SBF measurements to the Cepheids, and the various uncertainties in the stellar population models (see Blakeslee et al. 2001 for a discussion). It is also worth noting that if we had adopted the Virgo distance modulus of obtained by calibrating SBF to the Freedman et al. (2001) Cepheid distances that use the new period–luminosity calibration but omit the metallicity correction, then the difference with respect to the model-predicted distance modulus would be only mag.
Our sample of early-type galaxies spans a wide range in metallicity and, presumably, age. Like the observations, the theoretical predictions also show a steeper slope at the red end, and a shallower at the blue end. The slopes predicted from linear fits to the overall model predictions are for mag, for mag, and for mag (in very good agreement with our empirical slope over the full range). If we fit only metallicities less than or equal to solar, at the red end the slope will be , compared to in the blue. The agreement between theoretical predictions and our empirical calibration is somewhat better at the red end. This is likely due to better accuracy in the modeling of highly evolved populations. The SBF predictions for young to intermediate-age populations is less certain due mainly to the uncertainties in the modeling of the asymptotic giant branch contributions. Furthermore, models of old stellar populations are better constrained by observations of Galactic globular clusters. For these reasons, we prefer our empirical blue-end slope, although additional SBF measurements of large homogeneous samples of dwarf galaxies (e.g., in the Fornax cluster) would be helpful in refining the SBF calibration for blue early-type galaxies.
Considering the uncertainty in the Virgo distance modulus, we conclude that our SBF data for the giant early-type galaxies are well reproduced by the models for stellar populations ages greater than 3 Gyr and metallicities in the range between 40% and 250% solar. The data for the dwarf galaxies are consistent with either much younger (less than 3 Gyr) solar metallicity populations or intermediate-to-old stellar populations with metallicities in the range 20%–40% solar.
5 Conclusions
As part of the ACS Virgo Cluster Survey, we have observed 100 early–type galaxies in the Virgo Cluster. We have measured SBF magnitudes in these galaxies with the aim of determining their distances and the three-dimensional structure of Virgo. We have presented the first calibration of the SBF method using the ACS instrument, giving the F850W SBF magnitude as a function of galaxy color. Obvious outliers, most likely due to a real dispersion in distance for galaxies in the Virgo Cluster region, have been omitted from this calibration, leaving 82 galaxies with colors ranging between 0.9 and 1.6 mag. Over this color range, the blue (mainly dwarf) and red (mainly giant) galaxies follow different linear relations, with the slope being shallower at the blue end. For the first time in SBF studies, our sample allows us to empirically calibrate SBF for dwarf early–type galaxies.
By comparing with stellar population models from Bruzual & Charlot (2003), we find that the slope of the model prediction for with 0 color is highly consistent with the observed relation for the red galaxy subsample. There is also general consistency at the blue end, though the stellar population models with young ages and low-metallicities predict a somewhat shallower slope than observed. This underscores the importance of empirical calibrations, as well as more realistic composite populations in any effort to model the behavior of the SBF method theoretically, especially for dwarf galaxies, for which the scatter in stellar population properties is larger. A forthcoming paper will present the distances to the individual galaxies derived with this calibration, and examine the issue of Virgo’s three dimensional structure and its implications for galaxy and globular cluster properties.
References
- Ajhar et al. (1997) Ajhar E.A., Lauer, T.R., Tonry, J.L. et al., 1997, AJ, 114, 626
- Ajhar and Tonry (1994) Ajhar E.A. & Tonry, J.L. 1994, ApJ, 429, 557
- Ajhar et al. (2001) Ajhar E.A., Tonry, J.L., Blakeslee, J.P. et al. 2001, ApJ, 559, 584
- Benitez et al. (2004) Benitez, N., Ford, H. Bowens, R. et al. 2004, ApJS, 150, 1
- Blakeslee & Tonry (1995) Blakeslee J.P. & Tonry, J.L., 1995, ApJ, 442, 579;
- Blakeslee et al. (1999) Blakeslee, J. P., Ajhar, E. A., Tonry, J. L., 1999, in Post-Hipparcos Cosmic Candles, eds. A. Heck & F. Caputo (Boston: Kluwer), 181
- Blakeslee et al. (2001) Blakeslee, J.P., Vazdekis, A., & Ajhar, E.A. 2001, MNRAS, 320, 193
- Blakeslee et al. (2002) Blakeslee, J.P., Lucey, J.R., Tonry, J.L. et al. 2002, MNRAS, 330, 443
- Bruzual & Charlot (2003) Bruzual, G. & Charlot, S. 2003, MNRAS, 344, 1000
- Côté et al. (2004) Côté, P., Blakeslee, J.P., Ferrarese, L., Jordán, A., Mei, S., Merritt, D., Milosavljević, M., Peng, E.W., & West, M.J. 2004, ApJS, 153, 223 (Paper I)
- Ferrarese et al. (2000) Ferrarese L., Mould, J.R., Kennicutt R.C. 2000, ApJ, 529, 745
- Ferrarese et al. (2003) Ferrarese, L., Côté, P. & Jordán, A. 2003, ApJ, 599, 1302
- Ford et al. (1998) Ford, H.C. et al. 1998, Proc. SPIE, 3356, 234
- Freedman et al. (2001) Freedman et al. 2001,ApJ, 553, 47
- Fruchter & Hook (2002) Fruchter, A. S. & Hook, R. N. 2002, PASP, 114, 144
- Harris (1991) Harris, W.E. 1991, ARA&A, 29, 543;
- Jacoby et al. (1992) Jacoby, G.H., Branch, D., Ciardullo, R., Davies, R.L., Harris, W.E., Pierce, M.J., Pritchet, C.J., Tonry, J.L., Welch, D.L. 1992, PASP, 104, 599
- Jensen et al. (1999) Jensen, J.B., Tonry, J.L., Luppino, G.A., 1999, ApJ, 510, 71
- Jensen et al. (2003) Jensen, J. B., Tonry, J. L., Barris, B. J., Thompson, R. I., Liu, M. C., Rieke, M. J., Ajhar, E. A., & Blakeslee, J. P. 2003, ApJ, 583, 712
- Jerjen (2003) Jerjen, H. 2003, A&A, 398, 63
- Jerjen et al. (1998) Jerjen, H., Freeman, K.C., & Binggeli, B. 1998, AJ, 116, 2873
- Jerjen et al. (2000) Jerjen, H., Binggeli, B., & Freeman, K.C. 2000, AJ, 119, 166
- Jerjen et al. (2004) Jerjen, H., Binggeli, B., & Barazza, F. D. 2004, AJ, 127, 771
- Jordán et al. (2004) Jordán, A., Blakeslee, J.P., Peng, E.W., Mei, S., Côté, P., Ferrarese, L., Tonry, J.L., Merritt, D., Milosavljević, M., & West, M.J. 2004, ApJS, 154, 509 (Paper II).
- Liu & Graham (2001) Liu, M.C. & Graham J.R. 2001, ApJL, 557, 31
- Liu et al. (2002) Liu, M. C., Graham, J. R., & Charlot, S. 2002, ApJ, 564, 216
- Mei et al. (2001) Mei, S., Silva, D. R., & Quinn, P. J. 2001, A&A, 366, 54
- Mei et al. (2003) Mei, S., Scodeggio, M., Silva, D.R, Quinn, P.J. 2003, A&A, 399, 441
- Mei et al. (2005) Mei, S., Blakeslee, J.P., Jordán, A., Peng, E.W., Côté, P., Ferrarese, L., Tonry, J.L., Merritt, D., Milosavljević, M., & West, M.J. 2005, ApJS, in press (Paper IV).
- Mieske et al. (2003) Mieske, S., Hilker, M., & Infante, L. 2003, A&A, 403, 43
- Neilsen & Tsvetanov (2000) Neilsen, E.H. & Tsvetanov, Z.I. 2000, ApJ, 536, 255
- Pahre & Mould (1994) Pahre, M.A. & Mould J.R. 1994, ApJ, 433, 567
- Press et al. (1992) Press, W.H. et al. 1992, Numerical Recipes, Cambridge University Press, New York
- Schlegel et al. (1998) Schlegel D.J., Finkbeiner D.,P., Davis M. 1998, ApJ,500,525
- Sirianni et al. (2005) Sirianni, M. et al. 2005, PASP, submitted
- Tonry & Schneider (1988) Tonry, J.L. & Schneider, D.P., 1988, AJ, 96, 807
- Tonry et al. (1997) Tonry, J.L., Blakeslee, J.P., Ajhar, E.A. et al. 1997, ApJ, 475, 399
- Tonry et al. (2000) Tonry, John L., Blakeslee, J.P., Ajhar, Edward A. et al. 2000, ApJ, 530, 625
- Tonry et al. (2001) Tonry, J.L., Dressler,A., Blakeslee, J.P. et al. 2001, ApJ, 546, 681
- Udalski et al. (1999) Udalski, A., Soszynski, I., Szymanski, M. et al. 1999, Acta Astron., 49, 223
- West & Blakeslee (2000) West, M.J. & Blakeslee, J.P. 2000, ApJL, 543, 27
- Whitmore et al. (1995) Whitmore, B. C., Sparks, W. B., Lucas, R. A., Macchetto, F. D., & Biretta, J. A. 1995, ApJ, 454, L73
- (43) Worthey, G., 1994, ApJS, 95, 107