A Deep Infrared Search for AXP 1E 1841045.
Abstract
Multi-colour (JHK) imaging and photometry of the field of the Anomalous X-ray Pulsar AXP 1E 1841045 is analysed in the light of new, accurate coordinates from Chandra (Wachter et al, 2004). From excellent quality images, we find multiple sources in and around the position error circle. Of these, none can be confidently identified as the infrared counterpart. The limiting magnitudes reached were , and (95% confidence).
1 Introduction
The Anomalous X-ray Pulsars (AXPs) are a small group of young, energetic neutron stars, whose luminosity is thought to be powered by the decay of a super-strong magnetic field: magnetars (Thompson & Duncan, 1996). Since the discovery of the first optical counterpart to an AXP (Hulleman, van Kerkwijk & Kulkarni, 2000), searches have been undertaken to identify further optical and infrared counterparts in different colours. Due to the large extinction to most of these sources, the infrared has proved the more successful route. See Woods & Thompson (2004) for a review of the AXPs and their counterparts to date.
1E 1841045 is located within the supernova remnant Kes 73, and has a pulse period of 11.8s and a soft X-ray spectrum well-fitted by either a black-body plus power-law or the sum of two black-bodies with a fitted hydrogen absorption column of cm-1 (Morii et al., 2003; Gotthelf et al., 2004). As a recent surprise, this source was found by Kuiper at al. (2004) to have hard, pulsed X-ray emission with a rising power-law spectrum out to about 100keV. Since this, then, dominates the emission energetics, it has prompted an ongoing revisal of magnetar electrodynamics.
The supernova remnant Kes 73, has an estimated age of 1500yrs (e.g. Gotthelf et al., 2002) and using H I measurements towards the SNR, its distance has been determined as 6–7.5kpc (Sanbonmatsu & Helfand, 1992). Geometric alignment and the youth of both the SNR and AXP (whose age is not easily determined, but is of the order thousand of years) point to the association of the two being real.
Mereghetti et al. (2001) were the first to search for an infrared/optical counterpart to 1E 1841045 by performing multi-colour imaging and selected spectroscopy, but based on only ROSAT and Einstein positions.
Wachter et al. (2004) report a precise location for the AXP based on new Chandra observations. They give the source’s coordinates as RA=18:41:19.343, Dec=-04:56:11.16, with a error radius of . The images presented by these authors show an object in the error circle that is either extended or made up of multiple sources.
Here we present deeper images taken in better seeing, from which we attempt to identify the infrared counterpart to 1E 1841045.
2 Observation and analysis
We imaged the field of 1E 1841-045 on the night of 5th June 2003 with PANIC (Persson’s Auxiliary Nasmyth Infrared Camera, Martini et al., 2004), the 1k1k infrared imaging array with pixels on the Magellan Clay Telescope111see http://www.ociw.edu/lco/magellan/instruments/PANIC/panic/, under excellent conditions. The total integration times were 1125s in J, 1825s in K, and 1825s in H, at seeing of . A second J-band integration was performed, but the seeing had deteriorated, and so this is not included in the analysis.
Standard reduction was carried out to flat field and combine the frames using IRAF. The flat fields were derived by median combining many images in each filter of a less crowded field. This proved more successful than either screen flats or median images from the data frames themselves. Photometry was performed using DAOPHOT II (Stetson, 1987).
In order to calibrate the frames, short-exposure images were obtained of standard stars, from Persson et al. (1998). Because of some light cloud in patches on the night in question, it was found more reliable to use standards from the following night and find the magnitude transformation from one night to the next using fields which were imaged on both nights (see Durant & van Kerkwijk, 2005). The offsets were small in each band, mag. The standards were taken at a range of airmasses, so the zero point at the appropriate airmass could be found (the variation with airmass is slight in the infrared in any case).
The magnitudes found for stars in the field tend to be fainter than those found by Wachter et al. (2004) and Mereghetti et al. (2001) by typically 0.3mag for their faintest stars (note that there are also some substantial differences in the magnitudes presented by these two sets of authors). This can be attributed to the better seeing conditions, which allowed sources to be separated which would otherwise have been blended in this extremely crowded field. Many of the stars measured by Mereghetti et al. (2001) are saturated on our deeper images, and so cannot be compared. We believe that the better separation of sources entirely explains the discrepancy in measured magnitudes.
An astrometric solution was found for the images based on 2MASS sources (Curti et al., 2003) in the field. 86 stars were matched for J in the field, and after rejecting large residuals, the RMS deviation in each coordinate was with 71 points. The error in connecting this image to the others is negligible in comparison. The astrometric uncertainty is in connecting our images to the 2MASS reference frame. Since Wachter et al.’s coordinates are also based on 2MASS stars, there should be no additional uncertainty in the astrometry.
3 Results
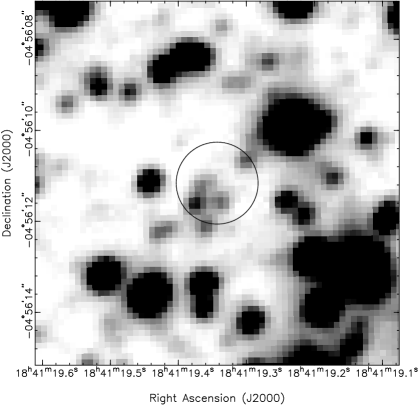
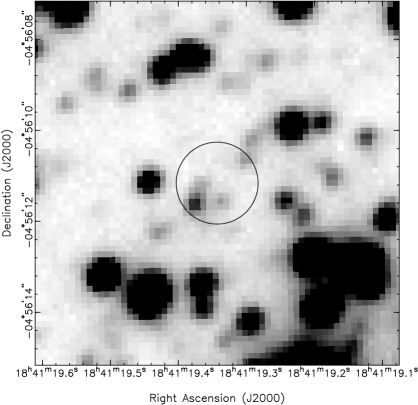
Figure 1 shows the stacked images, with the position error circle of radius (3- confidence) derived by Wachter et al. (2004) overdrawn. Table 1 gives the magnitudes of stars in and around the circle, as labelled on the images, and Figure 2 shows those stars with three measured magnitudes on a colour-colour diagramme compared to the rest of the stars in the field.
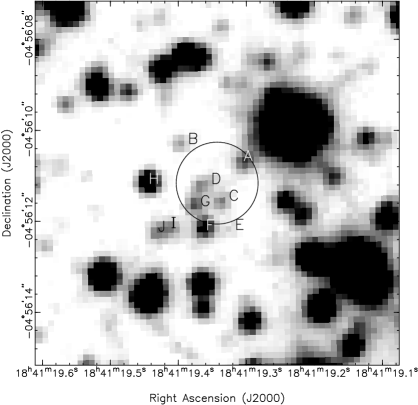

From Figure 2, one sees that, of the stars near the positional error circle (see Figure 1), none have significantly different colours to other stars in the field. Note that the large scatter is due to the extreme crowding in the field, particularly in K. This means that the measured magnitude of a given star can be strongly affected by the halo of a neighbouring brighter star. The magnitude limits reached at 95% confidence are: , and .
| Star IDaaas labelled in Figure 1. | R. A. | Dec | J | H | K |
|---|---|---|---|---|---|
| A | 18:41:19.293 | -04:56:10.67 | 20.96(9) | 19.35(6) | 18.44(7) |
| B | 18:41:19.388 | -04:56:10.28 | 20.8(4) | 19.6(2) | |
| C | 18:41:19.327 | -04:56:11.57 | 21.28(12) | 19.90(11) | 19.44(18) |
| D | 18:41:19.356 | -04:56:11.23 | 21.38(14) | 19.90(11) | 19.32(15) |
| E | 18:41:19.315 | -04:56:12.20 | 22.2(3) | 20.9(5) | 20.9(6) |
| F | 18:41:19.352 | -04:56:12.15 | 22.1(3) | 19.47(7) | 18.09(5) |
| G | 18:41:19.367 | -04:56:11.64 | 19.93(4) | 19.09(5) | 18.89(9) |
| H | 19:41:19.435 | -04:56:11.13 | 18.97(3) | 17.90(3) | 17.40(4) |
| I | 19:41:19.401 | -04:56:12.15 | 20.04(13) | 19.14(12) | |
| J | 18:41:19.421 | -04:56:12.24 | 20.82(8) | 19.57(8) | 18.99(10) |
Note. — Magnitude limits are at 95% confidence. The systematic uncertainty in position does not affect relative co-ordinates.
By fitting the X-ray spectrum with an absorbed black body plus power-law spectrum, a value for the hydrogen column density can be derived. Assuming the Predehl & Schmitt (1995) relationship, this translates to an extinction towards the source of . With the caveat that the intrinsic X-ray spectrum is not known, this number provides an approximate measure of reddening. Figure 2 shows that the effect of extinction means that one cannot distinguish between an intrinsically hot but highly extincted source and an intrinsically cool (i.e. red) source. Also note that, since the main sequence is known to start around (0,0) on this diagramme, the bluest sources here have , although extinction is known to increase rapidly in this direction (e.g. Drimmel et al., 2003).
Although an out-lier on Figure 2, Star F is consistent with being a very highly reddened red super-giant. De-reddening it with would not place it below the bulk of the stars, as is the case with 4U 0142+61 (, , Israel et al., 2004, Hulleman et al., 2004). Whether these two objects would be expected to have the same spectrum is an open question, as is the appropriate value of reddening. Those AXPs with confirmed infrared counterparts appear to have similar X-ray to infrared flux ratios (Durant & van Kerkwijk, 2005), and Star F would have both a much brighter counterpart and much lower X-ray to infrared flux ratio than 4U 0142+61. Although stars with colours as red as Star F are rare in the field, it cannot be presented as a likely counterpart. It is worth mentioning that Star B, if close to the the magnitude limit in J, would fall in the right region of Figure 2, but again this can hardly be more than a suggestion of a candidate counterpart.
Comparing with the spectrum of 4U 0142+61 again (the brightest and best-measured AXP, , , ), one would expect 1E18410145’s magnitudes to fall beyond the magnitude limits given above, especially if the nominal reddening values to the two sources are to be believed (which would make the magnitudes above fainter by about 2.5, 1.7 and 1.1 magnitudes respectively). Thus a non-detection here does not imply that the two spectra are necessarily different, but does demonstrate that this part of the sky is so crowded that finding the counterpart will prove very difficult.
In conclusion, we have found the magnitudes of several sources in or near the accurate Chandra error circle for the position of 1E 1841045. Despite the depth and quality of the images, we find no source which can be confidently presented as the likely counterpart. Extremely deep images with narrow point-spread functions will be required in order to find the counterpart to this AXP.
References
- (1) Curti, R. et al. (2003) VizieR On-line Data Catalog: II/246. Originally published in: University of Massachusetts and Infrared Processing and Analysis Center (IPAC/California Institute of Technology)
- (2) Drimmel, R., Cabrera-Lavers, A. & López-Corredoira, M., 2003, A&A, 409, 205
- (3) Durant, M., van Kerkwijk, M., 2005, ApJ, in press
- (4) Gotthelf, E., Gavriil, F., Kaspi, V., Vasisht, G., Chakrabarty, D., 2002, ApJ, 564, L31
- (5) Gotthelf, E., Halpern, J., Buxton, M., Bailyn, C., 2004., ApJ, 605, 368
- (6) Hulleman, F., van Kerkwijk, M., & Kulkarni, S., 2000, Nature, 408, 689
- (7) Hulleman, F., van Kerkwijk, M., & Kulkarni, S., 2004, A&A, 416, 1037
- (8) Israel, G., Stella, L., Covino, S., Campana, S., Angelini, L., Mignani, R., Mereghetti, S., Marconi, G. & Perna, R., 2004, in Young Neutron Stars and Their Environments, IAU Symposium 218
- (9) Kuiper, L., Hermsen, W. & Mendez, M, 2004, ApJ, 613, 1173
- (10) Martini, P., Persson, S., Murphy, D., Birk, C., Shectman, S., Gunnels, S., Koch, E., 2004, astro-ph/0406666
- (11) Mereghetti, S., Mignani, R., Covino, S., Chaty, S., Israel, G., Neuhäuser, R., Plana, H., Stella, L., 2001, MNRAS, 321, 143
- (12) Morii, M., Sato, R., Kataoka, J. & Kawai, N., 2003, PASJ, 55, L45
- (13) Persson, S., Murphy, D., Krzeminski, W., Roth, M., Rieke, M., 1998, ApJ, 116, 2475
- (14) Predehl, P., Schmitt, J., 1995, A&A, 293, 889
- (15) Sanbonmatsu, K., Helfand, D., 1992, AJ, 104, 2189
- (16) Stetson, P., 1987, PASP, 99, 191
- (17) Thompson, C. & Duncan, R., 1996, ApJ, 473, 322
- (18) Wachter, S., Patel, S., Kouveliotou, C., Bouchet, P., Özel, F., Tennant, A., Woods, P., Hurley, K., Becker, W., & Slane, P., 2004, ApJ, accepted (astro-ph/0408266)
- (19) Woods, P., & Thompson, C., 2004, in “Compact stellar X-ray sources”, eds Lewin, W., van der Klis, M.