11email: poretti@merate.mi.astro.it 22institutetext: Instituto de Astrofísica de Andalucía, C.S.I.C., Apdo. 3004, 18080 Granada, Spain 33institutetext: Department of Astrophysics, Astronomy and Mechanics, Faculty of Physics, University of Athens, Panepistimiopolis, 15784 Zografos, Athens, Greece 44institutetext: Beersel Hills Observatory, Laarheidestraat 166, 1650 Beersel, Belgium 55institutetext: Groupe Européen d’Observations Stellaires (GEOS), 23 Parc de Levesville, F-28300 Bailleau l’Evëque, France 66institutetext: Koninklijke Sterrenwacht van België, Ringlaan 3, 1180 Brussel, Belgium 77institutetext: Vereniging Voor Sterrenkunde, Belgium 88institutetext: Instituto de Astrofísica de Canarias, C/ Vía Láctea s/n, 38200 La Laguna, Tenerife, Spain 99institutetext: European Southern Observatory, Alonso de Cordova 3107, Santiago 19, Chile 1010institutetext: 24 Payne Street, Mt. Louisa, Townsville, Queensland 4814, Australia 1111institutetext: Nicolaus Copernicus Astronomical Center, ul. Bartycka 18, 00-716 Warsaw, Poland 1212institutetext: SETEC Observatory, Goddard, KS, USA
The double-mode nature of the HADS star GSC 00144-03031 and the Petersen diagram of the class ††thanks: Based on observations partly collected at S. Pedro Mártir and Sierra Nevada Observatories
The double–mode pulsation of GSC 00144-03031 has been detected when searching for COROT targets. A very large dataset composed of 4722 photometric measurements was collected at six observatories in Europe and America. There is no hint of the excitation of additional modes (down to 0.6 mmag) and therefore GSC 00144-03031 seems to be a pure double–mode pulsator, with a very short fundamental radial mode (=84 min). From photometry and evolutionary tracks it appears to be a Pop. I star with M=1.75 M☉, located in the middle of the instability strip, close to the Zero–Age Main Sequence. We also discovered other new double–mode pulsators in the databases of large–scale projects: OGLE BW2_V142, OGLE BW1_V207, ASAS3 094303-1707.3, ASAS3 000116-6037.0, NSVS 3234596 and NSVS 3324715. An observational Petersen diagram is presented and explained by means of new models. A common sequence connecting Pop. I stars from the shortest to the longest periods is proposed and the spreads in the period ratios are ascribed to different metallicities (at the shortest periods) and to different masses (at the longest ones).
Key Words.:
Methods: data analysis - stars: oscillations - techniques: photometric - stars: Sct – stars: individual: GSC 00144-030311 Introduction
The double–mode High Amplitude Delta Scuti (HADS) stars have been considered for a long time similar to double–mode Cepheids, i.e., evolved stars pulsating in the first two radial modes only. A remarkable exception is constituted by the AC And subclass, composed of stars pulsating in the first three radial modes (see Tab. 9 in Rodríguez 2003). Very recently, nonradial modes have been found combined with the radial ones, making these stars more similar to the low–amplitude, unevolved Sct stars which are quite common between the Zero–Age and the Terminal–Age Main Sequences (Poretti 2003). Therefore, HADS stars lost their definition of “simple double– or single–mode radial pulsators”. A natural question arises: do all the double–mode HADS stars display nonradial modes? To give a first answer to this question we investigated in detail the light curve of GSC 00144-03031, a new member of the class. Moreover, since other double–mode pulsators have been found in large–scale projects, it is timely to discuss the entire class by comparing the new, more robust observational results with the theoretical models.
The variability of GSC 00144-03031 was discovered when observing the field around HD 43587, a candidate primary target for the asteroseismic space mission COROT (COnvection, ROtation and planetary Transits; Baglin et al. 2002). The field around this star has been explored in the search for secondary targets (Poretti et al. 2005) and the STARE telescope 111http://www.hao.ucar.edu/public/research/stare/stare.html detected the variability of GSC 00144-03031 on the night of 16–17 March 2002 (JD 2452350). The STARE light curve clearly showed the effect of multiperiodicity in this large amplitude variable (0.40 mag).
2 Observations
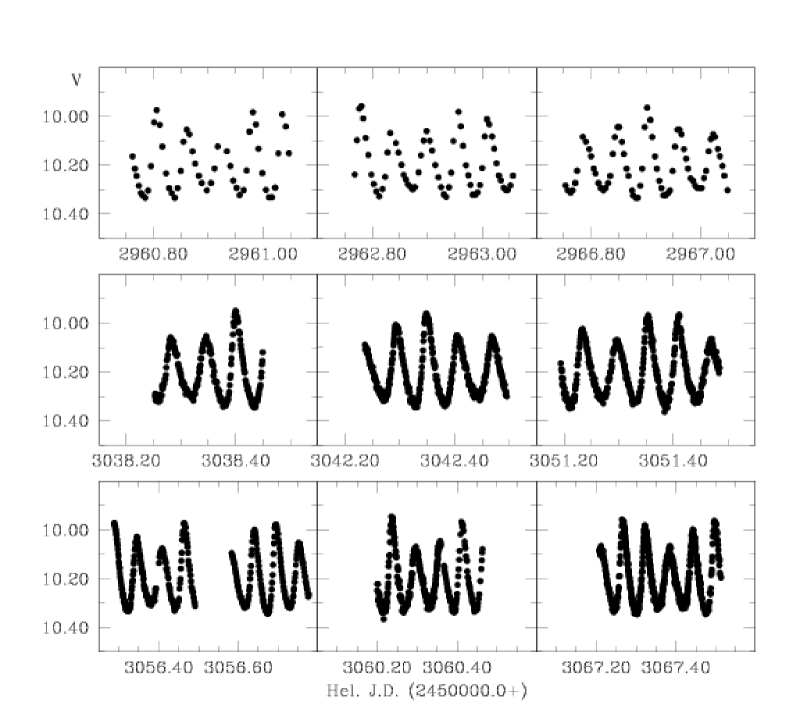
Owing to the recent growing interest in high–amplitude pulsators, new observations were planned to investigate the pulsational content of GSC 00144-03031 in detail. The first long subset was obtained at S. Pedro Mártir Observatory: 249 measurements were collected using the simultaneous Danish photometer mounted on the 1.5–m telescope, on five nights from November 14 to 23, 2003. The observations were performed with the scope of monitoring the brightest COROT targets and therefore the time sampling is not very dense (Fig. 1, upper row). HD 43913 was used as comparison star. Later in the same winter, dedicated intensive CCD monitoring was performed at Athens University Observatory: a 0.40–m telescope equipped with a SBIG ST-8 camera and a filter was used on eight nights from January 26, 2004 to March 2, 2004. GSC 00144-02970 was used as comparison star and GSC 00144-03140 as check star: both are located in the same field of view and the monitoring was practically continuous (Fig. 1, middle row). A third dataset was obtained at Beersel Hills Observatory (Belgium), using a 0.40–m telescope equipped with an ST10 XME CCD camera and a filter. The observations were performed on ten nights from February 16, 2004 to March 28, 2004 (Fig. 1, lower row). Other less conspicuous subsets were collected at SETEC Observatory (0.30–m telescope equipped with a ST–8 CCD camera and a filter, 168 measurements on one night), at Sierra Nevada Observatory (OSN; 116 data obtained at the 0.90–m telescope on three nights) and by MM (0.20–m telescope equipped with a Kodak 401 CCD camera and a filter, 483 measurements on four nights). The time baseline spans 133 d.
3 Frequency analysis
| Global dataset | SPM subset | BHO subset | AUO subset | |||||||||||
| Term | Freq. | Ampl. | Phase | Ampl. | Phase | Ampl. | Phase | Ampl. | Phase | |||||
| [d-1] | [mag] | [rad] | [mag] | [rad] | [mag] | [rad] | [mag] | [rad] | ||||||
| 17.21752 | 0.1383 | 0.535 | 0.136 | 0.50 | 0.138 | 0.53 | 0.139 | 0.53 | ||||||
| .00001 | .0003 | .003 | ||||||||||||
| 22.30760 | 0.0331 | 0.293 | 0.033 | 0.27 | 0.032 | 0.28 | 0.034 | 0.29 | ||||||
| .00003 | .0003 | .008 | ||||||||||||
| 0.0316 | 4.968 | 0.030 | 4.92 | 0.031 | 4.95 | 0.032 | 4.97 | |||||||
| 0.0135 | 4.724 | 0.013 | 4.65 | 0.013 | 4.65 | 0.014 | 4.75 | |||||||
| 0.0096 | 2.875 | 0.010 | 2.80 | 0.007 | 3.02 | 0.011 | 2.91 | |||||||
| 0.0084 | 3.205 | 0.008 | 3.21 | 0.008 | 3.22 | 0.009 | 3.20 | |||||||
| 0.0055 | 2.874 | 0.005 | 2.76 | 0.005 | 2.76 | 0.006 | 2.94 | |||||||
| 0.0046 | 1.350 | 0.004 | 1.07 | 0.004 | 1.26 | 0.005 | 1.40 | |||||||
| 0.0030 | 1.524 | 0.003 | 1.41 | |||||||||||
| 0.0026 | 1.223 | 0.003 | 1.13 | |||||||||||
| 0.0023 | 5.621 | 0.003 | 5.67 | |||||||||||
| Mean magnitude | 10.1980.0002 | |||||||||||||
| Residual r.m.s. [mag] | 0.0111 | 0.0078 | 0.0087 | 0.0128 | ||||||||||
| N | 4722 | 249 | 1285 | 2421 | ||||||||||
Observations obtained at two different longitudes (Europe and America) strongly reduced the daily aliasing effect. To perform the various steps of the frequency analysis, we used the least–squares power spectrum method (Vaniĉek 1971), allowing us to detect one by one the constituents of the light curve. After each detection, we refined the frequency values by applying the MTRAP code (Carpino et al. 1987): the refined values were introduced as known constituents in the new search. Such a procedure is particularly suitable for a multimode, high–amplitude pulsation as it keeps the relationships between the detected terms (i.e., 2, , …) locked. Moreover, it does not require any data prewhitening as amplitudes and phases of the known constituents are recalculated for each new trial frequency, always subtracting the exact amount of signal for any detected term.
As a first step, we analyzed each subset separately. The frequency analysis of the 249 data obtained at S. Pedro Mártir (SPM subset) clearly detected eight terms: =17.22 d-1, =22.31 d-1, 2, 3, , , 2, 2. The term with the smallest amplitude is the 2 one (0.0041 mag). The power spectrum does not show any well–defined structure after introducing these eight terms as known constituents, even though the peaks related to the and coupling terms (3, 3,4) are embedded among others, without standing out clearly. The amplitude of the noise slightly increases toward low–frequencies (0.0019 mag for 5 d-1, 0.0016 mag for 10 d-1), while it is quite small at high–frequencies (0.0009 mag for 4050 d-1). No difference was found in the frequency analysis of different colours; the rms residuals are 0.0170, 0.0094, 0.0084 and 0.0078 in and , respectively: the large scatter in –light is due to some instrumental problems with that photomultiplier tube.
The analysis of the 1285 measurements carried out at Beersel Hills Observatory (BHO subset) allowed us to detect the same terms as in the SPM subset. The amplitude of the noise is 0.0008 mag in the 0100 d-1 interval, with a small increase at low frequencies (0.0015 mag for 7d-1). The solution with eight terms leaves an rms residual of 0.0087 mag. Other combination terms are visible in the residual spectrum, slightly higher than the noise level. The magnitude differences between the comparison and checks star yield a standard deviation of 0.010 mag; the values on individual nights range from 0.005 to 0.014 mag.
The data obtained at Athens University Observatory (AUO subset) are the most homogeneous ones. Eleven terms have been detected: , , 2, 3, +, , 2+, 2 (i.e., those detected in the BH and SPM subsets) plus 3, 3, 4 (i.e., the terms embedded in the noise in the BH and SPM subsets). The solution with 11 terms leaves an rms residual of 0.0128 mag: it is higher than that of previous subsets, but the high number of datapoints (2421) allowed us to uncover terms with smaller amplitudes, by decreasing the amplitude of the white noise (0.0007 mag in the 0–100 d-1 interval). The observed scatter is similar to that observed for the check star GSC 0144-03140; the standard deviations range from 0.010 to 0.018 mag.
The three solutions of the or light curves are very coherent, detecting the same terms with very similar amplitudes and phases (Table 1; a cosine series has been used). Therefore, once the least–squares solutions for each subset were obtained, the mean magnitudes were aligned on the standard value =10.198. At this stage, the other subsets (SETEC, OSN and MM) were added: their samplings do not allow a reliable frequency analysis by themselves, but combined with the previous ones they supply a better frequency resolution. The alignments were made by applying the same procedure as above. No systematic difference was found between and data. Hence, we have at our disposal a global dataset composed of 4722 measurements, which constitutes a solid baseline for the careful search for small amplitude modes.
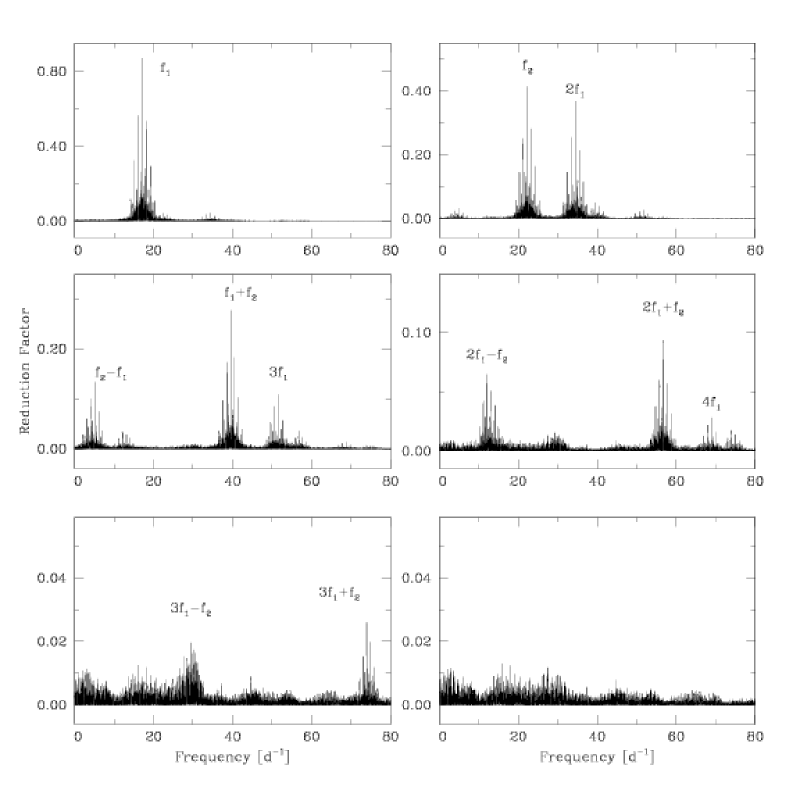
The analysis of the global dataset evidenced the large contribution of the term, i.e., 17.22 d-1 (Fig. 2, upper row, left panel). This periodicity is characterized by a strong asymmetric light curve since the harmonics 2 (upper row, right panel), 3 (middle row, left panel) and 4 (middle row, right panel) were detected when going further in the analysis. The second contribution in amplitude comes from the =22.31 d-1 term (upper row, right panel): this term has a sine–shaped light curve, since no harmonic was detected. The power spectra also show the contribution from the coupling terms between the two independent frequencies: the and terms (middle row, left panel), the and terms (middle row, right panel) and the and terms (lower row, left panel). The last power spectrum (lower row, right panel) does not show any reliable residual peak. The mean noise level is around 0.52 mmag in the whole 0–80 d-1 interval, ranging from 0.39 mmag in the 50–80 d-1 interval to 0.67 mmag in the 0–10 d-1 one.
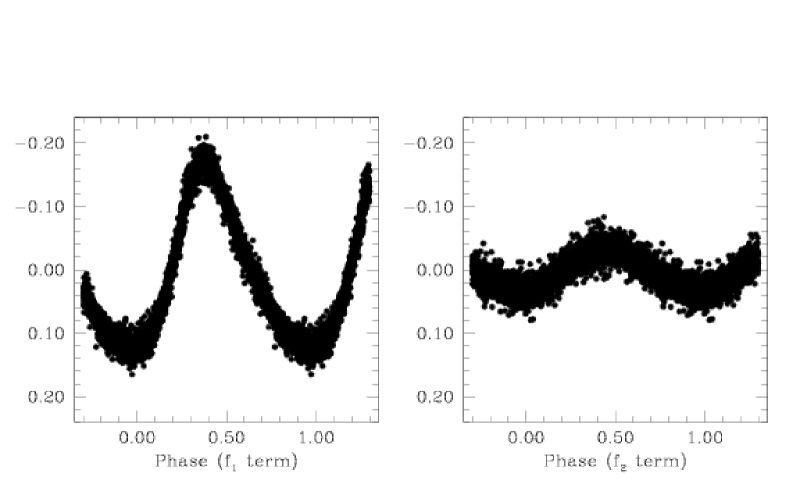
Table 1 also summarizes the least–squares solution of the global dataset. We also inspected the residual light curves to see if there were systematic deviations in some part of them, but we found nothing. Formal errors of the two independent frequencies were calculated following Montgomery & O’Donoghue (1999). Figure 3 shows the light curve of each independent term. We stress the fact that no additional independent term with an amplitude larger than 0.6 mmag was found: therefore, GSC 00144-03031 looks like an authentic pure double–mode HADS star.
4 The other double–mode HADS stars
| Star | F–mode | 1O mode | Ratio | Reference | |
|---|---|---|---|---|---|
| [d-1] | [d-1] | ||||
| GSC 02583-00504 | 19.3347 | 25.0066 | 0.77318 | Wils et al. (2003) | |
| SX Phe | 18.19358 | 23.37940 | 0.77819 | Coates et al. (1980) | |
| GSC 00144-03031 | 17.21752 | 22.30760 | 0.77182 | This paper | |
| OGLE BW2_V142 | 15.14210 | 19.45340 | 0.77837 | This paper | |
| BQ Ind | 12.1951 | 15.7686 | 0.77338 | Sterken et al. (2003) | |
| OGLE BW1_V207 | 11.68214 | 15.09791 | 0.77376 | This paper and Moskalik & Poretti (2002) | |
| AE UMa | 11.62560 | 15.03118 | 0.77343 | Pócs & Szeidl (2001) | |
| Macho 116.24384.481 | 11.50557 | 14.88981 | 0.77271 | Alcock et al. (2000) | |
| Macho 115.22573.263 | 10.89872 | 14.11001 | 0.77241 | Alcock et al. (2000) | |
| RV Ari | 10.73788 | 13.89913 | 0.77258 | Pócs et al. (2002) | |
| GSC 06047-00749 | 10.08286 | 13.06908 | 0.77150 | This paper | |
| Macho 114.19969.980 | 9.68320 | 12.52957 | 0.77283 | Alcock et al. (2000) | |
| Macho 119.19574.1169 | 9.35930 | 12.08875 | 0.77422 | Alcock et al. (2000); Moskalik & Poretti (2002) | |
| BP Peg | 9.1291 | 11.8329 | 0.77150 | Broglia (1959); Figer (1983) | |
| Macho 162.25343.874 | 8.98622 | 11.64074 | 0.77196 | Alcock et al. (2000) | |
| AI Vel | 8.96298 | 11.59958 | 0.77270 | Walraven et al. (1992) | |
| Macho 128.21542.753 | 8.32973 | 10.80603 | 0.77084 | Alcock et al. (2000) | |
| Macho 119.19840.890 | 7.96395 | 10.33167 | 0.77083 | Alcock et al. (2000) | |
| V575 Lyr | 6.86961 | 8.96848 | 0.76597 | Van Cauteren & Wils (2001; GSC 02118-00297) | |
| V703 Sco | 6.66838 | 8.67921 | 0.76832 | Oosterhoff (1966) | |
| Brh V128 | 6.519 | 8.497 | 0.76721 | Bernhard et al. (2004) | |
| HD 224852 | 6.335592 | 8.191974 | 0.77339 | This paper | |
| GSC 03949-00811 | 5.89097 | 7.68763 | 0.76629 | This paper | |
| GSC 04257-00471 | 5.753783 | 7.514040 | 0.76574 | This paper | |
| VX Hya | 4.47648 | 5.78972 | 0.77318 | Fitch (1966) |
| BW2_V142 | BW1_V207 | GSC 04257-00471 | ||||||||||
| Term | Freq. | Ampl. | Phase | Freq. | Ampl. | Phase | Freq. | Ampl. | Phase | |||
| [d-1] | [mag] | [rad] | [d-1] | [mag] | [rad] | [d-1] | [mag] | [rad] | ||||
| 15.14210 | 0.145 | 4.84 | 11.68214 | 0.138 | 6.13 | 5.75378 | 0.082 | 1.82 | ||||
| .00002 | .006 | .04 | .00001 | .004 | .03 | .00008 | .003 | .04 | ||||
| 19.45340 | 0.070 | 2.28 | 15.09791 | 0.022 | 0.04 | 7.51404 | 0.033 | 1.41 | ||||
| .00005 | .006 | .08 | .00008 | .004 | .17 | .00024 | .003 | .10 | ||||
| 0.047 | 0.80 | 0.049 | 3.88 | 0.027 | 1.55 | |||||||
| 0.029 | 4.99 | 0.027 | 1.02 | |||||||||
| 0.035 | 0.24 | |||||||||||
| Mean magnitude | =17.842.004 | =17.852.003 | =11.108.002 | |||||||||
| Residual r.m.s. | 0.042 mag | 0.034 mag | 0.040 mag | |||||||||
| HJD 2449234.4035 | HJD 2449249.8878 | MJD 2451428.0670 | ||||||||||
| N | 120 | 171 | 309 | |||||||||
| GSC 06047-00749 | HD 224852 | GSC 03949-00811 | ||||||||||
| Term | Freq. | Ampl. | Phase | Freq. | Ampl. | Phase | Freq. | Ampl. | Phase | |||
| [d-1] | [mag] | [rad] | [d-1] | [mag] | [rad] | [d-1] | [mag] | [rad] | ||||
| 13.06908 | 0.101 | 2.86 | 8.191974 | 0.116 | 0.15 | 7.68763 | 0.094 | 1.84 | ||||
| .00001 | .002 | .02 | .000006 | .001 | .01 | .00007 | .004 | .04 | ||||
| 10.08286 | 0.082 | 2.18 | 6.335592 | 0.086 | 5.88 | 5.89097 | 0.074 | 4.58 | ||||
| .00001 | .002 | .03 | .000005 | .001 | .01 | .00009 | .003 | .05 | ||||
| 0.019 | 3.71 | 0.026 | 4.94 | |||||||||
| 0.024 | 3.03 | 0.037 | 3.93 | 0.032 | 4.69 | |||||||
| 0.022 | 3.53 | 0.022 | 0.51 | |||||||||
| 0.017 | 3.16 | |||||||||||
| 0.008 | 2.48 | |||||||||||
| 0.009 | 0.75 | |||||||||||
| 0.009 | 1.45 | |||||||||||
| 0.007 | 1.54 | |||||||||||
| Mean magnitude | =12.012.001 | =10.131.001 | =11.128.003 | |||||||||
| Residual r.m.s. | 0.030 mag | 0.023 mag | 0.034 mag | |||||||||
| HJD 2449236.3120 | HJD 2453221.7986 | MJD 2451247.6966 | ||||||||||
| N | 670 | 1873 | 202 | |||||||||
The class of double–mode HADS stars has been enriched with various new entries provided by large–scale projects. In addition to GSC 00144-03031, we discovered new double–mode pulsators when performing systematic analyses of some public databases: OGLE (Optical Gravitational Lensing Experiment; Szymański 2005 and Udalski et al., 1997), NSVS (Northern Sky Variability Survey; Woźniak et al. 2004), ASAS (All Sky Automated Survey; Pojmanski 2002 and 2003) In some cases, we planned new photometric observations. The enlarged sample allows us to define better the characteristics of the double–mode HADS stars. As shown by the analysis of GSC 00144-03031, there are double–mode radial pulsators which do not show any hint of nonradial terms, even when the amplitude threshold is very small. On the other hand, Poretti (2003) showed how the radial double–mode pulsation can be also paired to a nonradial one.
Table LABEL:hads lists the stars where the and 1O modes have been detected. The formal errors on the frequency values are usually better than 1 d-1, which in turn implies an error on the ratio values better than 1. The new variables are described below.
4.1 BW2_V142 and BW1_V207
Moskalik & Poretti (2002) reported on the double–mode nature of some stars contained in the OGLE–I database. We note that BW1_V109Macho 119.19574.1169 (Alcock et al. 2000). The first least–squares solutions of the BW2_V142 and BW1_V207 light curves are given in Table 3. Poretti (2000) briefly reported on BW2_V142 just showing the light curves on the two terms (note that there is a misprint in Fig. 1 about the value of the term). GSC 00144-03031 and BW2_V142 fill the gap between shortest periods (namely those of SX Phe and GSC 02583–00504) and the group of HADS stars which pulsate with periods around 0.10 d.
4.2 GSC 03949-00811
The star is catalogued as NSVS 3234596 by Woźniak et al. (2004). The frequency analysis of the NSVS data allowed us to detect the =7.687632 d-1, =5.890971 d-1, and terms. The amplitude of the 1O–mode is larger than that of the –mode. The scatter is quite high (0.034 mag) and it was not possible to evidence other coupling or additional terms. The least–squares solution of the NSVS light curve is reported in Tab. 3.
4.3 GSC 06047-00749
Three subsets are available for this star: ASAS (ASAS3 094303-1707.3; Pojmanski 2002 and 2003), NSVS (NSVS 15731136; Woźniak et al. 2004) and a new one obtained by NB (0.20–m telescope equipped with a SBIG ST7e CCD and a filter, 402 measurements on four nights in June, 2004). The terms =13.0691 d-1, =10.0829 d-1 and were detected in all the subsets. The least–squares solutions supplied a smaller amplitude for the NSVS subset, since these data are in unfiltered light. The solution reported in Table 3 was obtained by combining the ASAS and the NB subsets.
4.4 HD 224852
The variability of HD 224852NSV 14800 was discovered by Strohmeier & Ott (1967) and, independently, by ASAS (ASAS3 000116-6037.0; Pojmanski 2002 and 2003). In the framework of our project, the star was observed by NB (1671 measurements on nine nights from October to December, 2004). The =8.1920 d-1, =6.3356 d-1, 2, , terms were detected in the ASAS subset. The observations carried out by NB are more dense and also the 2, 2 terms were detected. In spite of the small differences in the amplitudes between the two subsets, the frequency analysis of the combined dataset evidenced other coupling terms: 3, 2, . The search for new terms was stopped when the noise at the lowest frequencies became predominant. The 1O–mode has an amplitude larger than the –one and the light curves of both periods have a non–sinusoidal shape. Table 3 lists the least–squares solution of the combined dataset; the mean magnitude has been aligned to that of the ASAS subset. The solution with 10 terms leaves an rms residual of 0.023 mag; the amplitude of the noise is 3.3 mmag for 5 d-1, 1.6 mmag for 1050 d-1. Also in this case there is no hint of the excitation of additional modes.
4.5 GSC 04257-00471
The star is catalogued as NSVS 3324715NSVS 3361415 by Woźniak et al. (2004). We could detect the =5.7538 d-1, =7.5140 d-1, 2 and terms (Table 3). The amplitude of the 1O–mode is quite small, but the NSVS data are in unfiltered light and therefore damping is expected with respect to –light. We note that GSC 03949-00811 and GSC 04257-00471 fill an important gap toward long periods.


5 Modelling the double–mode HADS stars
The period ratios reported in Table LABEL:hads are plotted in the middle panel of Fig. 4. Most of the stars are grouped around and =0.772. It appears that the period ratio decreases toward the longest periods. However, some deviating points are observed at both extrema. In particular, the decrease in the period ratio values around appears much more rapid than the one calculated by Petersen & Christensen-Dalsgaard (1996; their Fig. 4) using the star sample available at that time. Therefore, we calculated a new set of theoretical models.
5.1 The theoretical sequences in the Petersen diagram
Stellar models were computed with the evolutionary code CESAM (Morel 1997). The numerical precision as well as the model mesh grid (2000 mesh points approximately) were optimized to compute oscillations. The equation of state CEFF (Christensen-Dalsgaard & Daeppen 1992) was used, also including the Coulombian correction to the classical EFF (Eggleton et al. 1973). A weak electronic screening in these reactions was assumed (Clayton 1968), accordingly to the evolutionary stages considered in this work. Opacity tables were taken from the OPAL package (Iglesias & Rogers 1996), complemented at low temperatures (K) by the tables provided by Alexander & Ferguson (1994). For the atmosphere reconstruction, the Eddington law (grey approximation) was considered.
The transformation from heavy element abundances with respect to Hydrogen [M/H] into concentration in mass assumes an enrichment ratio of and and for Helium and heavy element primordial concentrations, respectively. Convective transport was described by the classical Mixing Length theory, with efficiency and core overshooting parameters set to and , respectively. The latter parameter is prescribed by Schaller et al. (1992) for intermediate mass stars. corresponds to the local pressure scale-height, while and represent respectively the mixing length and the inertial penetration distance of convective elements.
Theoretical oscillation spectra were computed from the equilibrium models described above. For this purpose the oscillation code Filou (Suárez 2002) was used. The upper panel of Fig. 4 shows various sequences calculated from our models. The effects of changing the mass keeping [Fe/H]=0.00 dex are shown by the three solid lines. The other two lines show the effect of decreasing metallicity keeping M=1.80 M☉: from [Fe/H]=–0.50 dex (dashed line) to [Fe/H]=–1.00 dex (dotted line).
5.2 The evolutionary tracks
The physical parameters of HADS stars are summarized by McNamara (2000). photometry of GSC 00144-03031 (=10.198, =+0.138, =0.194, =0.849, =2.805; SPM and OSN observations described above) yields the following parameters: Eb-y=+0.005, MV=+2.00, Teff=7590 K, =3.98, [Fe/H]=–0.05 dex (TEMPLOGG method; Rogers 1995, Kupka & Bruntt 2001).
The connection between double–mode HADS stars is confirmed when considering the evolutionary tracks. The tracks have been calculated for [Fe/H]=0.00 dex, a value which can be applied to GSC 00144-03031, RV Ari ([Fe/H]=0.00 dex), BP Peg (), AI Vel () and VX Hya (0.05). Figure 5 shows the positions in the Teff–Mbol plane for these stars. The position of GSC 00144-03031 suggests M=1.75 M☉; such a position is similar to that of RV Ari. Note how the points in Fig. 5 describe a narrow instability strip for double–mode HADS stars.
6 Interpreting the Petersen diagram
The decreasing trends in the theoretical sequences are characterized by a long standstill between and (Fig. 4, upper panel). In this interval the values are more sensitive to the changes in metallicity than to changes in mass. On the other hand, small differences in mass produce strong differences in the sequences at the longest periods. We can compare these predictions with the Petersen diagram as determined from the stars listed in Table LABEL:hads.
6.1 Stars with =0.10 d
The period ratios cluster around 0.772 for . This point in the Petersen diagram is a well–defined one on the basis of the enlarged sample: the theoretical models have to match it. We calculated a large variety of models, but a satisfactory match is provided only for [Fe/H]=0.00 dex and 1.70M2.00 M☉. These constraints are the same obtained from the positions of double–mode HADS stars in the Teff– plane (Fig. 5). We note that the changes in metallicity shift the theoretical sequences toward higher period ratio values (Fig. 4, upper panel). Therefore, the small dispersion of the points related to stars with =0.10 d suggests a very similar metallicity (Fig. 4, middle panel). The period ratio value corresponding to AE UMa (Table LABEL:hads) is quite normal (0.7738), even though AE UMa is a slightly metal deficient star ([Fe/H]= dex). However, it is also less massive than other stars (M=1.49 M☉; McNamara 2000): the two effects balance each other and generate the normal period ratio value.
6.2 The shortest periods
The extreme values observed at the shortest periods refer to GSC 00144-03031, GSC 02583–00504, SX Phe and BW2_V142. If we admit that stars with and =0.772 constitute a homogeneous sample, GSC 00144-03031 and GSC 02583–00504 can be considered as the natural extension toward the shortest period of this sample. Indeed, the sequences with [Fe/H]=0.00 dex and masses in the 1.70–2.00 M☉ range match very well also these points (Fig. 4, solid lines in the upper panel). The high period–ratio values shown by SX Phe and BW2_V142 (crosses in the lower panel of Fig. 4) can be explained by a lower metallicity (Fig. 4, dotted line in the upper panel), which is a well–established fact for SX Phe ([Fe/H]=–1.40 dex, McNamara 2000), the prototype of Pop. II short–period pulsating stars. The same argument holds for BW2_V142, as this star is located in the galactic bulge. We can infer that the spread of the period ratio values at the shortest periods can be explained by different metallicities.
6.3 The longest periods
V575 Lyr, V703 Sco, BrhV128, GSC 04257-00471 and GSC 03949-00811 are the stars defining the rapid decrease at . This decrease is in agreement with the theoretical sequences and hence these stars are naturally linked to the ones at =0.10 d. However, the smaller the mass, the more rapid the decrease is (Fig. 4, solid lines in the upper panel). Therefore, only the M=1.90 M☉ models are able to match the points related to V575 Lyr, V703 Sco and BrhV128 (Fig. 4, open circles in the lower panel) and only the M=2.00 M☉ models are able to match the points related to GSC 04257-00471 and GSC 03949-00811 (Fig. 4, open squares in the lower panel).
Two long–period stars show period ratios higher than 0.770, i.e., HD 224852 and VX Hya (triangles in the lower panel of Fig. 4). Such values are admitted by models with M M☉ only. Indeed, VX Hya is a very luminous (see Fig. 5) and massive (more than 2.30 M☉, McNamara 2000) star. It is for sure a Pop. I star ([Fe/H]=+0.05 dex) and therefore we can rule out a connection with the Pop. II stars SX Phe and BW2_V142.
Therefore the spread in the period ratio values observed at the longest periods can be explained by differences in the masses. These differences in masses cannot be distinguished at , where the sequences are almost coinciding. We note that the rapid decrease in the values for M M☉ could explain some unusual ratio (as for example Macho 104.20389.1202, , =0.751; Alcock et al. 2000), without invoking the excitation of nonradial modes (see Fig. 5 in Poretti 2003).
7 Conclusion
The new observations of GSC 00144-03031 confirm the existence of pure radial double–mode pulsators. Thanks to large–scale projects it has been possible to discover several new double–mode HADS stars and to discuss the properties of the class. Detailed models have been calculated and compared with the observed period ratios and the physical parameters determined on the basis of photometry. Our models suggest that double–mode HADS stars constitute a very homogeneous class of variable stars. The Petersen diagram for these stars can be reconstructed using models having [Fe/H]=0.00 dex and M=1.70–2.00M☉. Different masses generate similar period ratios for 0.90, but theoretical period ratios predict differences for 0.90. More massive stars show higher values: this spread is actually observed in the Petersen diagram. The sequences with 1.90M2.00 M☉ match most of the observed period ratios in a very satisfactory way. On the other hand, short–period Pop. II stars show slightly higher period ratios owing to their different metallicity and they clearly deviate from the Pop. I sequence.
Acknowledgements.
The authors wish to thank the STARE team for the attribution of observing time to the COROT project. J. Vialle checked the English form of the manuscript. This publication makes use of data partially taken from the Northern Sky Variability Survey created jointly by the Los Alamos National Laboratory and University of Michigan. The NSVS was funded by the Department of Energy, the National Aeronautics and Space Administration, and the National Science Foundation. Part of the collected data were acquired with equipment purchased thanks to a research fund financed by the Belgian National Lottery (1999). PGN, KDG and VNM acknowledge financial support from the Special Account for Research Grants No 70/3/7187 (HRAKLEITOS) and 70/3/7382 (PYTHAGORAS) of the National and Kapodistrian University of Athens, Greece. RA and JAB acknowledge financial support from grants AyA2001-1571 and ESP2001-4529-PE of the Spanish National Research plan. JCS acknowledges the financial support from the Spanish Plan of Astronomy and Astrophysics, under project , from the Spanish “Consejería de Innovación, Ciencia y Empresa”, from the “Junta de Andalucía” local government, and from the Spanish Plan Nacional del Espacio under project ESP2004-03855-C03-01. EP acknowledges financial support from PRIN 2003 “Continuità e discontinuità nella formazione della nostra Galassia”.References
- (1) Alcock, C., Allsman, R., Alves, D. R., et al. 2000, ApJ, 536, 798
- (2) Alexander, D. R., & Ferguson, J. W., 1994, ApJ, 437, 879
- (3) Baglin, A., Auvergne, M., Catala, C., et al. 2002, in First Eddington Workshop, Cordoba 11-15 June 2001, ed. J. Christensen-Dalsgaard, & I. Roxburgh, ESA-SP, 485, 17
- (4) Bernhard, K., Pejcha, O., Proksch, W., Quester, W., Van Cauteren, P., & Wils, P., 2004, Inf. Bull. Var. Stars 5552
- (5) Broglia, P., 1959, MemSAIt, 30, 57
- (6) Carpino, M., Milani, A., & Nobili, A.M. 1987, A&A, 181, 182
- (7) Christensen-Dalsgaard, J. & Daeppen, W., 1992, A&A Rev., 4, 267
- (8) Clayton, D. D., 1968, Principles of stellar evolution and nucleosynthesis, New York: McGraw-Hill
- (9) Coates, D.W., Halprin, L., Heintze, G.N., & Thompson, K., 1980, Inf. Bull. Var. Stars 1756
- (10) Eggleton, P. P., Faulkner, J., & Flannery, B. P., 1973, A&A, 23, 325
- (11) Figer, A., 1983, GEOS Circ. on RR Lyr Type Variables, 6
- (12) Fitch, W.S., 1966, ApJ, 143, 852
- (13) Iglesias, C. A. & Rogers, F. J., 1996, ApJ, 464, 943
- (14) Kupka, F., & Bruntt, H., 2001, in “First COROT/MONS/MOST Ground Support Workshop”, ed. C. Sterken (Brussels: Vrije Uni.), 39
- (15) McNamara, D.H. 2000, in “Delta Scuti and Related Stars”, M. Breger and M.H. Montgomery Eds., ASP Conf. Series, vol. 210, p. 373
- (16) Montgomery, M.H., & O’Donoghue, D. 1999, Delta Scuti Star Newsletter 13, 28
- (17) Morel, P., 1997, A&AS, 124, 597
- (18) Moskalik, P., & Poretti, E. 2002, in “Radial and Nonradial pulsations as probe of stellar physics”, C. Aerts, T.R. Bedding, and J. Christensen-Dalsgaard Eds., ASP Conf. Series, vol. 259, p. 392
- (19) Oosterhooff, P.T., 1996, BAN, 18, 140
- (20) Petersen, J.O., & Christensen-Dalsgaard, J., 1996 A&A, 312, 463
- (21) Pócs, M.D., & Szeidl, B., 2002, A&A, 368, 880
- (22) Pócs, M.D., Szeidl, B., & Virághalmy, G., 2002, A&A, 393, 555
- (23) Pojmanski, G., 2002, AcA, 52, 397
- (24) Pojmanski, G., 2003, AcA, 53, 341
- (25) Poretti, E., 2000, in “The impact of large–scale surveys on pulsating star research”, L. Szabados and D.W. Kurtz Eds., ASP Conf. Series, vol. 203, p. 83
- (26) Poretti, E., 2003, A&A, 409, 1031
- (27) Poretti, E., Alonso, R., Amado, P.J., Belmonte, J.A., Garrido, et al., 2005, AJ, 129, 2461
- (28) Rodríguez, E., 2003, Rec. Res. Devel. Astron. & Astrophys., 1, 881
- (29) Rogers, N.Y., 1995, Comm. in Asteroseismology, 78, 1
- (30) Schaller, G., Schaerer, D., Meynet, G. & Maeder, A., 1992, A&AS, 96, 269
- (31) Sterken, C., Fu, J.N., & Brogt, E., 2003, in “Interplay of periodic, cyclic and stochastic variability in selected areas of the H-R diagram”, C. Sterken Ed., ASP Conf. Series, vol. 292, p. 121
- (32) Strohmeier, W., & Ott, H., 1967, Inf. Bull. Var. Stars 195
- (33) Suárez, J. C., 2002, PhD Thesis
- (34) Szymański, M., 2005, AcA, 55, 43
- (35) Udalski, A., Kubiak, M., & Szymański, M., 1997, AcA, 47, 319
- (36) Van Cauteren, P., & Wils, P., 2001, Inf. Bull. Var. Stars 5205
- (37) Vaniĉek, P. 1971, Ap&SS, 12, 10
- (38) Walraven, Th., Walraven, J., & Balona, L.A. 1992, MNRAS, 254, 59
- (39) Wils, P., Lampens, P., Robertson, C.W., & Van Cauteren, P., 2003, Inf. Bull. Var. Stars 5442
- (40) Woźniak, P.R., Vestrand, W. T., Akerlof, C. W., Balsano, R., Bloch, J., et al., 2004, AJ, 127, 2436