The near-UV pulse profile and spectrum of the pulsar PSR B0656+14††thanks: Based on observations with the NASA/ESA Hubble Space Telescope, obtained at the Space Telescope Science Institute, which is operated by the Association of Universities for Research in Astronomy, Inc. under NASA contract NAS5-26555.
We have observed the middle-aged pulsar PSR B0656+14 with the prism and the NUV MAMA detector of the Space Telescope Imaging Spectrograph (STIS) to measure the pulsar spectrum and periodic pulsations in the near-ultraviolet (NUV). The pulsations are clearly detected, double-peaked and very similar to the optical pulse profile. The NUV pulsed fraction is %. The spectral slope of the dereddened phase-integrated spectrum in the Å range is which together with the high pulse fraction indicates a non-thermal origin for the NUV emission. The total flux in the range Å is estimated to be erg s-1 cm-2 when corrected for mag. At a distance of 288 pc this corresponds to a luminosity erg s-1 assuming isotropy of the emission. We compare the NUV pulse profile with observations from radio to gamma-rays. The first NUV sub-pulse is in phase with the gamma-ray pulse marginally detected with EGRET, while the second NUV sub-pulse is similar both in shape and in phase with the non-thermal pulse in hard X-rays. This indicates a single origin of the non-thermal emission in the optical-NUV and in the X-rays. This is also supported by the observed NUV spectral slope, which is compatible with a blackbody plus power-law fit extended from the X-ray range, but dominated by the power-law component in most of the NUV range.
Key Words.:
pulsars: individual: PSR B0656+14, PSR J0659+14141 Introduction
The middle-aged pulsar PSR B0656+14 (PSR J0659+14
14)
was first discovered in the radio
by Manchester et al. (1978). The pulsar period,
0.385 s, spin-down
age, 1.1 years, and several other pulsar parameters
are given in Table 1.
This is one of the brightest isolated neutron stars
(NSs) in the X-ray sky (Córdova et al. 1989),
and also the optical counterpart
is brighter () than most
other middle-aged pulsars (Caraveo et al. 1994).
This made it possible to study the
optical pulsations of PSR B0656+14 (Shearer et al. 1997; Kern et al. 2003), which has previously only
been convincingly done for a few
much younger pulsars.
Owing to its relative brightness and proximity, PSR
B
0656+14 is one
of the most intensively studied isolated NSs in different
wavelength bands. The combined phase integrated spectrum of the pulsar,
from radio to gamma-rays (cf. Koptsevich et al. 2001), shows that
its radiation consists of two parts. One component is non-thermal emission from
the pulsar magnetosphere described by a power-law spectrum with
different spectral indices in different spectral ranges. The other component is thermal
blackbody like emission from the whole surface of the cooling NS and
from much smaller and significantly hotter polar caps of the pulsar.
While the thermal emission from the whole surface dominates in the extreme UV (EUV) and soft X-rays (e.g., Edelstein 2000; Greiveldinger et al. 1996; Zavlin & Pavlov 2004; De Luca et al. 2005), the emission at longer wavelengths is mainly of non-thermal origin and has a negative spectral slope (Pavlov et al. 1996; Pavlov et al. 1997; Koptsevich et al. 2001; Komarova et al. 2003). Ground-based and HST UV to near-IR photometry suggest that a main spectral change from the near-IR to EUV occurs somewhere between the B band and the far-UV (FUV).
| Observed | Derived | ||||||||||
|---|---|---|---|---|---|---|---|---|---|---|---|
| (ms) | ( | (cm-3 pc) | (∘) | (∘) | (mas yr-1) | (mas yr-1) | (Myr) | (G) | (erg s-1) | (pc) | |
| 384.9 | 5.50 | 14.0 | 201.1 | 8.3 | 0.11 | ||||||
| aPulsar period on MJD 51687.0 from Kern et al. (2003). | |
|---|---|
| bPulsar proper motion and parallax based distance from Brisken et al. (2003). |
Here we report on time-resolved HST STIS NUV-MAMA prism spectroscopy of PSR B0656+14 in the near-UV (NUV). This is the first time the pulse profile of PSR B0656+14 has been revealed in the UV. The detection of UV pulsations from another middle-aged pulsar, Geminga, and the younger Vela-pulsar was very recently reported by Kargaltsev et al. (2005) and Romani et al. (2005), but was previously only obtained for the Crab pulsar (NUV, Gull et al. 1998; FUV, Sollerman et al. 2000). In this paper we study the properties of the NUV emission of PSR B0656+14 and compare them with available data in other wavelength ranges. We describe our observations and data reduction in Sect. 2. The results are discussed in Sect. 3, and we then draw our conclusions in Sect. 4.
2 Observations and data analysis
2.1 Observations
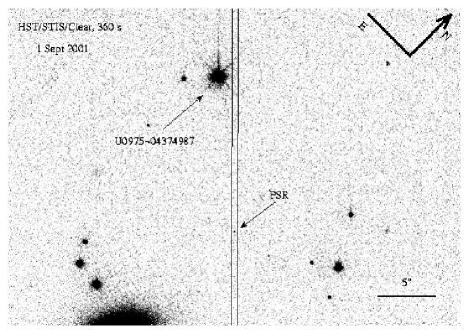
Time-resolved spectroscopy of PSR B0656+14 in the near-UV ( Å) range was performed with the HST/STIS during two visits in fall 2001 using the UV PRISM, the 52″05 slit and the NUV MAMA detector in TIMETAG recording mode. The PRISM mode was used because of the very low pulsar flux. The relative time resolution was 125s. Accurate target coordinates were obtained from earlier WFPC2 images. The target acquisition was performed using a B=17.9 field star, U0975-04374987, which is positioned 139 away from the pulsar (Fig. 1). We requested and received two visits, with the first being on 1 September and the second on 16 November. The slit position angle was PA=°.3 east of north during the first visit and °.45 during the second visit. These position angles allowed us to avoid any contamination of the pulsar flux by a faint extended background object only 1″ north of our target (Koptsevich et al. 2001; Komarova et al. 2003) as well as to exclude other nearby objects (Fig. 1). The two visits also allowed initial data evaluation and checks to ensure proper astrometry had been used. Details of the individual science observations are listed in Table 2.
| Start Time | Exp. Time | Mode |
| (MJD) | (s) | |
| 52153+ | Visit 1: 01 September | 2001 |
| 0.9207267 | 120.03 | STIS CCDa |
| 0.9406226 | 1060.0 | NUV MAMAb |
| 0.9866874 | 2900.2 | NUV MAMA |
| 1.0540379 | 2830.2 | NUV MAMA |
| 52229+ | Visit 2: 16 November | 2001 |
| 0.4670000 | 120.0 | STIS CCDc |
| 0.4736552 | 1800.0 | NUV MAMA |
| 0.5277756 | 2900.2 | NUV MAMA |
| 0.5945344 | 120.0 | STIS CCDc |
| 0.6011900 | 2310.2 | NUV MAMA |
| 0.6614096 | 2900.2 | NUV MAMA |
| 0.7287130 | 2850.2 | NUV MAMA |
| The exposures were obtained to provide the composite |
| image in Fig. 1. |
| All NUV-MAMA exposures were done using the PRISM |
| and the 52″05 aperture in the TIMETAG mode. |
| Exposures taken through the 52″05 aperture. |
The initial visit, three orbits in length, began with normal acquisition plus three STIS/CCD clear aperture images, each with 120 s exposure time, for a control image of the pulsar position. Figure 1 shows the composite field image with the 52″05 aperture boundaries inscribed. An internal lamp-illuminated image of the 52″05 slit was then recorded, and then the pulsar was viewed through the same aperture by the CCD to confirm that the pulsar was well-centered in the slit. This also precisely determines the pulsar position for the prism dispersion wavelength reference. The remainder of the first visit was allocated to three science exposures with the PRISM and NUV MAMA detector (Table 2). Internal WAVECAL exposures were interspersed between science exposures to ensure good reference for wavelength scale. The total UV PRISM science exposure time in the first visit was 6790 s.
The second visit was five orbits long. CCD images of the pulsar viewed through the slit were performed at the beginning of the first and the third orbits to check for any target or image drift internal to the telescope, but no such drift was detected. Five TIMETAG exposures, one during each orbit, were recorded during 12760 s (Table 2). The total TIMETAG science exposure time for the two visits was thus 19.55 ks. Additional information can be obtained through the HST archive111archive.stsci.edu under GO program 9156222presto.stsci.edu/observing/phase2-public/9156.pro.
2.2 Data reduction
2.2.1 Extraction of the Spectrum
All science exposures for each visit were co-added. The spectrum was then extracted and calibrated using the STIS CALSTIS pipeline tasks with a 7 pixel wide extraction slit (0013/pix). The backgrounds were extracted with a 7 pixels wide slit centered 20 pixels above and below the center of the pulsar spectrum. The associated wavecals recorded between science exposures were used to adjust the zeropoint of the wavelength scale. The two extracted spectra were then registered and averaged with weights scaled to the total exposure times for each visit. As the PRISM dispersion increases with decreasing wavelength and the detector sensitivity falls, we binned the flux below 2000 Å in 4 pixel bins. Between 2000 Å and 2300 Å, the binning was for 2 pixels and above 2300 Å, the data were left at the original PRISM resolution. This resulted in bins from Å in the blue to Å towards the red. The detector sensitivity and prism dispersion cut the sensitivity considerably below 2000 Å, but in the range Å the pulsar is detected with S/N per bin. The NUV MAMA detector is the dominating source of the background and the total sky+detector background was 700 and 3600 counts for the 1st and 2nd visits, while the signal+background was 1200 and 5000 counts, respectively.
2.2.2 Generation of the Pulse Profiles
The pulse profile analysis was done with STIS Instrument Development Team tools designed originally for testing the TIMETAG mode of the MAMA detectors (Gull et al. 1998). These tools are very similar in function to the STSDAS/STIS routines. Both sets of software have been used on the Crab pulsar data by Gull et al. (1998) and by Sollerman et al. (2000) and provide very similar results. The pulse profile was determined for each visit by concatenating the time-tagged events for each PRISM science exposure. Event times were corrected for the Earth’s motion around the Sun and for HST’s motion around the Earth using the definitive orbital ephemeris extracted from the HST archive. The orbital position was tabulated at one minute intervals and was determined by cubic-spline interpolation for each event.
The pulse period was determined from the data stream by the following
process. All events within a rectangular patch centered on the pulsar
spectrum were selected. Likewise, we selected all events in background patches
above and below the pulsar spectrum.
The pulse period was determined by
maximizing the RMS of the pulse profile of the target events
(see Sollerman et al. 2000).
For the two visits, the computed periods are:
Visit 1: 0.384902 s
Visit 2: 0.384903 s
This is in excellent agreement to within the last digit with
the radio pulsar period (Table 1).
Using the
ephemeris from Kern et al. (2003) we obtain:
Visit 1: 0.3849028 s
Visit 2: 0.3849031 s
at the epochs of our observations.
The measaured period is also in agreement
with earlier radio observations presented by Taylor et al. (1993)
and Chang & Ho (1999), and there is thus no evidence for glitches in PSR B0656+14 over
the last 16 years.
This also ensures us that the obtained pulse profile is correct.
To increase the
S/N, the data were binned into phase bins at intervals 1/16th that of
the pulse period. The background data were likewise binned, but showed
no structure with phase. We then subtracted
the combined
background average bin count.
The TIME-TAG mode provided relative time resolution of 125 s,
but absolute time determination is not known to better
than one second due to design limitations of the STIS computer timing
updates.
Internal clock stability is sufficient to ensure good
time stability from orbit to orbit, even up to several days apart, but not for a ten week interval. We were thus forced
to use the pulse profile shapes in the NUV and in the optical to phase align the two visits and to determine the NUV
pulse position with respect to the radio pulse (see Sect. 3.1 and 3.2).
3 Results and Discussion
3.1 The NUV pulse profile
The background subtracted spectral integrated pulse profiles obtained from the data of visits 1 and 2 are shown in the top and middle panels of Fig. 2, respectively. While the pulsations in the first visit are only significant at the level, the significance of the pulsations in the second, longer visit is . The pulse profile contains two sub-pulses whose maxima are separated by in phase
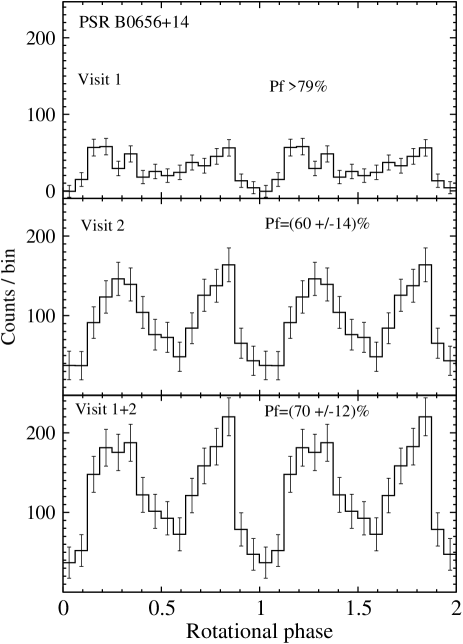
and are connected by an emission “bridge”. The shape of the first sub-pulse is rather symmetric, while the second sub-pulse is characterized by a linear flux increase in its leading part as well as by a sharp edge in the trailing part. This sharp drop and the bridge can also be seen in the first visit profile. We have used these features to align both pulse profiles in phase and combined them. The result is shown in the bottom panel of Fig. 2. The significance of the pulsations increased in the combined profile to .
We cannot exclude the presence of a persistent (or a weakly variable) flux component from the pulsar in the NUV range. As shown in Fig. 2, the estimated pulse fraction Pf (the ratio of the number of counts above the minimum of the profile to the total number of counts) is in the range representing a confidence interval based on count statistics. The persistent flux contribution into the pulse integrated flux is thus within the range. The lower boundary of this uncertainty range is compatible with the published upper limit % in the optical range (Kern et al. 2003).
3.2 Pulse profiles from the radio to gamma-rays
The shape of the observed NUV double pulse profile is very similar to what is seen in the optical range by Kern et al. (2003). This supports a single emission mechanism being responsible for the emission in both ranges. We note that the Kern et al. (2003) pulse profile was actually very different from the optical pulse profile for PSR B0656+14 earlier reported by Shearer et al. (1997). Kern et al. (2003) discussed whether this large discrepancy could be due to differences in pass bands, or due to a pulse profile variation with time. Our NUV profile clearly supports the findings of Kern et al. (2003) and disfavours the explanations to accomodate the earlier profile by Shearer et al. (1997).
The optical pulse profile by Kern et al. (2003) was obtained with absolute timing which allowed a phase alignment between the optical and the radio pulse profiles. The same was done for X-ray data obtained with the Chandra and XMM-Newton observatories (Pavlov et al. 2002; Zavlin & Pavlov 2004; De Luca et al. 2005), and for gamma-ray data obtained with EGRET (Ramanamurthy et al. 1996). We have used the similarity of the optical and NUV profiles to align our data with the radio pulse and to compare its absolute position in phase and morphology with the available data in a wide spectral range, from radio through gamma-rays (Fig. 3).
In the radio (Gould & Lyne 1998) the pulsar has a sharp single pulse with a width of about 0.2 of the NS rotational period (Fig. 3a). In the soft X-rays it instead displays shallow (Pf%) pulsations with a sine-like light curve. It has a single broad maximum per pulsar period, typical for the thermal emission from the surface of a NS with non-uniform temperature distribution over the surface (Fig. 3d). This is completely different from the optical and NUV profiles (Figs. 3b–c) and underline the difference in the emission mechanisms dominating in the optical-NUV (non-thermal) and in the soft X-rays (thermal). However, in the smooth light curves in soft X-rays one can discover small, but significant, features approximately coinciding in phase with the positions of the NUV sub-pulses (Figs. 3c and 3d–g). This can be more easily seen in the zoomed examples of the X-ray profiles (Fig. 4, see also Pavlov et al. 2002 and Zavlin & Pavlov 2004). With increasing photon energy, where the thermal emission is assumed to be dominated by the pulsars hot polar caps, the maximum of the X-ray profile is shifted toward the position of the 2nd NUV sub-pulse (Fig. 3g). However, this emission can not contribute significantly to the NUV because the hot spot area is too small ( km, De Luca et al. 2005). In the hard X-rays (Fig. 3h), where the spectrum is dominated by a non-thermal magnetospheric component, both the position and the morphology of the profile is similar to that of the 2nd NUV sub-pulse. The counterpart of the 1st NUV sub-pulse is not observed at the low S/N available
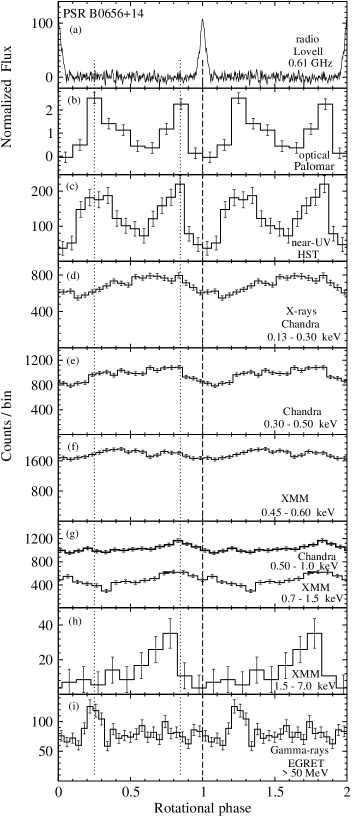
in the hard X-ray range, while it coincides in position with the gamma-ray pulse marginally detected with the EGRET (Ramanamurthy et al. 1996). The pulsar has not yet been reliably detected in the intermediate energy range between the hard X-rays and gamma-rays. Available RXTE observations obtained in the 15-250 keV range provide only an upper limit on the pulsar flux and a very uncertain pulse profile (Chang & Ho 1999).
To summarize, the observed profiles suggest that the pulsed emission outside the radio range is a sum of at least two components. One component, likely non-thermal emission, displays a two peak pulse profile which is clearly resolved in the optical and in the NUV. The other component, likely thermal emission, has a shallow broad sine-like profile with a single pulse per period. This component could potentially be partially responsible for the persistent and bridge emission seen in the NUV, since its maximum coincides with the NUV inter-pulse position. The counterparts of the optical-NUV sub-pulses can be resolved from the thermal background in soft X-rays. The 2nd NUV sub-pulse counterpart is clearly resolved in hard X-rays, while the 1st sub-pulse may be seen in gamma-rays. The coincidence of the position and morphology of the 2nd NUV sub-pulse and the X-ray profile supports a strong correlation of the non-thermal emission in these ranges, which has also been deduced from phase averaged spectral analysis (e.g., Koptsevich et al. 2001). The radio pulse is centered at the off-pulse emission in all other ranges.
3.2.1 Thermal nature of the bridge and persistent emission?
The variation of the thermal flux with the NS rotation may be understood in terms of anisotropic heat conduction through the strongly magnetized envelope of a cooling NS. The regions of the star with radial magnetic fields are hotter than the regions with tangential fields (e.g., Greenstein & Hartke 1983; Page 1995; Shibanov & Yakovlev 1996; Potekhin & Yakovlev 2001). The observed flux modulation in the soft X-rays is in agreement with a 14% modulation expected from a middle-aged cooling NS with a dipole magnetic field of a few times G (e.g., Potekhin & Yakovlev 2001). A single maximum per period with a relatively symmetric pulse profile suggests that only one magnetic pole is visible in the X-rays during the pulsar rotation. This is also compatible with the pulsar viewing geometry derived from the radio (Everett & Weisberg 2001) and optical (Kern et al. 2003) polarization measurements. However, the phase lag between the maxima in the radio and soft X-rays suggests that the hollow polar cap magnetospheric cone assumed to be responsible for the radio and optical emission must be strongly curved with height. Alternatively, the magnetic field surface structure is different from a simple centered dipole configuration. The latter is supported by the significant phase lag (De Luca et al. 2005) between the pulse maximum of the cool blackbody component from the whole surface of the NS and the hot blackbody component from the hot spots (Figs. 3d and 3g).
To investigate if the NUV bridge flux is dominated by the thermal emission we have applied a simplified model (Greenstein & Hartke 1983) assuming that the NUV and soft X-rays fluxes () vary with rotational phase () as , where , are the fluxes at the minimum and maximum of the pulse profile, respectively. These are assumed to originate from the surface regions with predominantly radial and tangential magnetic fields, and accounts for a small shift () of the profile minimum from the zero phase.
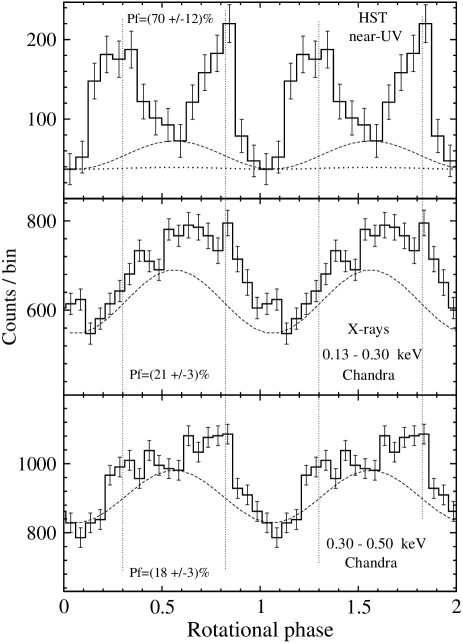
Figure 4 shows that this model provides a qualitative fit (dashed curves) to the soft X-ray profiles and to the smooth part of the NUV profile including the bridge. It also brings out the non-thermal counterparts of the NUV sub-pulses in X-rays. However, assuming a blackbody spectrum of the thermal emission with a maximum in the soft X-rays (e.g., Zavlin & Pavlov 2004), and that the temperature in this range, we can estimate from the X-ray model light curves with that the effective temperature variations averaged over the visible surface of the NS are %. The smooth flux variation over the NUV is larger: . Taking into account that any thermal NUV is in the Rayleigh-Jeans (RJ) part of the blackbody spectrum where , we obtain much larger temperature variations (50%) from the NUV fit. This contradiction with the X-rays can hardly be accounted for by any variations of the visible emitting area during the NS rotation (, De Luca et al. 2005). An extrapolation of the estimated X-ray temperature variations to the NUV (Fig. 4, dotted horisontal curve), shows that the pulsed bridge emission in the NUV can not be due to this mechanism, but the resulting NUV emission is compatible with the observed persistent flux. This means that the bridge emission is probably not thermal. It could instead result from overlapping of the two non-thermal sub-pulses.
To further investigate if the NUV persistent flux is thermal, we can compare its relative contribution to the total flux, %, with the expected contribution from the thermal cool blackbody component provided by extrapolation of the combined two blackbody power-law fit obtained in X-rays for the phase averaged spectrum (e.g., Koptsevich et al. 2001) to the NUV. Such a model is further discussed in Sect. 3.3 and shown in Fig. 5, and yields % thermal contribution at 2800 Å, where the PRISM throughput peaks. This is consistent with the unpulsed fraction in the NUV observations. For comparison, the expected blackbody contribution in the optical range at 5000 Å is several times smaller, %. In this region, Kern et al. (2003) were not able to detect any persistent flux at %. In this interpretation, we are actually resolving the surface of the NS during the off-pulse in the NUV. Future observations, allowing for phase resolved spectroscopy in the NUV, FUV, and optical as well as detailed comparison with the phase resolved spectroscopy in the X-rays, are necessary to confirm such an interpretation.
3.3 The near-UV spectrum
The combined phase averaged spectrum of the pulsar is shown in Fig. 5. The spectrum is rather noisy at the edges of the observed range, while in the range Å, where the NUV-MAMA/PRISM has its maximal throughput, the S/N is per bin. The spectral energy distribution is rather flat with the flux apparently increasing with increasing frequency. A power-law (PL; ) fit to the spectrum results in a spectral index of . This is indicated by the flat dotted line in Fig. 5. The slope may be slightly positive, but a negative index is also consistent with the data.
To check the absolute flux calibration we compared the NUV spectrum with the available broadband NUV photometric data obtained with the HST/FOC in the F342W and F195W bands (Pavlov et al. 1997). Within the uncertainties the spectral data are consistent with the photometric magnitudes.

The interstellar color excess toward PSR B0656+14 has been estimated to be in the range of mag with a likely value of mag (Pavlov et al. 1996; Kurt et al. 1999). The dereddened [] spectral index is . This is shown by the solid line in Fig. 5. Dereddening the spectrum by this amount gives an integrated flux in the range Å of erg s-1 cm-2. At a distance of 288 pc this corresponds to the luminosity erg s-1, assuming isotropy of the emission. Even for an extinction of mag, the one sigma limit of the spectral index remains smaller than unity. This is significantly lower than the index of the RJ part of the blackbody spectrum (), and strongly favors a non-thermal component for the bulk of the emission in the NUV range. To state this in a different way, to reach the RJ spectral index would require an extinction of , which is much outside the suggested range. Even the maps of Schlegel et al. (1998) only indicate throughout the entire Galaxy along this line-of-sight.
The observed NUV spectrum is actually compatible with the extension of the absorbed combined spectral fit, two blackbodies (BB) power-law (PL), of the X-ray data (the hot blackbody component does not contribute significantly in the NUV and is not shown in Fig. 5). Although such an extrapolation is uncertain (see, e.g., Kargaltsev et al. 2005), we note that the shape of the dereddened sum BB+PL (Fig. 5, thick dashed line) in the NUV is very similar to the observed NUV spectrum, although the PL clearly dominates in most of the NUV range. A non-thermal origin for the bulk of the NUV emission is also consistent with our analysis of the pulse profile. The change-over from the PL-component to the BB-slope seems to occur at the high frequency boundary of the observed NUV-range (Fig. 5). If this is true, we expect a higher spectral slope and a larger fraction of the persistent flux in the FUV range.
A possible absorption feature is hinted at 2400 Å (15.10 in Log ). The formal significance is low (, see Fig. 5), but a flux depression around this wavelength is present in both visits. If confirmed by future observations, such a feature could be interpreted as an electron/positron cyclotron line formed at G. Assuming the dipole surface field obtained from the pulsar spin-down rate (Table 1) this places the absorbing plasma at 220 km above the NS surface. This is roughly consistent with the minimum height ( km) for the optical emission estimated from the assumed critical synchrotron frequency by Kern et al. (2003). The faintness of the absorption feature suggests that the obscuring magnetospheric plasma is optically thin and cannot affect the radiation in X-rays. No spectral features or depressions have been detected in the soft X-rays. This disfavors interpretations of the phase lags between the maxima of the cool and hot BB profiles and the radio pulse based on existence of a magnetospheric “blanket” affecting the pulse shape (e.g., De Luca et al. 2005 and references therein). These phase lags could instead be the result of a strong inhomogeneity of the surface magnetic field of the NS. On the other hand, the spectral energy distribution of PSR B0656+14 in the optical/near-IR range appears to be non-monotonic and shows potential depressions (Koptsevich et al. 2001; Komarova et al. 2003). These features are deeper than the possible absorption line in the NUV. This could be explained by increasing the optical depth of the absorbing magnetospheric plasma with the wavelength. Optical spectroscopy and timing observations of the pulsar in different optical bands are needed to study the nature of the dips and their relation to the marginal absorption line in the NUV.
4 Conclusions
We have detected the near-UV pulsations of
PSR B0656
+14 using the STIS NUV-MAMA onboard the HST.
The pulse period we derive is in agreement with previous estimates.
The pulse profile is double-peaked with an inter-pulse bridge and is very
similar to the profile detected in the optical range by Kern et al. (2003).
Sharp pulses and a high NUV pulse fraction, %,
suggest a non-thermal origin of the
emission.
We have compared the NUV pulse profile with pulse profiles from the radio to gamma-rays. The first NUV sub-pulse is in phase with the marginal gamma-ray pulse, while the second NUV sub-pulse is similar in both shape and phase with the pulse detected in the hard X-rays. This favors a single origin for the non-thermal pulsed part of the emission from the optical to the X-ray range, as previously has also been seen from the broadband photometric observations in the optical and NIR (e.g., Koptsevich et al. 2001). The NUV sub-pulse counterparts can also be resolved from the shallow soft X-ray profiles dominated by thermal emission from the surface of the NS.
A simple model for the thermal X-ray flux, in terms of an anisotropic heat distribution of the NS surface, does not explain the pulsating NUV bridge emission, which is therefore likely non-thermal. However, any persistent flux in the NUV could contribute at the 30% level, which is potentially higher than the upper limit % measured in the optical (Kern et al. 2003). This is in qualitative agreement with the thermal flux from the abovementioned model, and we therefore argue that the non-pulsed NUV emission is due to the RJ part of the thermal emission component.
We have also measured the NUV spectrum of PSR B0656+14. The phase averaged spectrum is basically flat, . This slope is consistent with contributions from both a thermal component from the whole surface of the cooling NS and from a magnetospheric power-law component extrapolated from the X-rays. The main spectral change from the power-law dominating magnetospheric emission to the thermal RJ from the NS surface is likely to occur at the boundary between the NUV and FUV ranges. Preliminary reports on FUV emission from PSR B0656+14 indicate that the FUV is indeed thermal (Pavlov et al. 2004). This also agrees with our model where the non-pulsed NUV flux is thermal. We therefore predict a higher spectral slope and a lower pulse fraction in the FUV.
We note that a similar situation applies to the middle-
-aged
Geminga pulsar (Kargaltsev et al. 2005, their Figs. 7 and 10).
However, the younger Vela pulsar (Shibanov
et al. 2003; Romani et al. 2005) and the Crab pulsar
(Sollerman 2003) display a relatively flat
spectrum from the near-IR to UV range.
Moreover, the non-thermal emission of the young Crab pulsar and the Crab twin
PSR B0540-69 (Boyd et al. 1995) display pulse-profiles
that also does not change significantly from the optical
to the UV. The same seems to be true for Geminga
(Kargaltsev et al. 2005) and for Vela (Romani et al. 2005).
This could indicate that a unique mechanism, which apparently does not
strongly depends on pulsar age, drives the non-thermal pulsed emission in the optical and UV.
Acknowledgements.
We are grateful for help from Alexei Kop--tsevich in the initial phase of this study. Part of this research has made use of the database of published pulse profiles maintained by the European Pulsar Network. This work was supported by NASA and The Royal Swedish Academy of Sciences. YAS were supported by the RFBR (grants 03-02-17423, 03-07-90200 and 05-02-16245) and RLSS programme 1115.2003.2. The research of PL is further sponsored by the Swedish Research Council. PL is a Research Fellow at the Royal Swedish Academy supported by a grant from the Wallenberg Foundation. DL was supported in part by funding through GO proposal 9156. TG and DL were supported in part through the STIS Guaranteed Time Observations resources.
References
- Boyd et al . (1995) Boyd, P. T., van Citters, G. W., Dolan, J. F., et al. 1995, ApJ, 448, 365
- Brisken et al. (2003) Brisken, W F., Thorsett, S. E., Golden, A., & Goss, W. M. 2003, ApJ, 593, L89
- Caraveo et al. (1994) Caraveo, P. A., Bignami, G. F., & Mereghetti, S. 1994, ApJ, 422, L87
- Chang & Ho (1999) Chang, H., & Ho, C. 1999, ApJ, 510, 404
- Córdova et al. (1989) Córdova, F. A., Middleditch, J., Hjellming, R. M., & Mason, K. O. 1989, ApJ, 345, 451
- Edelstein et al. (2000) Edelstein, J., Seon, K., Golden, A., & Min, K. 2000, ApJ, 539, 902
- Everett & Weisberg (2001) Everett, J. E., & Weisberg, J. M. 2001, ApJ, 553, 341
- Greenstein & Hartke (1983) Greenstein, G., & Hartke, G. J. 1983, ApJ, 271, 283
- Greiveldinger et al. (1996) Greiveldinger, C., Camerini, U., Fry, W., et al. 1996, ApJ, 465, L35
- Gould & Lyne (1998) Gould, D. M., & Lyne, A. G. 1998, MNRAS, 301, 235
- Gull et al. (1998) Gull, T. R., Lindler, D. J., Crenshaw, D. M., et al. 1998, ApJ, 495, L51
- Kargaltsev et al. (2005) Kargaltsev, O. Y., Pavlov, G. G. Zavlin, V. E., & Romani, R. W. 2005, ApJ, 625, 307
- Kern et al. (2003) Kern, B., Martin, C., Mazin, B., &, Halpern, J. P. 2003, ApJ, 597, 1049
- Komarova et al. (2003) Komarova, V., Shibanov, Yu., Zharikov, S., et al. 2003, in Pulsars, AXPs and SGRs Observed with BeppoSAX and Other Observatories, 77
- Koptsevich et al. (2001) Koptsevich, A. B., Pavlov, G. G., Zharikov, S. V., et al. 2001, A&A, 370, 1004
- K (98) Kurt, V. G., Sokolov, V. V., Zharikov, S. V., et al. 1998, A&A, 333, 547
- De Luca et al. (2005) De Luca, A., Caraveo, P. A., Mereghetti, S., Negroni, M., & Bignami G. F. 2005, ApJ, 623, 1051
- Manchester et al. (1978) Manchester, R. N., Lyne, A. G., Taylor, J. H., et al. 1978, MNRAS, 185, 409
- Page (1995) Page, D. 1995, ApJ, 442, 273
- P (96) Pavlov, G. G., Stringfellow, G. S., & Córdova, F. A. 1996, ApJ, 467, 370
- P (97) Pavlov, G. G., Welty, A. D., & Córdova, F. A. 1997, ApJ, 489, L75
- Pavlov et al. (2002) Pavlov, G. G., Zavlin, V. E., & Sanwal, D. 2002, in Neutron Stars, Pulsars, and Supernova Remnants, 273
- Pavlov et al. (2004) Pavlov, G. G., Kargaltsev, O., Romani, R., & Zavlin, V. 2004, AAS/High Energy Astrophysics Division, 8
- Potekhin & Yakovlev (2001) Potekhin, A. Y., & Yakovlev, D. G. 2001, A&A, 374, 213
- Ramanamurthy et al. (1996) Ramanamurthy, P. V., Fichtel, C. E., Harding, A. K., et al. 1996, A&AS, 120, 115
- Romani et al. (2005) Romani, R. W., Kargaltsev, O., Pavlov, G. G. 2005, ApJ (accepted, see astro-ph/0503331)
- Shearer et al. (1997) Shearer, A., Redfern, R. M., Gorman, G., et al. 1997, ApJ, 487, L181
- Schlegel et al. (1998) Schlegel, D. J., Finkbeiner, D. P., & Davis, M. 1998, ApJ, 500, 525
-
Shibanov et al. (2003)
Shibanov, Yu. A., Koptsevich, A. B., Sollerman, J.,
& Lund-
-qvist, P. 2003, A&A, 406, 645 - Shibanov & Yakovlev (1996) Shibanov, Y. A., & Yakovlev, D. G. 1996, A&A, 309, 171
- Sollerman (2003) Sollerman, J. 2003, A&A, 406, 639
- Sollerman et al. (2000) Sollerman, J., Lundqvist, P., Lindler, D., et al. 2000, ApJ, 537, 861
- Taylor et al. (1993) Taylor, J. H., Manchester, R. N., & Lyne, A. G. 1993, ApJS, 88, 529
- Zavlin & Pavlov (2004) Zavlin, V. E., & Pavlov, G. G. 2004, Memorie della Societa Astronomica Italiana, 75, 458