H2 Pure Rotational Lines in the Orion Bar
Abstract
Photodissociation regions, where UV radiation dominates the energetics and chemistry of the neutral gas, contain most of the mass in the dense interstellar medium of our galaxy. Observations of H2 rotational and ro-vibrational lines reveal that PDRs contain unexpectedly large amounts of very warm (400-700 K) molecular gas. Theoretical models have difficulty explaining the existence of so much warm gas. Possible problems include errors in the heating and cooling functions or in the formation rate for H2. To date, observations of H2 rotational lines smear out the structure of the PDR. Only by resolving the hottest layers of H2 can one test the predictions and assumptions of current models.
Using the Texas Echelon Cross Echelle Spectrograph (TEXES) we mapped emission in the H2 v = 0-0 S(1) and S(2) lines toward the Orion Bar PDR at 2″ resolution. We also observed H2 v = 0-0 S(4) at selected points toward the front of the PDR. Our maps cover a 12″ by 40″ region of the bar where H2 ro-vibrational lines are bright. The distributions of H2 0-0 S(1), 0-0 S(2), and 1-0 S(1) line emission agree in remarkable detail.
The high spatial resolution (0.002 pc) of our observations allows us to probe the distribution of warm gas in the Orion Bar to a distance approaching the scale length for FUV photon absorption. We use these new observational results to set parameters for the PDR models described in a companion paper (Draine et al. 2005, in prep). The best-fit model can account for the separation of the H2 emission from the ionization front and the intensities of the ground state rotational lines as well as the 1-0 S(1) and 2-1 S(1) lines. This model requires significant adjustments to the commonly used values for the dust UV attenuation cross section and the photoelectric heating rate.
1 Introduction
A substantial fraction of the dense interstellar medium resides in clouds where far-ultraviolet photons emitted by hot stars dominate both the energetics and the chemistry of the primarily neutral gas (Hollenbach & Tielens 1999). In the dense ISM, the neutral photodissociation region (PDR) material includes both extended molecular clouds with only modest column densities (N10) (Plume et al. 1999; Jansen et al. 1995) and surface layers of clumps within higher column density molecular cores (Stutzki et al 1988). Within photodissociation regions, the material makes the transition from hot, ionized gas to cold, molecular gas as attenuation of the far-ultraviolet field increases farther from the cloud surface. As one moves from the ionization front deeper into the molecular cloud, hydrogen goes from atomic to molecular form and carbon goes from C+ to Co and then to CO (Tielens & Hollenbach 1985b; Black & van Dishoeck 1987). The rich chemistry of the photodissociated gas differs significantly from classical dark-cloud chemistry driven by cosmic-ray ionization (Sternberg & Dalgarno 1995).
The thermal balance in the photodissociation region is intimately connected with the radiative transfer for UV photons that drive the chemistry and energetics and with the chemical state of the material in different layers of the structure (Draine & Bertoldi 1999). The most important heating mechanisms include ejection of photoelectrons from dust grains (Bakes & Tielens 1994; Weingartner & Draine 2001, and refs therein) and the collisional deexcitation of H2 molecules initially excited by UV photons (Sternberg & Dalgarno 1989). Deeper into the regions, gas-grain collisions may also heat the gas. Fine-structure lines of neutral atoms or of singly ionized species with low ionization potential provide the cooling in the outer layers of the PDR while CO rotational lines cool the predominantly molecular inner regions. Quadrupole rotational lines of H2 can contribute to the cooling at intermediate depths.
The cooling of PDRs produces a broad variety of line and dust feature emission, each arising in a particular layer of the photodissociated structure and each with its own dependence on the density of the region and on the strength of the incident radiation field. From the outer, predominantly atomic layers, one sees emission in the far-IR fine-structure lines of [CII] (158 m) and [OI] (63 and 145 m), as well as lines of [FeII] and [SiII] at somewhat shorter wavelengths. The 3.3 m feature attributed to PAHs also appears to arise in this zone. Deeper into the cloud, carbon becomes neutral and the 370m and 609 m [CI] fine-structure lines become important emitters. Farther into the neutral zone, emission from a few molecules, notably CN and HCO+, is significantly enhanced over dark-cloud values. Because of the enhanced temperatures, high-J lines of CO can also trace the distribution of PDR material.
The rotational and ro-vibrational transitions of molecular hydrogen are particularly useful tracers of the properties of PDRs. In the outer portions of the PDR, H2 formed on dust grains is excited by UV photons. A radiative cascade through the ro-vibrational levels of the ground electronic state follows this fluorescent excitation and produces a distinctive pattern of emergent line strengths (Black & van Dishoeck 1987; Hasegawa et al. 1987). At densities greater than 104 cm-3, collisional de-excitation modifies the line ratios as it heats the gas (Sternberg & Dalgarno 1989; Luhman et al. 1997). Models show that self shielding allows hydrogen to make a transition from predominantly atomic to predominantly molecular form at a depth into the PDR where the temperature can be high enough to produce significant populations up to in the H2 ground rotational state (Draine & Bertoldi 1996). This warm molecular gas then produces strong emission in the mid-IR rotational lines of H2 and may even contribute significantly to emission in transitions arising from low J levels of the first excited vibrational state. The low critical density of the ground state rotational transitions makes ratios of mid-IR lines good probes of the temperature in the layers where they arise.
Unfortunately, the line emission from PDRs rarely arranges itself into the neat stratified pattern one might expect from a homogeneous, plane-parallel region. Furthermore, the extent of emission tracing the surface layers of clouds, particularly CII and H2 emission, is often larger than one would naively expect based on likely column densities and dust opacities. The usual explanation invoked to resolve this discrepancy is that the PDR material actually resides on the surface layers of clumps and that UV radiation reaches these surfaces by propagating through a much more tenuous interclump medium (Stutzki et al 1988; Howe et al. 1991; Meixner & Tielens 1993; Spaans 1996).
The first observations of PDRs in the H2 ground-state rotational lines produced a surprising result: the bulk of the H2 emission was coming from very warm gas. Observations of the 0-0 S(1) and S(2) emission from the Orion Bar implied temperatures of 400-1000 K (Parmar, Lacy, & Achtermann 1991). Lower spectral and spatial resolution ISO observations of PDRs in S140, NGC 7023, and NGC 2023 in a larger number of H2 rotational transitions are consistent with temperatures in a similar range (Timmermann et al. 1996; Fuente et al. 1999; Bertoldi et al. 2000). These observations have served as a testbed for models of the thermal balance and chemistry of PDRs (Draine & Bertoldi 1999; Bertoldi et al. 2000). The large number of transitions detected in the ISO observations help constrain the models. The poor spatial and spectral resolution of these observations, however, leave a number of questions open. The width and velocity of the H2 lines cannot be measured accurately enough to compare them to CO, CS, or HCN emission from farther into the PDRs. The large beams inevitably lead to an averaging of flux from different layers within the PDR structure. This averaging could destroy important information about the physics and structure of the PDR.
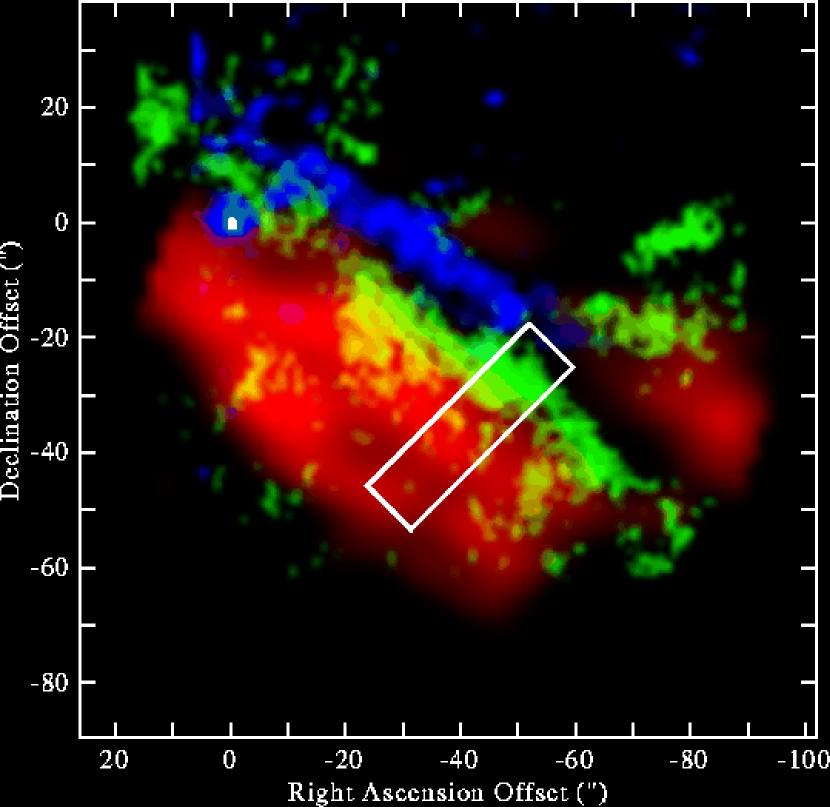
The PDR known as the Orion Bar lies 2′ southeast of the Trapezium stars in Orion at the interface of the HII region formed by the Trapezium and dense gas associated with the Orion Molecular Cloud. The nearly edge-on geometry of the Orion Bar (Marconi et al. 1998) lends itself well to the study of PDRs. Because of its favorable geometry and relatively close distance (450 pc, Hoogerwerf, de Bruijne, & de Zeeuw 2000), it is possible to observe stratification in the Orion Bar (Figure 1). The ionization front defined by the sharp edge of the radio continuum emission (Felli et al. 1993) lies immediately to the northwest of the maximum emission in the 3.3 m PAH feature (Bregman et al. 1994). Approximately 15″ southeast of the ionization front, there is a strong maximum in the distribution of H2 1-0 S(1) line flux (van der Werf et al. 1996). The peak of the high column density molecular ridge, as seen in CO, lies an additional 10″ to the southeast (see Fig.1, Tielens et al. 1993). In this work, we present new maps of the 0-0 S(1) and 0-0 S(2) transitions of H2 and selected observations of the 0-0 S(4) line toward the Orion Bar. These observations have both high spatial (2″) and spectral (4 km s-1) resolution. We compare these results to observations of the 1-0 S(1) line at similar spatial resolution (van der Werf et al. 1996). The high spatial resolution probes a critical scale in Orion (AV=1 at nH=3104 cm-3 corresponds to 10″ at the distance of Orion) and the spectral resolution of our observations is sufficient to resolve lines with the same width as the CO lines arising in the bar.
By obtaining high spatial resolution H2 pure-rotational line maps, in a region with nearly edge-on geometry, we hope to resolve the thermal and chemical structure of PDRs. We will look not only at the temperature distribution in the Orion Bar, but also the column densities of H2 and compare the distribution of H2 rotational emission to other tracers of gas in PDRs. We will use the data to test PDR models of the warm region at the H/H2 interface.
2 Observations and Data Reduction
We mapped the H2 v = 0-0 S(1), S(2), and S(4) lines at 17.03 m, 12.28 m, and 8.03 m (Table 1) toward the Orion Bar in 2002 December. We made the observations using the Texas Echelon Cross Echelle Spectrograph (TEXES, Lacy et al. 2002) on the 3m NASA Infrared Telescope Facility (IRTF). The spatial scale on the 2562 Si:As array was 0.35″ pixel-1. The spectral resolution of TEXES was determined from emission lines (C2H2 and C2H6) toward Titan, assumed to be unresolved, observed during the same observing run. Table 2 lists the slit width, length, resolving power, and total integration time for each line. We oriented the slit parallel to the Orion Bar ionization front, at a position angle of 45∘ or northeast-southwest.
With TEXES, the standard method for producing maps of spectral lines is to step the slit across the object and a portion of adjacent sky, taking a spectrum at each position, with the telescope secondary mirror held fixed (i.e., without chopping). For the S(1) and S(2) lines, we mapped the Orion Bar by stepping the telescope from northwest to southeast in 1/2 slit width steps (0.7″ for S(2) and 1″ for S(1)) to create 40″ long scans. The 0,0 position for the maps is at R.A. = 5h 35m 19.7s, Dec. = -5∘ 25′ 28.3″ (J2000.0) and the mapped region runs from 13″ northwest to 27″ southeast of this position (Figure 2). Spectra taken at the end of each scan, where no line emission is present, are then used as sky frames in the data reduction (Lacy et al. 2002). In Orion, we used the last 7″ of our scans, the positions farthest from the ionization front, for sky subtraction. In order to cover the same area with the shorter S(2) slit as we did for the S(1) line, we mapped the Bar at 12.28 m by making two scans offset by 2″ northeast-southwest with respect to the center of our 0-0 S(1) map. Since autoguiding is unavailable while using TEXES in scan mode, we made note of the telescope drift during the scan as the guide star passed through the boresight at the (0,0) position, and recentered the telescope on the boresight before each set of four scans.
We determined our absolute positional uncertainty by scanning the Becklin-Neugebauer object (BN) multiple times during our observations. We found that the maximum position drift for the step scans was 1.3″ over the duration of our observations. The relative positional uncertainty of our observations was determined from the offset of the guide star observed during each scan. The RMS drift was 0.7″ with a maximum of 2.1″. The main effect of these drifts would have been to smear out our beam. However, by noting these drifts as they occurred, we were able to correct for them during the summation that produced the final maps, thereby making the smearing negligible compared to our final 2″ to 2.5″ resolution. We therefore estimate the relative positional uncertainty in our 0-0 S(1) and S(2) maps to be less than 0.5″.
For the S(4) line, we took spectra at 6 different depths into the bar spaced 1.4″ apart. The slit positions for these observations are superposed on the map in Figure 3. We performed sky subtraction by nodding the telescope every 8-16 seconds between the source position and a reference position 80″ south.
We reduced the raw images of cross-dispersed spectra using the standard TEXES pipeline reduction program (Lacy et al. 2002). This program removes artifacts, flat-fields the frames using images of ambient and sky loads, extracts the spectra and removes telluric absorption. The telluric lines (principally from H2O, CO2 and CH4) are also used to provide a wavelength calibration accurate to 1 km s-1.
Unlike other visible and infrared spectrometers, TEXES can provide an absolute radiometric calibration of line intensities. The method makes use of observations of ambient and sky loads to compute the system throughput and gain, as well as the absorptivity of the atmosphere (Lacy et al. 2002). For maps of point sources or for line sources with extents significantly larger than the slit width, this radiometric calibration does not need to be corrected for slit losses.
We used maps of Gem and Tau to confirm the absolute calibration scale. Scans across Gem and Tau (at 12.3 m) yielded radiometric flux densities of 8.0 and 44.9 10-22 ergs cm-2 s-1 Hz-1, respectively. These values agree to within 5% with flux densities derived from the N Band magnitudes of Gem and Tau (Tokunaga 1984) extrapolated to 12.3 m (8.4 and 43.4 10-22 ergs cm-2 s-1 Hz-1).
Once properly calibrated spectra were available for each position along the 40″ scans (or, in the case of the S(4) line, each nod pair), we subtracted a linear baseline from each spectrum. The individual spatial scans were then shifted in position to correct for telescope drift and spatially coincident spectra (40 scans in S(2) and 80 scans in S(1)) were averaged together. To smooth the data, we resampled the S(1) data onto the same grid as our S(2) observations and smoothed both datasets with a 1.5″ Gaussian. The final spatial resolution along the slit for all 3 ground state H2 lines is 2.0″, while the resolution in the direction of our scan is 2.5″ for the 0-0 S(1) data and 2.0″ for the 0-0 S(2) data.
We determined the statistical uncertainty of the integrated intensities in the summed spectra at each position by calculating the rms noise integrated over a stretch of baseline adjacent to the line emission and comparable in width to the region containing most of the line flux. Table 2 lists the average uncertainty in the integrated intensities for the different lines. The highest signal to noise ratio for any individual 2″ resolution element is 58 for the 0-0 S(1) spectra and 86 for the 0-0 S(2) spectra.
3 Results
3.1 Maps of H2
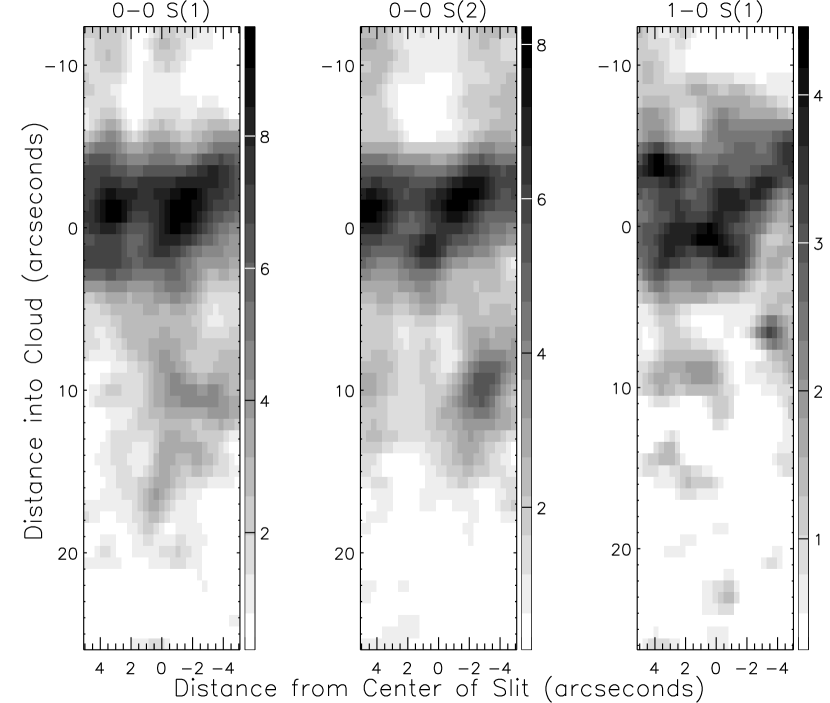
The first two panels of Figure 2 show the distribution of v=0-0 S(1) and S(2) intensity. The final panel shows the distribution of intensity in the 2.12 m v = 1-0 S(1) line (van der Werf et al. 1996) resampled onto the same grid at the same spatial resolution as our observations of the ground-state rotational lines. For all three, up is northwest. The dominant feature in the maps is the bright horizontal (northeast-southwest) ridge centered at y-2″. The overall thickness of the bright ridge is 8″ (0.017 pc). The brightness of the side of the ridge facing the ionization front and C Ori rises very steeply in the ground-state rotational lines. The cuts shown in Figure 4 indicate that the 0-0 S(1) and S(2) intensity increases from 10% to 50% of the peak value in 2″–3″, or barely more than a single resolution element. In two of the three cuts, the rise toward the peak of the ridge is much more gradual in the 1-0 S(1) line with emission present at 20-50% of the peak value 5″ in front of the peak.
There is remarkable agreement in the intensity distribution, not only between the 0-0 S(1) and 0-0 S(2) lines but also between the distributions in these lines from the vibrational ground state and the distribution of v=1-0 S(1) emission (Figure 2). The three H2 line maps agree to within the uncertainties about the location and width of the bright ridge, as well as the presence and extent of lower-level extended emission behind the ridge. Further, there is substructure within the bright ridge that is present in all three maps. There are numerous other small-scale features in the map, with sizes ranging from unresolved up to 10″. The smaller scale structure in the intensity distribution is also evident in the cuts shown in Figure 4. Along these cuts, displaced by only 3″ to the northeast or southwest, there are substantial differences at adjacent points.
Typical signal-to-noise for the integrated intensities along the bright ridge is better than 25 and the peak intensities are 9.6 and 8.2 10-4 ergs s-1 cm-2 sr-1 in 0-0 S(1) and S(2) respectively. Along the ridge, the line intensities do not drop below 60% of the peak The smaller scale structures behind the ridge have intensities that range from 10 to 50% of the peak. The weakest detected emission in both lines is 0.6 10-4 ergs s-1 cm-2 sr-1, centered around (+3,+10). The signal to noise in the individual 0-0 S(4) spectra is 20 at the brightest positions.
3.2 Spectral Properties
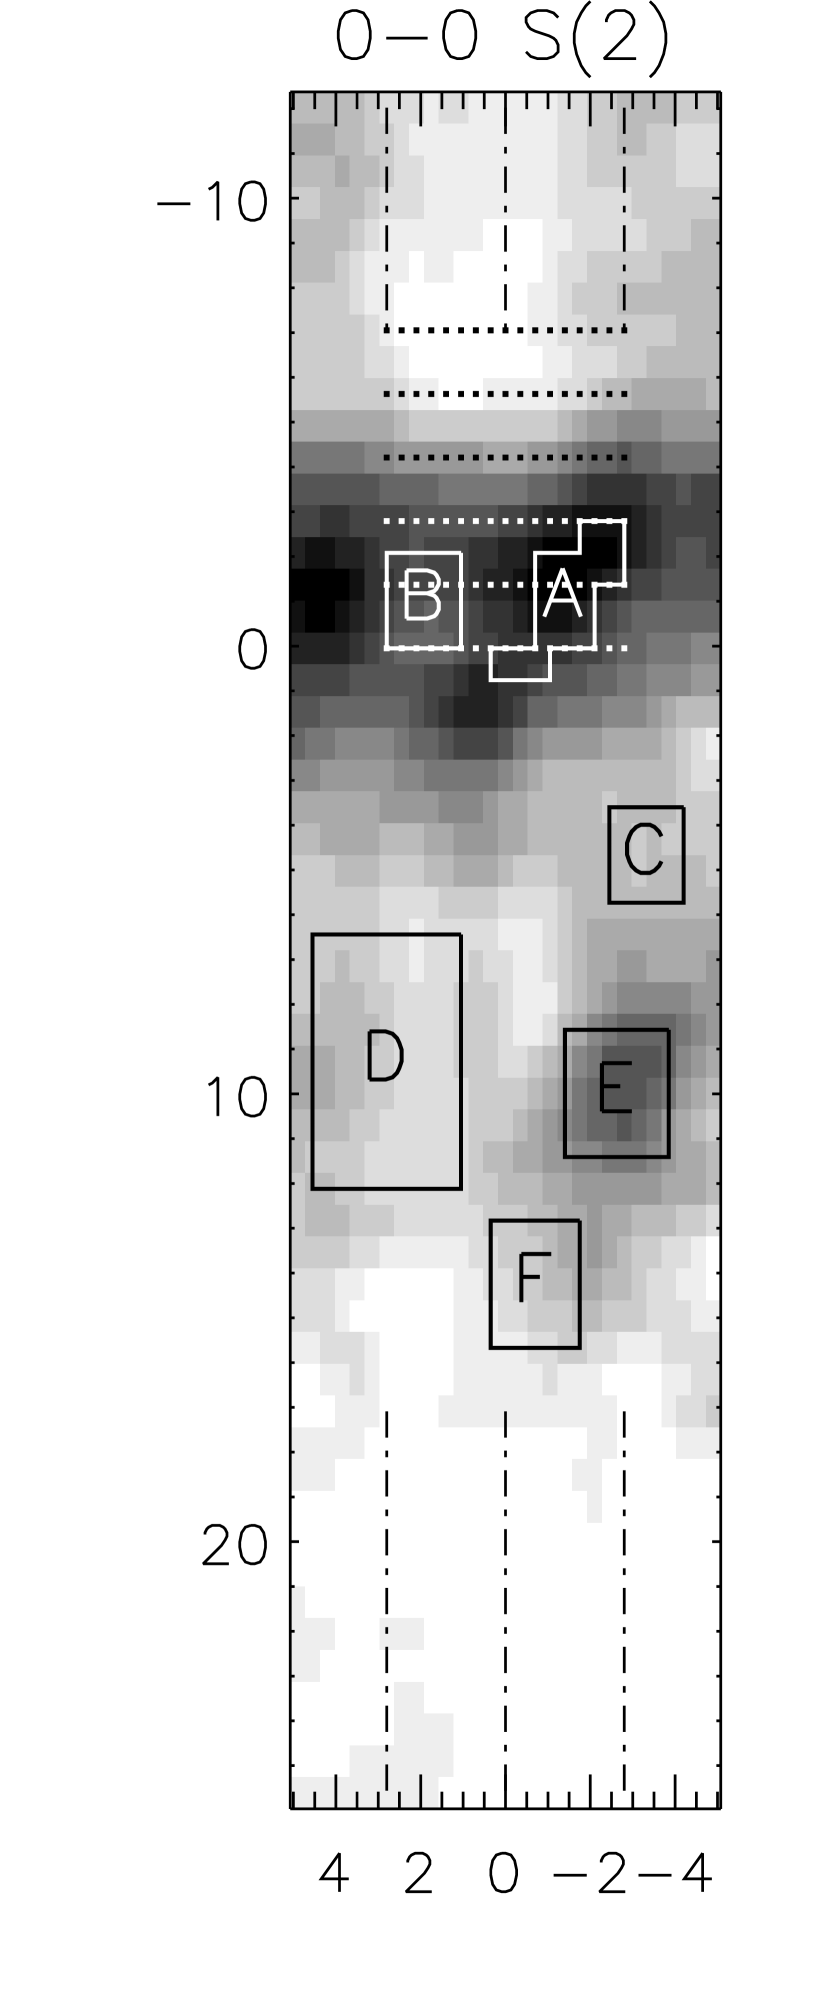
In order to study the details in the spectral line shapes and to compare line shapes from one part of the H2 emission region to another, we need to average over larger areas to improve the signal to noise. We have chosen a set of areas that encompass different morphological features in the maps of integrated line strength. We have not placed any of these areas along the leading edge of the bright ridge where the steep intensity gradients combined with even our modest pointing uncertainties make comparisons uncertain. Figure 3 shows the outlines of the areas and assigns labels to them. These labels appear then in Figure 5 next to the 0-0 S(1) and 0-0 S(2) (and, for areas A and B, 0-0 S(4)) spectra created by integrating over the designated areas. With the spectral resolution available with TEXES, we are able to resolve the lines. Measured FWHM line widths are 5-8 km s-1 (Table 3). Deconvolving the instrument profile and assuming that the intrinsic line shape is Gaussian, we derive physical FWHM line widths of 4-6 km s-1 (Table 3), in agreement with linewidths expected for optically thin, thermal gas at 1000 K. The instrumental profile, however, may be closer to a Lorenzian, which could imply line widths as low as 2-4 km s-1. Line widths for the 0-0 S(1) and S(2) transitions agree to within 1-2 km s-1, with neither line being systematically wider than the other, while physical linewidths for the 0-0 S(4) spectra are wider than the 0-0 S(1) and S(2) linewidths for areas A and B by 1.2 km s-1 and 1.5 km s-1. In the molecular gas deeper in the cloud, Hogerheijde, Jansen, & van Dishoeck (1995) and Batrla & Wilson (2003) find linewidths of 1.5 to 5 km s-1 (in NH3, CS, and isotopes of CO), although deconvolved widths of H13CN lines toward individual clumps are 1 km s-1 (Lis & Schilke 2003). Closer to the ionization front, Wyrowski et al. (1997) measured linewidths of 2 to 2.5 km s-1 for C91 emission. The radial velocity of the H2 emission (VLSR) is 10-11 km s-1, in agreement with published radial velocities for both molecular lines (NH3, CS, and isotopes of CO) and carbon recombination lines (Hogerheijde, Jansen, & van Dishoeck 1995; van der Werf et al. 1996; Batrla & Wilson 2003). Peak velocities of the H2 lines vary by no more than 2 km s-1.
3.3 Line Ratios and Temperatures
Density estimates for the H2 emission zone in the Orion Bar are 5-25 104 cm-3 derived from C91 observations (Wyrowski et al. 1997). At densities in this range, the upper states of the 0-0 S(1), S(2), and S(4) transitions should all be thermally populated (Mandy & Martin 1993; Bertoldi & Draine 1996). Table 4 lists line intensities and excitation temperatures derived from the 0-0 S(1)/0-0 S(2) line intensity ratios (assuming that foreground extinction is negligible and that the lines are optically thin) for the six areas shown in Figure 3 and the excitation temperature derived from the 0-0 S(4)/S(2) line intensity ratios for areas A and B. We use the ratio of the 0-0 S(1)/S(2) intensities, together with the measured 0-0 S(1) line intensity to derive the column density of warm molecular hydrogen toward regions A through F. We assume that the states are populated according to a thermal distribution, which for T 300 K implies an ortho-to-para ratio of 3. Even if the averaged regions contain cloud material with temperature gradients, these derived, single temperature LTE values provide a way of comparing aggregate properties in the different regions.
Derived excitation temperatures range from roughly 400 to 600 K. Along the bright ridge, the temperature varies between 400 and 500 K. The two areas in Figure 3 illustrate this with the bright part of the ridge (position A) having T[S(2)/S(1)]= 460 K while the fainter region along the ridge (position B) has a slightly lower temperature (430 K). The derived column densities at the two ridge positions are very similar ( cm-3, Table 4). T[S(4)/S(2)], however, is cooler in position A (503 K) than in position B (572 K). There is an apparent trend (with the exception of position F) toward higher temperatures at greater depth into the molecular cloud (farther from C).
Our mean temperature for the gas emitting the H2 rotational lines is similar to that derived by Habart et al. (2004) from ISO observations and by Parmar, Lacy, & Achtermann (1991). We find only a small overall range in 0-0 S(2)/S(1) temperatures and do not see the gradient with distance from C that was present at modest significance in the Parmar, Lacy, & Achtermann (1991) results. Parmar, Lacy, & Achtermann (1991) present spectra integrated along a 2″ 10″ slit oriented at the same position angle as our map but took data along a different cut through the ionization front. Their spectra sample the H2 distribution every 5″ perpendicular to the front. Our maps indicate that Parmar et al.’s high temperature point, which lies closest to the ionization front, is very sensitive to relative pointing errors because of the sharp intensity gradients. If the front position is indeed right at the leading edge of the H2 distribution, the second point in the earlier map may lie behind the brightest part of the H2 ridge.
Comparing our results to the 1-0 S(1) intensities derived from the maps of van der Werf et al. (1996), we find values of I(1-0 S(1))/I(0-0 S(1)) of 0.42 and 0.44 at positions A and B, respectively. Shifting the 1-0 S(1) line map by 1.5″ produces less than 10% changes in the line intensities at positions A and B. At position A, the v=2-1 S(1)/1-0 S(1) intensity ratio is (van der Werf et al. 1996). At the positions behind the ridge, I(1-0 S(1))/I(0-0 S(1)) varies from 0.07 to 0.65. Note, however, that the intensity calibration of the v=2-1 S(1) results is less reliable than the 1-0 S(1) intensities toward positions A and B. The total area mapped in v=2-1 S(1) by van der Werf et al. (1996) was only 40″ by 40″ . Unlike the mid-IR spectroscopic mapping results, the on and off line wavelengths were observed separately in the near-IR so that zero point offsets could occur that would have a stronger effect on the line calibration at points where the lines are weak. If, as appears to be the case, the intensities were set to zero at the edge of the field mapped in v=2-1 S(1), then any flux on scales greater than 40″ would be absent. This problem is less acute for the v=1-0 S(1) map both because the intensity distribution peaks more sharply and because the van der Werf et al. (1996) map of this line covers a considerably larger area. Usuda et al. (1996) also used Fabry-Perot imaging to determine the 2-1 S(1)/1-0 S(1) ratio. Although their spatial resolution of 8″ may fail to resolve some of the structure, their larger map area results in a more reliable flux ratio. The Usuda et al. (1996) v=2-1 S(1) map implies that the edges of the van der Werf et al. (1996) field lie at about the 50% level of the line intensity distribution. Given the observing and data analysis techniques, the two v=2-1 S(1) results are consistent with one another, but the Usuda et al. (1996) value for the 2-1 S(1)/1-0 S(1) ratio is more reliable. We therefore use their value, , for the 2-1 S(1)/1-0 S(1) intensity ratio. We discuss the observed H2 line intensity ratios in the context of a realistic model of the temperature structure in §4.
The formal uncertainties in the LTE temperatures, based on the signal to noise of our ground vibrational state H2 spectra are small. The maximum uncertainty in temperature was 40 K for the temperature derived from the 0-0 S(1)/0-0 S(2) line ratio in region D (Figure 3). Regions with brighter lines (areas A, B, & E) had much lower uncertainties (4-10 K). Registration and positional errors had a modest effect on the derived average temperatures. We shifted the 0-0 S(1) map by +0.7″ and -0.7″ (greater than our quoted position uncertainty of 0.5″). The maximum change in temperature due to these shifts was 80 K for temperatures derived from the 0-0 S(1)/0-0 S(2) line ratio for the summed spectra in region C. Typical changes in derived temperature from the 0-0 S(1)/0-0 S(2) line ratio due to a comparable position shift were 25 K. At the leading edge of the bright ridge, however, temperatures could change from 500 to 900 K with relative position shifts of 3″.
We do not correct for extinction in our derivation of temperature, as the effects of reddening are expected to be quite low. In Orion OMC-1, Rosenthal, Bertoldi & Drapatz (2000) find values of of 0.525, 0.527, and 0.441 for the 0-0 S(1), S(2), and S(4) lines respectively. Using these values for Aλ, and assuming AK/AV=0.112 (Rieke & Lebofsky 1985), we find that an error in T of 50 K corresponds to A20, for temperatures derived from the 0-0 S(1)/S(2) and 0-0 S(4)/S(2) line intensity ratios.
A single temperature cannot describe our observed line intensities (to within the uncertainties) for the pure rotational lines. The deviation from a single temperature fit becomes more severe as we include vibrationally excited lines. Predictions of the 1-0 S(1) line intensity based on the temperatures and column densities derived from the rotational lines for areas A & B underestimate the observed 1-0 S(1) line intensity by factors of 4 to 75. The enhanced 1-0 S(1) line intensities could be caused by a temperature gradient in the region of H2 emission or by fluorescent excitation of the vibrational lines. Clearly, more complex analysis of line ratios is necessary. We discuss the inputs and results of our PDR model analysis in the next section.
4 Discussion
4.1 Inputs to a PDR Model for the Orion Bar
The Orion bar is a particularly useful test site for PDR models because of its closeness (at 450 pc 2″=1.4 cm, Hoogerwerf, de Bruijne, & de Zeeuw 2000), its high gas density and strong incident UV field (leading to bright line and continuum emission), and its distinctive geometry. These favorable properties have inspired a significant number of observational studies over the past two decades which can provide valuable inputs into any model of the region. The key region-specific parameters in modeling photodissociation regions are the strength of the incident UV field and the density of the neutral gas as a function of distance from the front. In comparing the models to observations, it is also important to understand the source geometry, in particular the tilt of the source with respect to the line of sight.
The usual practice in modeling photodissociation regions has been to assume that the dust-related parameters in the models: dust opacity, photoelectric heating rate, and H2 formation rate, are fixed and to search through a family of models in an attempt to find the best match when the incident UV field and the density (often taken to be uniform) of the PDR are varied (Burton, Hollenbach, & Tielens 1990). Because the UV field incident on the Orion Bar and the pressure at the ionized boundary of the PDR are well constrained by observations, we can reverse the usual procedure, take the UV field and pressure as givens, and use Orion as a testbed for the dust-related parameters going into models of high density PDRs with high incident UV fields. In a companion paper (Draine et al. 2005, Paper II), we discuss this model study in detail. In the current work, we discuss the derivation of the initial conditions from observations and compare the results of our observational study to the best-fit PDR model derived in Paper II.
The dominant source of UV photons for the Orion Bar PDR is the O6 star C Ori. At the position of our H2 map, C Ori lies 120″ from the ionization front where the direction of the incident radiation is only 20 degrees from the normal to the front projected onto the plane of the sky. It is convenient to measure the intensity of the radiation incident at the ionization front by , the ratio of specific energy density at 1000 Å to the value = 4 ergs cm-3 Å-1 estimated by Habing et al. (1968) for the mean interstellar radiation field. Based both on simple geometric dilution and on the strength of the far-IR radiation emitted by the warm dust in the Orion bar after being heated by the UV and visible radiation from C Ori, the far-UV flux incident on the PDR is 3104 times the mean interstellar radiation field (Herrmann et al. 1997). Marconi et al. (1998) used observations of the OI 1.317 m line to infer the incident UV intensity at 1040 . If the PDR is inclined with cos= 0.1, where is the angle between the line of sight and normal to the PDR, the Marconi results imply = 2.9104. For all of the models explored in Paper II, we take = 3104 at the ionization front.
Ori C, A, and E combined have a 1–10 keV luminosity (Schulz et al. 2003). At a distance of cm distance, 1–10 keV X-rays from the Trapezium stars will contribute an ionization rate s-1 at the Bar. Lower energy X-rays from the Trapezium, and X-rays from young stars that are less luminous but are closer to the Bar will contribute additional ionization. In addition, the cosmic ray ionization rate may be enhanced in this region by nonthermal particle acceleration in stellar wind shocks. We adopt a nonthermal ionization rate s-1 for gas in the Orion Bar PDR, but we stress that our results do not depend sensitively on this rate. We note that McCall et al. (2003) inferred an ionization rate s-1 in the molecular gas toward Per.
Based on the emission measure derived from radio continuum observations (Felli et al. 1993), and determined from [S II] (Pogge et al. 1992), the thermal pressure at the ionization front cm-3 K. The gas has been accelerated away from the PDR, however, so the pressure in the PDR should be somewhat larger. For the PDR models of the Orion Bar, we have taken the total pressure to be uniform through the PDR at = 8107 cm-3 K. In most previously published PDR models dealing with H2 excitation (Black & van Dishoeck 1987; Sternberg & Dalgarno 1989; Burton, Hollenbach, & Tielens 1990), the assumption has been that turbulent or magnetic pressure dominate the gas pressure throughout the region and that an assumption of constant density is therefore reasonable. The Draine et al. (2005) models explicitly calculate density as a function of depth into the PDR assuming a constant pressure that includes a non-thermal contribution111The non-thermal pressure is taken to be , with . that is fairly small in the outer parts of the region. In the outer parts of the PDR, constant densities derived from older PDR models and various observations are generally consistent with the pressure value used in our models, albeit with a large spread. The densities derived by Wyrowski et al. (1997) from the C91 results (5–25 104 cm-3) are consistent with the assumed pressure if T1000 K in the carbon line formation region. Non-LTE excitation modeling of millimeter and submillimeter molecular line ratios is not dependent on PDR model results and yields densities ranging from a few 105 cm-3 to a few 106 cm-3 (Burton, Hollenbach, & Tielens 1990; Tauber et al. 1995; Hogerheijde, Jansen, & van Dishoeck 1995; Young Owl et al. 2000) in the gas farther behind the ionization front where molecular line ratios and brightness temperatures imply K. The higher densities are in good agreement with a virial analysis of the brightest HCN clumps in the molecular ridge (Lis & Schilke 2003).
The pressure assumed for our models is also consistent with densities derived by a second line of argument, based on geometry and the chemical stratification shown in older constant density models of PDRs. There is a clear stratification of emission zones, manifested by a shift in the observed location of the peak emission, as one goes farther from C into the PDR, albeit with some overlap of what should be, from a theoretical point of view, distinct regions within the PDR (Figure 1). Along a line perpendicular to the bright ridge in Figure 2, the ionization front lies at ″ (Felli et al. 1993). Within the neutral gas, there are successive emission zones for the FeII 1.64 m line (Marconi et al. 1998, ″), the 3.3 m PAH feature (Bregman et al. 1994, ″), the H2 rotational and ro-vibrational transitions (this paper, ″), submillimeter continuum emission (Lis et al. 1998, ″), and various millimeter and submillimeter lines of HCO+, CO, and HCN (Tauber et al. 1994; Hogerheijde, Jansen, & van Dishoeck 1995; Young Owl et al. 2000; Lis & Schilke 2003, ″). The peak of the H2 rotational line emission in Figure 2 is at ″, or 15″ (9cm) from the ionization front. By comparing the linear displacements of these peaks to the column density peaks in plane-parallel PDR models with appropriately chosen incident UV fields, Tielens et al. (1993); Tauber et al. (1994) and Simon et al. (1997) estimate the density for a homogeneous medium to be 5104 to 3 cm-3, consistent with the range of densities derived from physical measurements and with an appropriate density range for our constant pressure models.
Many authors have suggested that propagation of far-UV radiation through a clumpy medium offers an explanation for the range in derived densities, particularly in the molecular part of PDR’s. In such a picture, the attenuation scale length in the low density medium or the distance to reach a clump area filling factor of unity set the size scale for the PDR (Stutzki et al 1988). There is, however, no unambiguous evidence of a clumpy structure in the region of the Orion Bar where H2 emits. The fairly straight leading edge of the bright H2 ridge and the absence of strong variations in either column density or in the ratio of 1-0 S(1) line to 0-0 S(1) line intensity along the ridge argue that the H2 emission arises either from a uniform medium, from a low density PDR component, or from an ensemble of clumps with a line of sight filling factor significantly larger than one. Clumps with densities of 6 106 cm-3 have been observed deep into the molecular gas behind the PDR via HCN, HCO and their isotopomers (Lis & Schilke 2003; Young Owl et al. 2000). However, for the neutral gas closest to the ionization front, Marconi et al. (1998) use the relative strengths of near-IR Fe II lines to exclude the presence of clumps with densities 106 cm-3. In our models (Paper II), we therefore assume a uniform medium.
Apart from the temperature within the H2 bright ridge of 450 K, there are several other temperature measurements that can serve as constraints on the thermal balance through the PDR. If the carbon recombination lines arising from the part of the PDR closest to the ionization front are purely thermally broadened, the temperatures in that layer are 1000-1600 K (Wyrowski et al. 1997). CO 6-5 brightness temperatures 10″ in front of the molecular peak (5″ behind the H2 ridge) imply a kinetic temperature of 120-180K (Lis et al. 1998). Farther into the cloud, Batrla & Wilson (2003) use NH3 line ratios to derive a temperature of 120 K for what they argue are the surfaces of the dense clumps in the molecular ridge.
In comparing the PDR model intensities to observed intensities, we must tilt the models correctly with respect to the line of sight and account for radiative transfer through the inclined PDR slabs. There are two lines of evidence that argue that the Orion bar is highly inclined from the plane of the sky. Molecular line observers, who see low-level emission both in front of and behind the bar, conclude that the roughly factor of 10 enhancement in column density seen for optically thin lines from the bar implies an inclination of only a few degrees from the line of sight (Tauber et al. 1994; Hogerheijde, Jansen, & van Dishoeck 1995). The steepness of the dropoff in radio continuum at the ionization front and the steep rise in the rotational H2 line emission on the leading edge of the ridge form the second argument for the almost edge-on orientation of the PDR (Felli et al. 1993, this paper). Walmsley et al. (2000) have estimated that the Orion bar is approximately plane-parallel and that we view it from a direction with 1/cos = 10 where is the angle between the line-of-sight and the normal to the PDR. In calculating models of the emergent line intensities, we adopt this as a plausible estimate for the enhancement of the surface brightness of optically thin lines relative to the face-on surface brightness. Accordingly, in all of the models in Paper II, Draine et al. attempt to reproduce the line intensities observed at positions A and B with a plane-parallel PDR viewed from an angle such that 1/cos = 10. The model line intensities include attenuation by dust within the PDR.222The dust attenuation cross section is taken to be , where is the extinction at wavelength for an extinction law. For 1/cos = 10, internal extinction significantly attenuates the emission at the shorter wavelengths. For example, in the PDR model discussed below the 1-0 S(1) line is attenuated by a factor of 0.26, the equivalent of AK = 1.4 . The lower surface brightness seen at positions C-F may be due to viewing with a different inclination angle (Hogerheijde, Jansen, & van Dishoeck 1995), or possibly this emission arises from a region physically separate from the location of the edge-on Bar.
4.2 Results for the Best PDR Model
We present here a comparison of our new observational results for the Orion Bar and a theoretical model for this high-excitation PDR. This model may be relevant not only for a single dense PDR illuminated by O and B stars in galactic star forming regions but also for studies of physical conditions over large areas in the inner regions of starburst galaxies. The 0-0 S(2)/0-0 S(1) line ratio for the nucleus of NGC 253 (Devost et al. 2004) is the same as observed in the Orion Bar and the intensity averaged over an 800 pc 700 pc region of NGC 253 is fully 50% of that observed at peak A in the Orion Bar. If the emission in NGC 253 originates from PDRs, these must be both very intense and have a high surface filling factor.
In paper II, Draine et al. present a grid of models for the Orion Bar PDR near position A. Table 5 gives the values of the pressure (), radiation intensity (), rate of ionization of H by cosmic rays or X-rays (), and abundances of the coolants C, O, Si, and Fe used in the models. Gas-phase abundances for C, O, Si, and Fe are taken from Jenkins (2004) for gas with “depletion factor” , corresponding to approximately the level of depletion seen in the diffuse molecular cloud toward Oph. The vibrational line emission from the models is sensitive to the rate coefficients for vibrational deexcitation of H2, particularly by collisions with H atoms. Usuda et al. (1996) found that in the Orion Bar, the 2-1 S(1)/1-0 S(1) intensity ratios were anticorrelated with the 1-0 S(1) line intensities, and were usually lower than the 2-1 S(1)/1-0 S(1) intensity ratio (0.6) expected for pure UV-fluorescence. Our values adopted for these rates are discussed by Draine & Bertoldi (2005, in preparation). Table 6 compares different estimates for the K rate coefficients, , for vibration deexcitation by H atom collisions of the and levels of H2 (the levels responsible for 1–0S(1) and 2–1S(1) line emission). Our adopted rates are an order of magnitude smaller than the vibrational deexcitation rates adopted by Sternberg & Dalgarno (1989), but exceed the rate coefficients calculated by Mandy & Martin (1993), by factors of 8 and 2, respectively. Our rates are a factor of 150 times larger than the rates recommended by Le Bourlot et al. (1999).
The model grid explores variations in the dust ultraviolet attenuation cross section, the H2 formation rate, and the photoelectric heating rate. Table 7 compares a model from this grid (Model 1) to the observations at position A. The model is within 10% of the 0-0 S(1), 0-0 S(2), 0-0 S(4), and 1-0 S(1) intensities for the average of positions A and B. The model 0-0 S(1) intensity is 2% below 0-0 S(1) at position A, and 9% above the value at B. For 0-0 S(2), the model is 18% below A and 1% below B. For 0-0 S(4), the model is 7% above A, and 14% below B. For 1-0 S(1), the model is 6% above A, and 12% above B.
The 2-1 S(1)/1-0 S(1) intensity ratio for the model is 0.23. There is some uncertainty concerning the observed line ratio. As discussed in §3.3, we use the results of Usuda et al. (1996), 2-1 S(1)/1-0 S(1) = 0.25 at position A, which we take as the best observational determination.
Figure 6 shows the temperature profile for Model 1. The ionization front is defined to be the point where ; at this point, the gas temperature is 9000 K, but the temperature drops rapidly with distance from the ionization front, as heating due to photoionization of H declines and the fractional ionization drops. Model 1 successfully reproduces the observed cm separation between the ionization front and the peak of the H2 line emission (Figure 6). In fact, the figure shows that the model even has an extended (2-3″) tail on the ionization front side of the 1-0 S(1) peak, consistent with the observed cuts shown in Figure 4. Most of the 1-0 S(1) emission in this model arises from collisional excitation of (1,3), the state. For example, at cm, , which is essentially the thermal ratio () at the local temperature K. The density is not high enough to fully thermalize the vibrational levels – ultraviolet pumping contributes in part to the population of (1,3), and accounts for most of the population of (2,3). The rise in to a local maximum at cm reflects competition between increasing and declining . The second maximum at cm is due to UV-pumping: the decline in and the drop in lead to a drop in the rates for collisional deexcitation of the vibrationally-excited states, so that the levels are no longer collisionally deexcited, but going deeper into the cloud, the UV pumping rates drop and therefore so does . Note this maximum of coincides with the maximum in .
The rotational levels of are thermalized and arise in the zone where the temperature gradient is quite steep. The lower levels [e.g., (0,2)] peak farther from the ionization front than the higher levels [e.g., (0,6)].
4.3 Parameters for the Best PDR Model
The best-fit model from Paper II (Model 1) uses a rate coefficient for formation of H2 on dust grains 333With the usual definition: . with a value cms-1 at K – similar to the value found by Habart et al. (2004) for the Orion Bar PDR. However, Model 1 implies significant deviations from the standard values adopted for other dust-related parameters in the Orion Bar PDR.
In order to achieve the agreement in the separation of the ionization front and H2 peak, Model 1 adopts a dust attenuation cross section at 1000Å cm2 – if a significantly higher value of is used, the increased FUV attenuation brings the H2 peak too close to the ionization front. The adopted is significantly smaller than the Å extinction cross section cm2 inferred from the Fitzpatrick (1999) parametrization of the interstellar reddening law for sightlines with , if we take from Bohlin, Savage & Drake (1978). At 1000Å the dust albedo is estimated to be (Draine 2003; Gordon 2004), implying an attenuation cross section – 3 times larger than the value adopted for Model 1. The dust now in the Orion PDR might have undergone extensive coagulation during the long time it spent in cold, dense molecular gas prior to the arrival of the photodissociation front. Such coagulation would lower the far-ultraviolet scattering and absorption per H nucleon.
As described above, the PDR model corrects for internal absorption in the PDR assuming a reddening law, and therefore the K band attenuation coefficient has been scaled down by the same factor of as the UV extinction. This would be appropriate if the reduced extinction were due to an overall deficiency of dust grains, but it would not be correct if the low UV extinction were due to dust coagulation, as coagulation of small grains would not decrease the K band extinction unless the coagulation resulted in grains larger than m. As noted above, even the reduced extinction assumed in the model has attenuated the 1-0 S(1) line intensity by a factor 0.26 because we assume that we are observing the PDR from a direction with – if the K band attenuation coefficient were significantly larger than the (reduced) value in the model, it would be very difficult to reproduce the observed H2 line intensities. The degree to which the observed line intensities have been affected by extinction in the Orion Bar is an important question; additional observational studies of the reddening using H2 emission lines would be of great value.
In order to lower the 2-1 S(1)/1-0 S(1) line ratio from the pure fluorescence value 0.6 to the observed value 0.25, the atomic zone of the PDR must have a gas temperature K – this is required so that (1) the rate coefficients for collisional deexcitation are large enough to suppress 2-1 S(1) emission by collisionally deexciting H2 in the state fast enough to compete with spontaneous decay, and (2) to collisionally excite 1-0 S(1) emission. Although the models explicitly include heating from collisional deexcitation of vibrationally-excited H2, the dominant heating process is photoelectric heating from dust. With the cooling processes that are present, the only way to produce the required high temperature is for the heating rate to be substantially larger than the photoelectric heating rate predicted by existing models of photoelectric emission from dust (Bakes & Tielens 1994; Weingartner & Draine 2001). Draine et al. (2005) provide this additional heating by means of an ad-hoc increase in the photoelectric heating rate in the atomic portion of the PDR by a factor relative to the estimate of Weingartner & Draine (2001, hereafter WD01) for dust.
Above it has been argued that the separation of the peak of the H2 emission from the PDR requires a reduction in the FUV absorption by the dust; since photoelectric heating cannot occur without absorption of UV photons, one might have expected a corresponding reduction in the dust photoelectric heating rate, whereas Model I posits an increased heating rate. The increased photoelectric heating rate may be regarded as a proxy for some other heating process that may be present, or perhaps it is indicative of overestimation of the fine structure cooling (dominated by [OI]63m and [CII]158m emission). In any event, it indicates that there is a substantial error in our account of the heating and cooling in the atomic zone of the PDR.
However, although high temperatures, and therefore an enhanced photoelectric heating rate or its effective equivalient, are required to suppress 2-1 S(1) emission in the region where UV pumping of H2 is taking place, this enhanced photoelectric heating rate cannot be present in the regions that are predominantly molecular – otherwise there would be too much emission in 0-0 S(4), 0-0 S(2), and 0-0 S(1). Draine et al. (2005) therefore adopt an ad-hoc photoelectric heating rate that is reduced to of the WD01 heating rate where , and 0.1 of the WD01 heating rate where . Such variation in the grain photoelectric heating properties could perhaps come about if the grains from the cold dense molecular cloud enter the PDR in some state (perhaps coated or clumped) yielding a low photoelectric heating rate. As these grains enter the PDR and are exposed to both the Å radiation radiation that dissociates H2 and atomic H, perhaps the grain properties are altered (e.g., dispersal of clumps, or photolysis of coatings) so as to increase the photoelectric yields.
There are no velocity-resolved observations of 1-0 S(1) toward the Orion Bar. In the PDR associated with the reflection nebula NGC 7023, this line has a width of 3.4 km s-1 (Lemaire et al. 1999), consistent with our measurements of the ground state lines in the Orion Bar. The narrow linewidths of our pure rotational H2 lines indicate that the gas, if shocked, must be shocked at a very low velocity. Observed linewidths in regions with even moderate (vs 20 km s-1) shock velocites are greater than 30 km s-1 (Parmar, Lacy, & Achtermann 1994; Tedds, Brand, & Burton 1997). Shock models of Draine, Roberge, & Dalgarno (1983) and Kaufman & Neufeld (1996) predict H2 v=1-0 S(1) intensities greater than ergs s-1 cm-2 sr-1 in face on PDRs from shocks with velocities greater than 20 km s-1. Tielens et al. (1993) calculate the heating input by a shock in the Orion Bar and find that heating of the gas by the FUV field (65 erg cm-2 s-1) exceeds shock heating unless the shock velocity is greater than 10 km s-1. Given the morphological similarities of the 1-0 S(1) and 0-0 S(1) emission, it is also unlikely that shock excitation could appreciably contribute to the observed 1-0 S(1) intensity.
In addition to explaining the PDR structure and H2 line intensities, future modeling must address the high temperatures in the CO/HCO+/NH3 zone of the Orion Bar. The models in Draine et al. (2005, in prep) do not calculate the thermal balance realistically that far into the PDR. Figure 6 shows, however, that the model temperature has already dropped to 50 K, far below the temperatures of 100-120 K derived from observations of the molecular zone, even before that zone is reached. Clearly, other heating mechanisms must be in play within that zone as well. We emphasize that our models of the Orion Bar are optimized for the region in the PDR where H2 emits, and do not apply to regions deeper into the molecular cloud.
5 Summary
We obtained high resolution (R = 75,000 to 100,000) spectral maps of H2 v = 0-0 S(1) and S(2) covering a 12″ by 40″ region in the Orion Bar PDR. Linewidths for the spectra in our maps are 4-6 km s-1 with VLSR ranging from 10.2 to 11.5 km s-1. Comparison of our maps with v = 1-0 S(1) observations (van der Werf et al. 1996) reveals exceptional similiarity in the line intensity distributions.
To model our line intensities (detailed in Draine et al. 2005, in prep), we use estimates of the FUV field, pressure and inclination angle from the literature (§4.1), and allow flexibility in dust-related parameters (dust opacity, photoelectric heating rate and H2 formation rate). The best-fit model matches the distance between the H2 line emission and the ionization front, the observed intensities of the H2 S(1) and S(1) lines, and the intensities of the ground state rotational lines.
In order to reproduce the observed separation between the ionization front and the H2 emission peak, the model requires a reduction in the FUV attenuation cross section, by a factor of 3 relative to a priori estimates. This model also requires an enhanced heating rate in the atomic region of the PDR, corresponding to a factor increase in the photoelectric heating rate (or a corresponding reduction in the radiative cooling) in order to maintain K in the atomic zone. Though the uniqueness of our solution has not been tested, it is apparent that the standard dust-related parameters used in PDR models do not allow for a reasonable match to our observations.
The spatial resolution of our observations (0.002 pc) is roughly the thickness of the H2 emission region, according to our best-fit model. Thus, we were not able to spatially resolve the temperature structure of the PDR, and our observed width and steepness of the bright ridge is due primarily to inclination effects. Line intensities and ratios for extended emission behind the main H2 ridge can be explained if 1/cos() decreases as one moves further into the cloud. This geometry would agree with Hogerheijde, Jansen, & van Dishoeck (1995).
Acknowledgements: We would like to thank Tommy Greathouse for support of the observing, Paul van der Werf for providing his results in electronic form, and David Hollenbach along with our anonymous referee for helpful comments. This work was supported by NSF grant AST-0205518. BTD was supported in part by NSF grant AST-9988126 and in part by grants from the W.M. Keck Foundation and the Monell Foundation. MJR was supported by NSF grant AST-0307497 and NASA grant NNG04GG92G. TEXES was built and operated by grants from the National Science Foundation and the Texas Advanced Research Program.


| Line | WavelengthaaJennings, Bragg, & Brault (1984) | Eupper/kbbMandy & Martin (1993) | AccWolniewicz et al. (1998) |
|---|---|---|---|
| m | K | s-1 | |
| 0-0 S(1) | 17.035 | 1015 | |
| 0-0 S(2) | 12.279 | 1682 | |
| 0-0 S(4) | 8.0258 | 3476 | |
| 1-0 S(1) | 2.1218 | 6955 |
| Line | Frequencyaafrom Jennings, Bragg, & Brault (1984) | slit length | slit width | Resolving Power | tonbbThe average total integration time (ON position) per point | rms noise |
|---|---|---|---|---|---|---|
| cm-1 | s | |||||
| 0-0 S(1) | 587.032 | 10.5″ | 2.0″ | 75000 | 160 | 0.32ccAverage noise in units of 10-4 erg cm-2 s-1 sr-1 for a single position in our smoothed (2″resolution) map. |
| 0-0 S(2) | 814.425 | 7.35″ | 1.4″ | 87000 | 80 | 0.22ccAverage noise in units of 10-4 erg cm-2 s-1 sr-1 for a single position in our smoothed (2″resolution) map. |
| 0-0 S(4) | 1246.098 | 6.3″ | 1.4″ | 100000 | 520 | 0.18ddAverage noise for the spectrum derived by summing along the slit and over all S(4) slit positions. |
| 0-0 S(1) | 0-0 S(2) | 0-0 S(4) | |||||||
|---|---|---|---|---|---|---|---|---|---|
| Area | V1/2aaThe best-fit gaussian FWHM to the spectra without deconvolving the instrument profile | V1/2bbThe physical linewidth found by deconvolving the instrument profile from the measured linewidth, assuming both are gaussian | VLSR | V1/2aaThe best-fit gaussian FWHM to the spectra without deconvolving the instrument profile | V1/2bbThe physical linewidth found by deconvolving the instrument profile from the measured linewidth, assuming both are gaussian | VLSR | V1/2aaThe best-fit gaussian FWHM to the spectra without deconvolving the instrument profile | V1/2bbThe physical linewidth found by deconvolving the instrument profile from the measured linewidth, assuming both are gaussian | VLSR |
| km s-1 | km s-1 | km s-1 | km s-1 | km s-1 | km s-1 | ||||
| A | 6.0 | 4.5 | 11.3 | 5.7 | 4.5 | 10.9 | 6.5 | 5.7 | 10.7 |
| B | 5.8 | 4.2 | 11.0 | 5.6 | 4.4 | 10.4 | 6.5 | 5.7 | 9.4 |
| C | 4.6 | 4.0 | 11.0 | 5.6 | 4.4 | 11.5 | |||
| D | 6.7 | 5.4 | 11.1 | 5.6 | 4.4 | 10.4 | |||
| E | 6.0 | 4.5 | 10.7 | 6.9 | 6.0 | 10.3 | |||
| F | 7.7 | 6.6 | 11.0 | 6.7 | 5.7 | 10.2 | |||
| Observed Intensitiesaafor explanation of uncertainties see §2 | ||||||||
|---|---|---|---|---|---|---|---|---|
| Area | 0-0 S(1) | 0-0 S(2) | 0-0 S(4) | 1-0 S(1)bbfrom van der Werf et al. (1996) | TexcccDetermined from I[0-0 S(1)]/I[0-0 S(2)] assuming optically thin, thermalized emission with an equilibrium ortho-to-para ratio. | TexcddDetermined from I[0-0 S(4)]/I[0-0 S(2)] assuming optically thin, thermalized emission | N(H2)eeThe total H2 column density determined from I[0-0 S(1)] assuming optically thin, thermalized emission at the temperature determined from I[0-0 S(1)]/I[0-0 S(2)] | |
| erg cm-2 s-1 sr-1 | K | K | 1020 cm-2 | |||||
| A | 3.6 | 460 | 500 | 9.0 | ||||
| B | 3.4 | 430 | 570 | 8.9 | ||||
| C | 1.3 | 590 | 1.7 | |||||
| D | 0.94 | 590 | 1.3 | |||||
| E | 0.49 | 630 | 3.0 | |||||
| F | 0.2 | 390 | 4.0 | |||||
| 0.1 | |
|---|---|
| C/H | |
| O/H | |
| Si/H | |
| Fe/H |
| Reference | aaFor we sum over collisional transitions to all levels with | aaFor we sum over collisional transitions to all levels with |
|---|---|---|
| Sternberg & Dalgarno (1989) | ||
| Mandy & Martin (1993) | ||
| Le Bourlot et al. (1999) | ||
| present work (see text) | ||
| Line | Wavelength | ModelaaModel 1 (see Table 5) | Observation | Model/Obs. |
|---|---|---|---|---|
| m | erg cm-2 s-1 sr-1 | |||
| H20-0 S(1) | 17.035 | 0.836 | 0.85bbthis paper: position A | 0.98 |
| H20-0 S(2) | 12.279 | 0.557 | 0.68bbthis paper: position A | 0.82 |
| H20-0 S(4) | 8.0258 | 0.439 | 0.41bbthis paper: position A | 1.07 |
| H21-0 S(1) | 2.1218 | 0.382 | 0.36ccvan der Werf et al. (1996) | 1.06 |
| H22-1 S(1) | 2.2477 | 0.089 | 0.090dd2-1 S(1)/1-0 S(1) from Usuda et al. (1996) | 0.99 |
| SiII | 34.81 | 17.4 | 7.1eeStacey et al. (1995), 9.2 beam | 2.1 |
| OI | 63.184 | 73.7 | 55.ffHerrmann et al. (1997), 22 beam | |
| OI | 145.53 | 16.6 | 3.ggHerrmann et al. (1997), 50 beam | |
| CII | 157.74 | 17.2 | 4.hhHerrmann et al. (1997), 55 beam | |
References
- Bakes & Tielens (1994) Bakes, E.L.O., & Tielens, A.G.G.M. 1994, ApJ, 427, 822
- Batrla & Wilson (2003) Batrla, W., & Wilson, T.L. 2003, A&A, 408, 231
- Bertoldi et al. (2000) Bertoldi, F., et al., 2000, IAU Symposium 197, 191
- Bertoldi & Draine (1996) Bertoldi, F., & Draine, B.T., 1996, ApJ, 459, 222
- Black & van Dishoeck (1987) Black, J.H., & van Dishoeck, E.F. 1987, ApJ, 332, 412
- Bohlin, Savage & Drake (1978) Bohlin, R.C., Savage, B.D., & Drake, J.F. 1978, ApJ, 224, 132
- Bregman et al. (1994) Bregman, J., Larson, K., Rank, D., & Temi, P. 1994, ApJ, 423, 326
- Burton, Hollenbach, & Tielens (1990) Burton, M.G., Hollenbach, D.J., & Tielens, A.G.G.M. 1990, ApJ, 365, 620
- Devost et al. (2004) Devost, D., et al. 2004, ApJS, 154, 242
- Draine (2003) Draine, B.T. 2003, ApJ, 598, 1017
- Draine & Bertoldi (1996) Draine, B.T. & Bertoldi, F. 1996, ApJ, 468, 269
- Draine & Bertoldi (1999) Draine, B. T. & Bertoldi, F. 1999, ESA SP-427: The Universe as Seen by ISO, 553
- Draine, Roberge, & Dalgarno (1983) Draine, B.T., Roberge, W.G., & Dalgarno, A. 1983, ApJ, 264, 485
- Felli et al. (1993) Felli, M., Churchwell, E., Wilson, T.L., & Taylor, G.B. 1993, A&AS, 98, 137
- Fitzpatrick (1999) Fitzpatrick, E.L. 1999, PASP, 111, 63
- Fuente et al. (1999) Fuente, A., Martín-Pintado, J., Rodríguez-Fernández, N.J., Rodríguez-Franco, A., de Vincente, P., & Kunze, D. 1999, ApJ, 518, L45
- Gordon (2004) Gordon, K.D. 2004, in Astrophysics of Dust, ed. A.N. Witt, G.C. Clayton, & B.T. Draine, ASP Conference Series, 309, 77
- Habart et al. (2004) Habart, E., Boulanger, F., Verstraete, L., Walmsley, C. M., & Pineau des Forêts, G. 2004, A&A, 414, 531
- Habing et al. (1968) Habing, H.J. 1968, BAN, 19, 421
- Hasegawa et al. (1987) Hasegawa, T., Gatley, I., Garden, R.P., Brand, P.W.J.L., Ohishi, M., Hayashi, M., & Kaifu, N. 1987, ApJ, 318, 77
- Herrmann et al. (1997) Herrmann, F., Madden, S.D., Nikola, T., Poglitsch, A., Timmermann, R., Geis, N., Townes, C.H., & Stacey, G.J. 1997, ApJ, 481, 343
- Hogerheijde, Jansen, & van Dishoeck (1995) Hogerheijde, M.R., Jansen, D.J., & van Dishoeck, E.F. 1995, A&A, 294, 792
- Hollenbach & Tielens (1999) Hollenbach, D.J., & Tielens, A.G.G.M. 1999, Rev. Mod. Phys., 71, 173
- Hoogerwerf, de Bruijne, & de Zeeuw (2000) Hoogerwerf, R., de Bruijne, J. H. J., & de Zeeuw, P. T. 2000, ApJ, 544, L133
- Howe et al. (1991) Howe, J. E., Jaffe, D.T., Genzel, R. & Stacey, G.J. 1991, ApJ, 373, 158
- Jansen et al. (1995) Jansen, D.J., van Dishoeck, E.F., Black, J.H., Spaans, M., & Sosin, C. 1995, A&A, 302, 223
- Jenkins (2004) Jenkins, E. B. 2004, in Origin and Evolution of the Elements, Carnegie Observatories Astrophysics Series (Cambridge: Cambridge Univ. Press), ed. A. McWilliam and M. Rauch, 339
- Jennings, Bragg, & Brault (1984) Jennings, D.E., Bragg, S.L, & Brault, J.W. 1984, ApJ, 282, L85
- Jura (1975) Jura, M. 1975, ApJ, 197, 575
- Kaufman & Neufeld (1996) Kaufman, M.J., & Neufeld, D.A. 1996, ApJ, 456, 611
- Lacy et al. (2002) Lacy, J.H., Richter, M.J., Greathouse, T.K., Jaffe, D.T., & Zhu, Q. 2002, PASP, 114, 153
- Le Bourlot et al. (1999) Le Bourlot, J., Pineau des Forêts, G., & Flower, D. R. 1999, MNRAS, 305, 802
- Lemaire et al. (1999) Lemaire, J. L., Field, D., Maillard, J. P., Des Forêts, G. P., Falgarone, E., Pijpers, F. P., Gerin, M., & Rostas, F. 1999, A&A, 349, 253
- Lis & Schilke (2003) Lis, D.C. & Schilke, P. 2003, ApJ, 597, L145
- Lis et al. (1998) Lis, D.C., Serabyn, E., Keene, J., Dowell, C.D., Benford, D.J., Phillips, T.G., Hunter, T.R., Wang, N. 1998, ApJ, 509, 299
- Luhman et al. (1997) Luhman, M.L., Jaffe, D.T., Sternberg, A., Herrmann, F., & Poglitsch, A. 1997, ApJ, 482, 298
- Mandy & Martin (1993) Mandy, M.E. & Martin P.G. 1993, ApJ, 86, 199
- Marconi et al. (1998) Marconi, A., Testi, L., Natta, A., & Walmsley, C.M. 1998, A&A, 330, 696
- McCall et al. (2003) McCall, B.J., et al. 2003, Nature 422, 500
- Meixner & Tielens (1993) Meixner, M. & Tielens, A.G.G.M. 1993, ApJ, 405, 216
- Parmar, Lacy, & Achtermann (1991) Parmar, P.S., Lacy, J.H., & Achtermann, J.M. 1991, ApJ, 372, L25
- Parmar, Lacy, & Achtermann (1994) Parmar, P.S., Lacy, J.H., & Achtermann, J.M. 1994, ApJ, 430, 786
- Plume et al. (1999) Plume, R., Jaffe, D.T., Tatematsu, K. Evans, N.J. II, & Keene, J. 1999, ApJ, 512, 768
- Pogge et al. (1992) Pogge, R.W., Owen, M.J., & Atwood, B. 1992, ApJ, 399, 147
- Rieke & Lebofsky (1985) Rieke, G.H. & Lebofsky, M.J. 1985, ApJ, 288, 618
- Rosenthal, Bertoldi & Drapatz (2000) Rosenthal, D., F. Bertoldi, F., & Drapatz, S. 2000, A&A, 356, 705
- Schulz et al. (2003) Schulz, N.S., Canizares, C., Huenemoerder, D., & Tibbets, K. 2003, ApJ, 595, 365
- Simon et al. (1997) Simon, R., Stutzki, J., Sternberg, A., & Winnewisser, G. 1997, A&A, 327, L9
- Spaans (1996) Spaans, M. 1996, A&A, 307, 271
- Stacey et al. (1995) Stacey, G. J., Gull, G. E., Hayward, T. L., Latvakoski, H., & Peng, L. 1995, ASP Conf. Ser. 73: From Gas to Stars to Dust, 215
- Sternberg & Dalgarno (1989) Sternberg, A., & Dalgarno, A. 1989, ApJ, 338, 197
- Sternberg & Dalgarno (1995) Sternberg, A., & Dalgarno, A. 1995, ApJS, 99, 565
- Stutzki et al (1988) Stutzki, J., Stacey, G.J., Genzel, R., Harris, A.I., Jaffe, D.T., & Lugten, J.B. 1988, ApJ, 332, 379
- Tauber et al. (1995) Tauber, J. A., Lis, D. C., Keene, J., Schilke, P., & Buettgenbach, T. H. 1995, A&A, 297, 567
- Tauber et al. (1994) Tauber, J.A., Tielens, A.G.G.M., Meixner, M. & Goldsmith, P.F. 1994, ApJ, 423, 136
- Tedds, Brand, & Burton (1997) Tedds, J.A., Brand, P.W.J.L., & Burton, M.G. 1999, MNRAS, 307, 337
- Tielens & Hollenbach (1985b) Tielens, A.G.G.M., & Hollenbach, D. 1985, ApJ, 291, 747
- Tielens et al. (1993) Tielens A.G.G.M., Meixner, M.M., van der Werf, P.P., Bregman, J., Tauber, J.A., Stutzki, J., & Rank, D. 1993, Science, 262, 5130
- Timmermann et al. (1996) Timmermann, R., Bertoldi, Wright, C.M., Drapatz, S., Draine, B.T., Haser, L., & Sternberg, A. 1996, A&A, 315, L281
- Tokunaga (1984) Tokunaga, A. T. 1984, AJ, 89, 172
- Usuda et al. (1996) Usuda, T., Sugai, H., Kawabata, H., Inoue, M.Y., Kataza, H., & Tanaka, M. 1996,ApJ, 464, 818
- van der Werf et al. (1996) van der Werf, P.P., Stutzki, J., Sternberg, A., & Krabbe, A. 1996, A&A, 313, 633
- Walmsley et al. (2000) Walmsley, C.M., Natta, A., Oliva, E., & Testi, L. 2000, A&A, 364, 301
- Weingartner & Draine (2001) Weingartner, J.C., & Draine, B.T. 2001, ApJS, 134, 263
- Wolniewicz et al. (1998) Wolniewicz, L., Simbotin, I., & Dalgarno, A. 1998, ApJS, 115, 293
- Wyrowski et al. (1997) Wyrowski, F., Schilke, P., Hofner, P., & Walmsley, C.M. 1997, ApJ, 487, L171
- Young Owl et al. (2000) Young Owl, R.C., Meixner, M.M., Wolfire, M., Tielens, A.G.G.M., & Tauber, J. 2000, ApJ, 540, 886