Photon dominated regions in the spiral arms of M83 and M51
We present [C i] 3P1–3P0 spectra at four spiral arm positions and the nuclei of the nearby galaxies M83 and M51 obtained at the JCMT. The spiral arm positions lie at galacto-centric distances of between 2 kpc and 6 kpc. This data is complemented with maps of CO 1–0, 2–1, and 3–2, and ISO/LWS far-infrared data of [C ii] (158 m), [O i] (63 m), and [N ii] (122 m) allowing for the investigation of a complete set of all major gas cooling lines. From the intensity of the [N ii] line, we estimate that between 15% and % of the observed [C ii] emission originate from the dense ionized phase of the ISM. The analysis indicates that emission from the diffuse ionized medium is negligible. In combination with the FIR dust continuum, we find gas heating efficiencies below in the nuclei, and between 0.25 and 0.36% at the outer positions. Comparison with models of photon-dominated regions (PDRs) of Kaufman et al. (1999) with the standard ratios [O i](63)/[C ii]PDR and ([O i](63)[C ii]PDR) vs. TIR, the total infrared intensity, yields two solutions. The physically most plausible solution exhibits slightly lower densities and higher FUV fields than found when using a full set of line ratios, [C ii]PDR/[C i](1–0), [C i](1–0)/CO(3–2), CO(3–2)/CO(1–0), [C ii]/CO(3–2), and, [O i](63)/[C ii]PDR. The best fits to the latter ratios yield densities of cm-3 and FUV fields of 20–30 times the average interstellar field without much variation. At the outer positions, the observed total infrared intensities are in perfect agreement with the derived best fitting FUV intensities. The ratio of the two intensities lies at 4–5 at the nuclei, indicating the presence of other mechanisms heating the dust. [C i] area filling factors lie below 2% at all positions, consistent with low volume filling factors of the emitting gas. The fit of the model to the line ratios improves significantly if we assume that [C i] stems from a larger region than CO 2–1. Improved modelling would need to address the filling factors of the various submm and FIR tracers, taking into consideration the presence of density gradients of the emitting gas by including cloud mass and size distributions within the beam.
Key Words.:
Galaxies: ISM, Galaxies: structure, Galaxies: individual: M83, M51, ISM: Structure, Infrared: Galaxies, Submillimeter1 Introduction
Neutral atomic carbon is thought to form predominantly in surface layers of molecular clouds where C ii recombines and CO is dissociated due to the far-UV photons governing the chemical reactions. FUV photons (6 eV eV) are primarily responsible for the heating of the surface regions via photoelectric effect on dust grains while at larger depths cosmic-ray induced heating will dominate. These regions are referred to as photo dissociation regions or, more generally, as photon dominated regions (PDRs) (Tielens & Hollenbach 1985; Stoerzer et al. 1996; Kaufman et al. 1999). PDR models take into account the relevant physical processes, solve simultaneously for the chemistry (using an extensive chemical network) and the thermal balance, as a function of cloud depth. It is found that the ratio of [C ii]/[C i] is an accurate tracer of the FUV field (Gerin & Phillips 2000), parametrized by in units of the Habing-field erg s-1cm-2 (Habing 1968). Another important parameter governing the depth at which C i forms is the ratio of density over FUV field (Tielens & Hollenbach 1985). This ratio also determines the efficiency of converting FUV photons to gas heating, i.e. the photoelectric heating efficiency (Bakes & Tielens 1994).
While the Milky Way survey of FIR lines conducted with COBE/FIRAS (Fixsen et al. 1999) showed that [C ii] is the dominant cooling line, it also showed the importance of the two finestructure lines of [C i]. Both lines are ubiquitous and the two lines together amount to 75% of the total cooling of all rotational CO lines in the inner galaxy. This picture has also emerged from extragalactic observations of the [C i] 1–0 line. These show again that the cooling due to C i and CO are of the same order of magnitude for most galaxies (Bayet et al. 2004; Israel & Baas 2003, 2002, 2001). C i is found to be a good tracer of molecular gas, possibly more reliable than CO (Gerin & Phillips 2000).
Several coordinated mapping studies of nearby galaxies have been started during the past years. The BIMA SONG survey (Regan et al. 2001) has aimed at obtaining the 12CO emission of 1–0 and 2–1 rotational lines at high spatial resolutions. There exist velocity-integrated [C ii] observations of large samples of galaxies with the KAO (Stacey et al. 1991) and with ISO (Malhotra et al. 2001), hereafter MKH01, and (Leech et al. 1999; Negishi et al. 2001) at resolution. The SINGS Spitzer Legacy Project (Kennicutt et al. 2003) has started imaging 75 galaxies in the infrared, including M51. In the coming years, both SOFIA and the Herschel Space Observatory are expected to provide velocity-resolved [C ii] data at resolutions of , complementary to many current single dish observations of CO and [C i].
In external galaxies where a large number of clouds or even GMCs fill the beam it is difficult to seperate the different contributions and judge their importance. A long standing problem is that a substantial fraction of the [C ii] emission may originate from the diffuse ionized and neutral medium. Comparison with [N ii] helps to estimate the fraction originating from PDRs, but usually with large uncertainties due to the varying chemical and excitation conditions in different galactic environments (e.g. Contursi et al. 2002). The present study is part of the preparatory work for future airborne and space missions like SOFIA and Herschel. In addition, it may serve as template for studies of e.g. [C i] and CO in high- galaxies which have recently become possible (Weiss et al. 2005; Walter et al. 2004; Pety et al. 2004; Neri et al. 2003; Weiss et al. 2003).
Most extragalactic observations of atomic carbon have so far concentrated on the bright galactic nuclei or enhanced emission of edge-on galaxies. Here, we compare observations of the two nuclei of M83 and M51 with pointed observations at spiral arm positions which show enhanced star forming activity. The galacto-centric distances of the selected outer positions lie between 1.8 and 5.8 kpc. We combine observations of atomic carbon with low and mid- CO and 13CO data, as well as FIR [C ii], [O i](m), and [N ii](m) data from the ISO data-base and thus include the brightest gas cooling lines of the far-infrared and submillimeter regime.
| M83 | M51 | |
|---|---|---|
| RA(2000) | 13:37:00.5 | 13:29:52.7 |
| DEC(2000) | :51:55.3 | 47:11:43 |
| Type | SAB(s)c(1) | SA(s)bc pec(1) |
| Distance [Mpc] | 3.7(5) | 9.6 (4) |
| correspond to | 179 pc | 465 pc |
| Heliocentric velocity [kms-1] | 516(1) | 463(1) |
| Position Angle [deg] | 45 (2) | 170 |
| Inclination [deg] | 24 (2) | |
| [′] | (1) | (1) |
| [ L⊙] | ||
| [Jy] |
1.1 M83
M83 (NGC 5236) is the most nearby CO-rich grand-design spiral galaxy, seen almost face-on (Table 1). It has a pronounced bar, with two well-defined spiral arms connected to the starburst nucleus. In this paper, we adopt a distance of 3.7 Mpc (de Vaucouleurs et al. 1991) though recent observations of Cepheids indicate a slightly larger distance of 4.5 Mpc (Thim et al. 2003).
Low- CO maps were obtained by Crosthwaite et al. (2002); Lundgren et al. (2004b, a); Dumke et al. (2001); Sakamoto et al. (2004). [C i] observations of the center were conducted by Israel & Baas (2002) and Petitpas & Wilson (1998). Pointed KAO observations report strong FIR fine-structure lines towards the nucleus with a rapid fall-off towards the arms (Crawford et al. 1985).
Here, we present new [C i] data of the center and two spiral arm positions on the north-eastern arm and south-western bar-spiral transition zone. The emission of [C ii], [N ii](122), and [O iii](88) observed with ISO/LWS (Brauher 2005, priv. com.) is strongly enhanced in these interface regions indicating greatly enhanced star formation rates. ISO/LWS emission from the center was analyzed by Negishi et al. (2001). The north-eastern arm was previously studied by Lord & Kenney (1991) and Rand et al. (1999) who presented OVRO interferometric 12CO 1–0 maps. The eastern position at () presented here corresponds to the bright feature #6 compiled by Rand et al. (1999, Table 4). About to the east of the CO arm newly formed stars form the optical arm and an HI ridge. At #6, the CO and dust arms coincide while they are offset further to the south. Position () studied here corresponds to a CO 1–0 peak in the south-western bar-spiral transition zone which exhibits a massive GMC complex and luminous H ii regions (Kenney & Lord 1991). Note that only less than 5% of the single dish flux is recovered by the interferometric maps (Rand et al. 1999). Thus, relatively smoothly distributed diffuse molecular gas is completely missed.
1.2 M51
The nearby grand-design spiral galaxy M51 (NGC 5194) seen almost face on (Table 1) is interacting with its small companion NGC 5195, which lies to the north. M51 is a Seyfert 2 galaxy (Ho et al. 1997). The central AGN is surrounded by a pc disk (Kohno et al. 1996) of dense and warm gas (Matsushita et al. 1998).
A large amount of observational data are available for this object, including an extended KAO map of [C ii] (Nikola et al. 2001). Garnett et al. (2004) used ISO/LWS data of the M51 H ii region CCM 10, to study the ionized gas, finding that abundances are roughly solar.
Several single-dish studies mapped the low-lying rotational 12CO and 13CO transitions. CO 1–0 and 2–1 was mapped by Garcia-Burillo et al. (1993b, a) and Nakai et al. (1994); Tosaki et al. (2002). In this grand-design spiral, CO is tightly confined to the spiral arms. Maps of CO 3–2 and 4–3 were obtained at the HHT by Nieten et al. (1999); Wielebinski et al. (1999); Dumke et al. (2001) who show that warm molecular gas is extended in M51 at galacto-centric distances of at least upto , resp. 5 kpc. Single-dish observations of neutral carbon were so far obtained only in the center region by Gerin & Phillips (2000); Israel & Baas (2002), and Israel, Tilanus, Baas, 2005, in prep.).
Aperture synthesis maps were obtained by Aalto et al. (1999); Sakamoto et al. (1999) and Regan et al. (2001) in CO 1–0 at resolutions of . Recently, Matsushita et al. (2004) mapped the inner region in 12CO 3–2.
Here, we selected two positions at the spiral arms lying in the northeastern and the southwestern zones, i.e. at and , of enhanced [C ii] emission tracing enhanced star formation (Nikola et al. 2001). ISO/LWS data are available for these positions, and for the center Negishi et al. (2001) and Brauher (2005, priv. com.). The H ii region studied by Garnett et al. (2004) using ISO/LWS, CCM 10, lies at about , (Carranza et al. 1969), to the north-west of ,.
| Line | Telescope | Refs. | ||||
| (′′) | ||||||
| M83 at (0,0),(89,38),() | ||||||
| [C i] 1–0 | 10 | JCMT 15m | 0.52 | 1 | point. | |
| CO 1–0 | 21 | IRAM 30m | 0.78 | 1 | point. | |
| CO 1–0 | 55 | NRAO 12m | 0.88 | 2 | map | |
| CO 2–1 | 10 | IRAM 30m | 0.57 | 1 | point. | |
| CO 2–1 | 28 | NRAO 12m | 0.56 | 2 | map | |
| CO 3–2 | 25 | CSO 10m | 0.75 | 3 | map | |
| 13CO 1–0 | 22 | IRAM 30m | 0.79 | 1 | point. | |
| 13CO 2–1 | 10 | IRAM 30m | 0.60 | 1 | point. | |
| M51 at (0,0), (72,84), () | ||||||
| [C i] 1–0 | 10 | JCMT 15m | 0.52 | 1 | point | |
| CO 1–0 | 21 | IRAM 30m | 0.65 | 5 | map | |
| CO 2–1 | 10 | IRAM 30m | 0.46 | 5 | map | |
| CO 3–2 | 22 | HHT 10m | 0.50 | 4 | map | |
| 13CO 1–0 | 22 | IRAM 30m | 0.79 | 1 | point. | |
| 13CO 2–1 | 10 | IRAM 30m | 0.60 | 1 | point. | |
2 Data sets
We present here observations of [C i], CO, and 13CO spectra at four spiral arm positions and the centers of M51 and M83 (Table 2). We combine these with ISO/LWS FIR spectral line data at all six positions together with the FIR continuum derived from HIRES/IRAS 60m and 100m maps.
2.1 [C i] data taken at the JCMT
We have observed the fine structure transition of atomic carbon ([C i]) at 492 GHz (609 m, 3PP0; hereafter ) in M51 (3 positions) and M83 (3 positions) using the JCMT 15m telescope. We used receiver RxW with a single mixer and the DAS autocorrelator. Observations were carried out during 35 hours in May and June 2003. We used the double-beamswitch observing mode with a wobbler throw of in the direction of the major axis, i.e. in the direction of the largest velocity gradient. Pointing was checked using SCUBA after an initial alignment with RxW and Jupiter at the start of each shift. It was found to be accurate to within . The atmospheric zenith opacity at 225 GHz varied slowly between 0.1 and 0.05, corresponding to a of 2 and 1 at 492 GHz. After merging the DAS autocorrelator spectra using the SPECX software, further data analysis was done using the CLASS/GILDAS package of IRAM.
2.2 CO data taken at the IRAM 30m MRT
We have observed the 12CO and 13CO 1–0 and 2–1 rotational transitions at all six positions in M51 and M83 using the IRAM 30m telescope. These observations were carried out in double beam switch mode with a wobbler throw of using the filterbank of 1 MHz resolution for the 3 mm band and the 4 MHz filterbank for the 1 mm band. Observations were carried out during 15 hours on July, 23rd and 26th, and on September, 10th, 2004. Pointing and focus were checked and corrected every hours. The pointing accuracy was better than . The amount of precipitable water vapour varied slowly between 10 and mm. Telescope parameters are listed in Table 2.
| Positions | HIRES | ISO/LWS | ||
|---|---|---|---|---|
| ) | FIR | [C ii] | [N ii] | [O i] |
| m | m | m | ||
| M83: | ||||
| (0,0) | 32 | 81.8 | 14.1 | 86.7 |
| (-80,-72) | 7.2 | 38.6 | 5.3 | 27.3 |
| (89,38) | 6.6 | 33.4 | 5.9 | 26.6 |
| M51: | ||||
| (0,0) | 17 | 44.1 | 12.3 | 32.2 |
| (72,84) | 4.6 | 16.7 | 13 | |
| (-84,-84) | 3.5 | 15.4 | 2.1 | 13.4 |
2.3 FIR line fluxes from ISO/LWS
The central area of M83 covering was mapped on a fully-sampled grid of 61 positions with ISO/LWS. M51 was observed at 13 positions, mainly along a cut through the center and the two prominent [C ii] lobes in the north-east and south-west seen in the KAO map by Nikola et al. (2001). The ISO/LWS line emission data was uniformly processed by Brauher (2005, priv. com.) to derive line fluxes in Wm-2. To convert to intensities, we use a LWS beam size of ( sr), the mean value published in the latest LWS Handbook, and extended source corrections factors (Gry et al. 2003). Resulting ISO intensities of [C ii] (158 m, [N ii] (122m), and [O i] (63m) at the positions observed in [C i] are listed in Table 3. Since the [O i] (146m) line was detected only at the center positions (S. Lord, priv. comm.), we did not include it in the present analysis.
2.4 FIR continuum maps taken with IRAS
To derive the far-infrared continuum at all selected positions, we obtained high-resolution (HIRES) 60m and 100m IRAS maps from the IPAC data center111A description of IRAS HiRes reduction is available at http://irsa.ipac.caltech.edu/IRASdocs/hires_over.html. Enhanced resolution images were created after 200 iterations using the maximum correlation method (MCM Aumann et al. 1990). These data were smoothed to an effective common circular beam of and then combined to create maps of the far-infrared flux. The FIR flux is defined as in Helou et al. (1988): FIR where FIR is in W m-2 and is in Janskys. FIR is a good estimate of the flux contained between 42.5 and 122.5 m (Helou et al. 1988). Table 3 lists the FIR flux at the selected positions. To derive the total infrared flux TIR, we follow the procedure introduced by Dale et al. (2001) who derived an analytical expression for the ratio of total infrared flux TIR to the observed FIR flux, i.e. the bolometric correction, as a function of the m/100m flux density ratio from modelling the infrared SEDs of 69 normal galaxies 222 Note that TIR corresponds to the bolometric FIR dust continuum emission I(FIR) used in the PDR models of Kaufman et al. (1999). For M83 and for M51, the total infrared flux is a factor 2.3 larger than FIR given the global m/100m ratio of 0.43 (Table 1).
3 Spectra and line ratios
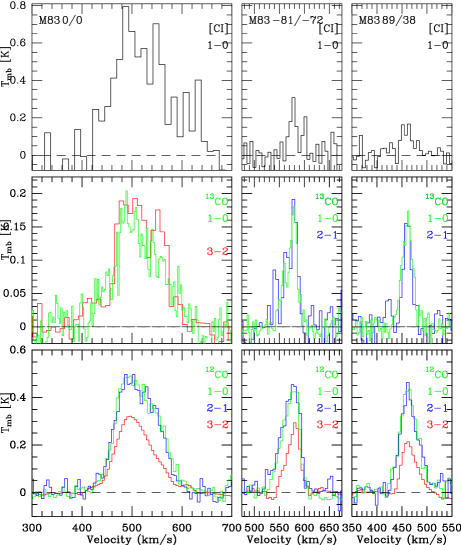
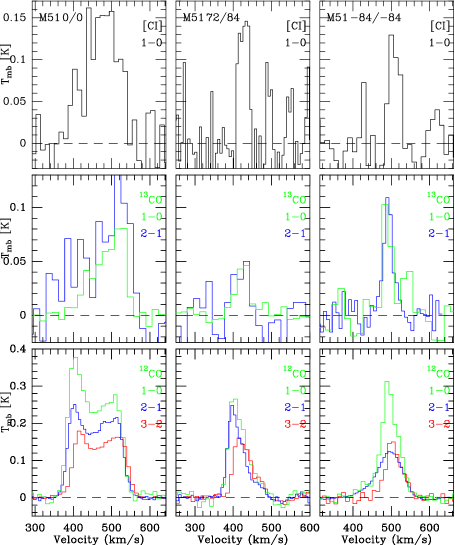
The main aim of this work is to use the combined FIR ISO/LWS, HIRES/IRAS, and the millimeter/submillimeter line data coherently and to investigate, to what degree these give a consistent fit within the framework of a simple model scenario such as PDR excitation. We therefore smoothed the 12CO maps (Table 2) to the ISO/LWS angular resolution of using Gaussian kernels. Spectra of [C i], CO, and 13CO are displayed in Figures 1,2 and integrated intensities in Table 4. Ratios with [C i] and 13CO for which no maps exist, were corrected for beam filling (Table 5).
3.1 M83
The [C i] lines are widest at the center position with 130 kms-1 FWHM and drop to about 30 kms-1 at the two outer positions. In addition, peak line temperatures drop strongly, leading to a pronounced drop of [C i] integrated intensities and area integrated [C i] luminosities by factors of 10 to 18 at galacto-centric distances of less than 2 kpc (Table 4).
The CO 3–2 transition traces warm and dense gas since its upper level energy corresponds to K and the critical density needed to thermalize this line is cm-3, only weakly dependent on the kinetic temperature. Trapping typically reduces the critical densities by up to an order of magnitude, depending on the optical depth of the lines. The CO 3–2/1–0 line ratio of integrated intensities (Table 5) thus is a sensitive tracer of local densities for densities of less than cm-3. Here, both line maps were smoothed to resolution, beam filling factors thus cancel out to first order. The estimated calibration error is 21%. While the 2–1/1–0 ratio is at all positions indicating that the state is thermalized, the 3–2/1–0 ratio drops slightly from 0.60 in the center to 0.46 at the spiral arm positions. These ratios indicate that densities are lower than needed for thermalization of the level.
The 12CO 2–1 vs. 13CO 2–1 line ratio, as well as the corresponding 1–0 ratio, trace the total column densities of the 13CO line. The ratios remain constant at for 2–1 and for the 1–0 transition.
The above ratios found at the center position agree within the quoted errors with the ratios presented in Israel & Baas (2001).
In M83, we find a significant drop of the CI vs. 13CO 2–1 ratio from about 4 in the center to at the two outer positions.
3.2 M51
Again, the [C i] line is widest at the center, kms-1 FWHM, and drops to kms-1 at the two outer positions. The 13CO lines show similar line widths at all three positions. Peak temperatures of [C i] hardly drop between the center and the two outer positions. Resulting integrated intensities and luminosities drop by a factor of only.
The observed CO 2–1/1–0 ratios lie between 0.6 and 0.8 for all three positions and do not peak at the center. This indicates that not even the 2–1 line is thermalized in M51. However, the CO 3–2/2–1 ratios do not drop as would be expected but equal the CO 2–1/1–0 ratio or even exceed them, while staying below 0.8. This is difficult to explain with a single component model as we will show below. The center CO 3–2/1–0 ratio of 0.55 is in agreement with ratios previously found with single-dish telescopes which range between at beam sizes of to (Matsushita et al. 1999; Mauersberger et al. 1999; Wielebinski et al. 1999). Interferometric observations at resolution tracing the dense nuclear gas show a high 3–2/1–0 ratio of 1.9 Matsushita et al. (2004).
High central column densities are indicated in this work by the rather low 12CO/13CO 2–1 ratio of 4.6. In contrast, the outer postions show ratios between 6 and 14.
We find CI vs. 13CO 2–1 ratios of at the center and at () while (72,84) exhibits a high ratio of 3.2.
3.3 Comparison
The gradients of [C i] luminosities with galacto-centric distances are strikingly different in M51 and M83. M83 is much more centrally peaked, [C i] luminosities drop by a factor of 18 at only 1.8 kpc distance in M83. In contrast, luminosities in M51 drop by only a factor of 4 at galacto-centric distances which are more than a factor of 3 larger, i.e. at 5.8 kpc. However, the central [C i] luminosities of M51 and M83 agree within 40%.
The line widths observed at the outer positions of M51 and M83 are typical for the disks of these two galaxies (Handa et al. 1990; Garcia-Burillo et al. 1992). See Table 2 of Garcia-Burillo et al. (1993a) for a compilation of CO line widths found in these and several other galaxies.
The CI vs. 13CO 2–1 ratio in the Milky Way is often found to be 1 (e.g. Keene 1995) while Israel (2004); Israel & Baas (2002) find a strong variation of this ratio for 15 galactic nuclei. The [C i] line is stronger than the 13CO 2–1 line for all but three galaxy centers. The highest ratios are about 5. Here, we find a variation between 1.3 and 4.
For galaxy centers, Israel & Baas (2002) found that this ratio is well correlated with the [C i] luminosity covering a range of 160 Kkms-1 kpc2 in the active nucleus of NGC3079 down to Kkms-1 kpc2 in the quiescent center of Maffei 2. Here, we increase the range down to 0.11 Kkms-1 kpc2 (Table 4) at the same resolution of . In contrast to the galaxy centers, the spiral arm positions observed here do not show a systematic correlation between the [C i]/13CO line ratio and [C i] luminosity.
| (,) | [CI] | CO 1–0 | CO 2–1 | CO 3–2 | 13CO 1–0 | 13CO 2–1 | ||
|---|---|---|---|---|---|---|---|---|
| HPBW= | ||||||||
| (1) | (2) | (3) | (4) | (5) | (6) | (7) | (8) | (9) |
| M83: | ||||||||
| (0,0) | 0 | 79.55 | (2) | 50.63 | 47.03 | 30.15 | 19.36 | 21.33 |
| (-80,-72) | 1.93 | 7.57 | (0.19) | 18.17 | 18.06 | 8.35 | 4.6 | 5.1 |
| (89,38) | 1.76 | 4.53 | (0.11) | 17.03 | 15.93 | 7.84 | 4.28 | 3.27 |
| M51: | ||||||||
| (0,0) | 0 | 16.36 | (2.78) | 43.42 | 31.53 | 23.68 | 7.34 | 12.65 |
| (72,84) | 5.4 | 4.59 | (0.78) | 15.32 | 12.21 | 9.19 | 2.27 | 1.43 |
| (-84,-84) | 5.77 | 4.03 | (0.69) | 17.29 | 9.85 | 7.41 | 4.01 | 3.09 |
| CO 3–2 | CO 3–2 | CO 2–1 | CO 1–0 | CO 2–1 | [C i] 1–0 | [C i] 1–0 | |||||||||
|---|---|---|---|---|---|---|---|---|---|---|---|---|---|---|---|
| CO 1–0 | CO 2–1 | CO 1–0 | 13CO 1–0 | 13CO 2–1 | 13CO 2–1 | CO 3–2 | |||||||||
| M83: | |||||||||||||||
| (0,0) | 0.22 | 0.28 | 0.6 | 0.64 | 0.93 | 9.34 | 10.02 | 3.73 | 0.58 | ||||||
| (-80,-72) | 0.37 | 0.45 | 0.46 | 0.46 | 0.99 | 8.77 | 9.58 | 1.48 | 0.34 | ||||||
| (89,38) | 0.48 | 0.47 | 0.46 | 0.49 | 0.93 | 8.46 | 10.14 | 1.38 | 0.28 | ||||||
| M51: | |||||||||||||||
| (0,0) | 0.56 | 0.68 | 0.55 | 0.76 | 0.73 | 8.31 | 4.62 | 1.4 | 0.4 | ||||||
| (72,84) | 0.62 | 0.73 | 0.6 | 0.76 | 0.8 | 9.27 | 13.81 | 3.19 | 0.3 | ||||||
| (-84,-84) | 0.52 | 0.72 | 0.43 | 0.75 | 0.57 | 6.04 | 6.09 | 1.25 | 0.27 |
| (CO)v | (CO) | |||||||
|---|---|---|---|---|---|---|---|---|
| [cm-3] | [K] | [ cm-2/kms-1] | [ cm-2] | [M⊙] | [cm-3] | |||
| M83: | ||||||||
| (,) | 1.7 | 3000. | 15.0 | 3.2 | 15.79 | 65.16 | 0.42 | |
| (,) | 3.5 | 3000. | 12.5 | 3.2 | 7.58 | 31.29 | 0.20 | |
| (,) | 2.1 | 3000. | 12.5 | 3.2 | 6.69 | 27.60 | 0.18 | |
| M51: | ||||||||
| (,) | 3.6 | 30000. | 12.5 | 3.2 | 17.41 | 484.67 | 0.18 | |
| (,) | 4.0 | 3000. | 15.0 | 3.2 | 2.07 | 57.76 | 0.02 | |
| (,) | 7.4 | 10000. | 12.5 | 3.2 | 5.46 | 151.89 | 0.06 |
4 Physical Conditions
4.1 Simple homogeneous models
As shown above, the observed CO line ratios cannot be explained with a simple LTE analysis. As a first step in order to estimate the kinetic temperatures and local densities of the CO emitting gas, we present in this section the results of slightly more realistic escape probability radiative transfer calculations of homogeneous spherical clumps (Stutzki & Winnewisser 1985). We assumed a 12CO/13CO abundance ratio of 40 (Mauersberger & Henkel 1993). As input, we use the four ratios of integrated intensities (Table 5): 12CO 3–2/2–1, 12CO 2–1/1–0, 12CO/13CO 1–0, and 12CO/13CO 2–1. We calculated model intensities of the three transitions for column densities (CO)/v/(cm-2/(Kkms-1), local H2 densities cm, and kinetic temperatures /K. The modelled ratios were compared with the observed ratios taking into account the observational error of 21% to derive the . The best fitting (CO)/v, , and together with the corresponding minimum reduced are listed in Table 6.
Below, we first describe the results of the one-component fits for the positions observed in M83 and M51. Much more complete physical models of the emitting regions are presented in the next section 4.2.
M83:
At resolution, the 12CO line ratios do not vary significantly between the center and the two bright spiral arm positions observed here. A 12CO 3–2/1–0 ratio of 0.5 indicates an excitation temperature of K assuming optically thick thermalized emission and simply using the detection equation. The escape probability analysis leads to a similar result (Table 6). At all three positions, the ratios are well modelled by a one-component model with a rather low kinetic temperature of only K and a density of cm-3. This result does not exclude the existence of a warmer and denser gas phase as would be traced by higher CO transitions or the 63 m [O i] line as discussed below. For the center, Israel & Baas (2001) have in fact deduced a warmer phase by including observations of the CO 4–3 line in their radiative transfer analysis.
The 12CO and 13CO line ratios found in M83 are characteristic for dynamically active or starburst regions in the classification scheme of Papadopoulos et al. (2004). In this scheme, extreme starbursts would show similar 12CO 2–1/1–0 and 3–2/1–0 ratios but much higher 12CO/13CO ratios.
M51:
In the escape probability analysis of CO and 13CO ratios in M51, we discarded solutions leading to temperatures below 12.5 K and densities below cm-3 as unphysical. Since the CO 3–2 is strong at all positions, densities and temperatures must be higher.
The CO 3–2/2–1 ratios are at all positions in M51, significantly higher than in M83. This indicates higher densities than found in M83. Indeed, the escape probability analysis finds densities between and cm-3. The 12CO/13CO ratios agree with this solution for low temperatures of K. However, the observed CO 2–1/1–0 ratios are too low to agree with this solution. Neither the temperatures nor the densities are well constrained, and minimum chi squared values are high. This shows the short coming of a one-component model even when trying to model only the three lowest rotational CO transitions. And it is in fact in agreement with the finding of Garcia-Burillo et al. (1993b) who used the lowest two transitions of 12CO and 13CO and couldn’t find a set of and fitting simultaneously the line ratios for the arms and for the central position.
4.2 PDR Analysis
To further constrain the physical conditions at the observed positions in M83 and M51, we compare the observed line intensity ratios with the results of the model for Photon Dominated Regions (PDRs) by Kaufman et al. (1999); Tielens & Hollenbach (1985). The physical structure is represented by a semi-infinite slab of constant density, which is illuminated by FUV photons from one side. The model takes into account the major heating and cooling processes and incorporates a detailed chemical network. Comparing the observed intensities with the steady-state solutions of the model, allows for the determination of the gas density of H nuclei, , and the FUV flux, G0, where G0 is measured in units of the Habing (1968) value for the average solar neighborhood FUV flux, ergs cm-2 s-1. As has been pointed out in detail by Kaufman et al. (1999) in their Section 3.5.1 and several other authors, the application of these models to extragalactic observations is not straightforward since individual molecular clouds are not resolved in single-dish observations and several phases of the ISM are therefore observationally coexistent within each beam. The additional many degrees of freedom in the parameter space for more complex models, however, are ill constrained by the few observed, beam-averaged line ratios. Hence, simplistic models, e.g. with only a single source component, are used to at least derive average properties of the complex sources. Nevertheless, it is possible to obtain some insight into the spatial structure and the local excitation conditions, as we will show.
| (,) | log(G0) | Ts | log(G0,obs) | |||||
|---|---|---|---|---|---|---|---|---|
| [kpc] | [104cm-3] | [K] | ||||||
| (1) | (2) | (3) | (4) | (5) | (6) | (7) | (8) | (9) |
| M83: | ||||||||
| () | 0.00 | 4.0 | 1.50 | 76. | 2.8 | 2.16 | 4.57 | 0.019 |
| () | 1.93 | 4.0 | 1.50 | 76. | 12.9 | 1.51 | 1.03 | 0.011 |
| () | 1.76 | 4.0 | 1.50 | 76. | 15.3 | 1.47 | 0.94 | 0.010 |
| M51: | ||||||||
| () | 0.00 | 4.0 | 1.25 | 66. | 3.2 | 1.88 | 4.31 | 0.013 |
| () | 5.40 | 4.0 | 1.25 | 66. | 5.2 | 1.32 | 1.17 | 0.016 |
| () | 5.77 | 4.0 | 1.25 | 66. | 14.1 | 1.19 | 0.88 | 0.009 |
4.2.1 [C ii] emission from the ionized and neutral medium
Carbon has a lower ionization potential (11.26 eV) than hydrogen, so that [C ii] emission arises not only from photon dominated regions, but also from the ionized phases of the ISM and from the diffuse neutral medium traced by H i.
Analyzing the Milky Way FIR line data obtained with FIRAS/COBE (Fixsen et al. 1999), Petuchowski & Bennett (1993) argue that slightly more than half the [C ii] emission in the Milky Way arises from PDRs, the remainder from the extended low density warm ionized medium or diffuse ionized medium (DIM), and an insignificant portion from the ordinary cold neutral medium (CNM).
[C ii] emission from the ionized medium.
Here, we use the observed [N ii](122m) and [C ii] lines, to estimate the fraction of [C ii] originating from the ionized medium. However, a thorough analysis would need more FIR emission line data from the ionized medium, in particular the [N ii](205m) line, to discriminate the relative importance of the different phases of the ionized medium (Bennett et al. 1994). Extragalactic observations of the [N ii](205m) are however very rare to date (Petuchowski et al. 1994).
The components of the ionized phase of the ISM which contribute to the [C ii] emission are dense HII regions ( cm-3) and the diffuse ionized medium (DIM) ( cm-3) (Heiles 1994).
The fraction of [C ii] stemming from H ii regions depends strongly on the electron density of the ionized medium. Carral et al. (1994) showed that upto 30% of [C ii] stems from H ii regions when electron densities exceed 100 cm-3. For dense HII regions (), model calculations suggest (Rubin 1985) where (C/N)dense is the abundance ratio. The Galactic abundance ratio found in dense H ii regions is 3.8 (Rubin et al. 1988, 1993). We thus expect to find an intensity ratio of
| (1) |
Observations of radio free-free emission suggest that the DIM has typical volume densities of n (Mezger 1978) and temperatures of T K (Mueller et al. 1987). Densities are thus considerably lower than the critical densities of 310 cm-3 for the [N ii](122) line and 50 cm-3 for the [C ii](158) line (Genzel 1991). In this limit, the total power emitted in the collisionally excited fine-structure lines is simply the photon energy times the upward collision rate, as given by Heiles (1994). The resulting ratio of intensities is: . Galactic absorption line measurements of diffuse gas give (C/N) (Sofia et al. 1997; Meyer et al. 1997), which implies an expected intensity ratio of
| (2) |
The preceeding section follows basically the arguments of MKH01 and Contursi et al. (2002).
The metallicities, parametrized by the Oxygen abundances, have been found to be only slightly supersolar in M83 and M51. Zaritsky et al. (1994) find (O/H) abundances of and respectively, at 3 kpc galacto-centric distance, from visual spectra of H ii regions, which is about a factor 3 higher than the solar metallicity of (Asplund et al. 2004). Abundance gradients with radius are found to be shallow in M83 and M51 (Zaritsky et al. 1994). More recent observations with ISO/LWS and modelling of the CCM10 H ii region of M51 by Garnett et al. (2004) indicate instead that the (O/H) abundances are about a factor of 2 less, i.e. roughly solar. In addition, (Garnett et al. 1999) showed that the (C/N) abundance ratio, which is of interest for the [C ii]/[N ii] ratio discussed here, is independent of metallicity in both normal and irregular galaxies. We therefore use Galactic abundances to estimate the intensity ratios in M83 and M51. For the Milky Way, Heiles (1994) have estimated that [N ii] originates predominantly from the DIM, contributing %. This was derived from the observed [N ii](122)/[N ii](205) ratio using photo ionization models. However, the [N ii](205) line has not yet been observed in M83 and M51. We therefore use Eqs. 2 and 1, assuming that [N ii] stems solely from H ii regions, or alternatively, solely from the DIM.
Next, we can then derive the fraction of [C ii] emission originating from PDRs:
| (3) |
The ratios of observed [C ii] versus [N ii] intensities vary between 3.6 and 7.4 at the six positions observed in M83 and M51 (Table 8). Garnett et al. (2004) found a higher ratio of 11.8 at the CCM 10 position in M51.
The ratios found in M83 and M51 lie at the low end of the ratios MKH01 found in the sample of 60 unresolved normal galaxies studied. They show a mean ratio of 8 and a scatter between 4.3 and 29. Contursi et al. (2002) observed ratios of more than 7.7 in NGC6946 and ratios of greater than 4 and 10 in NGC1313. Higdon et al. (2003) found ratios between and 20 in M33.
If the [N ii] emission originates only from the diffuse ionized medium, then the major fraction of [C ii] arises from this phase, and only a small fraction from PDRs (Table 8). The observed [C ii]/[N ii] is 5.8 at 3 positions, including the two nuclei, which would indicate that no [C ii] emission at all arises from PDRs. This is however unrealistic, since the emission of the [O i](63m) line, stemming from warm, dense PDRs, is strong compared to the [C ii] lines, especially in the nuclei (Table 3). For this reason, we discard this solution.
Assuming on the other hand, that the fraction of [C ii] from the ionized medium and all [N ii] emission stem only from the dense H ii regions, then a fraction of only 15% to 30% of [C ii] originates from this phase (Eq. 3), while 70% to 85% of the observed [C ii] emission then stems from PDRs. We prefer this solution and use it in the PDR analysis discussed below. In an ISO/LWS study of star-forming regions in M33, Higdon et al. (2003) have recently used FIR lines of the ionized medium, i.e. [O iii](88m), [O iii](m) and others to estimate the electron densities and other parameters of the emitting gas, estimating that between 7% and 47% of [C ii] stems from H ii regions, for their sample of positions. They conclude that the DIM is not needed to explain the observations.
| [C ii]obs | [C ii]PDR | [O i](63) | ||||
| [N ii](122) | [C ii]obs | [C ii]PDR | [%] | |||
| a. [N ii] only from the DIM: | ||||||
| M83: | ||||||
| 5.8 | 0.02 | 57.41 | 0.12 | |||
| 7.3 | 0.22 | 3.18 | 0.22 | |||
| 5.7 | 0.00 | – | 0.17 | |||
| M51: | ||||||
| 3.6 | 0.00 | – | 0.08 | |||
| 7.3 | 0.22 | 3.59 | 0.16 | |||
| 7.4 | 0.23 | 3.78 | 0.21 | |||
| b. [N ii] only from H ii-regions: | ||||||
| M83: | ||||||
| 5.8 | 0.81 | 1.31 | 0.21 | |||
| 7.3 | 0.85 | 0.83 | 0.36 | |||
| 5.7 | 0.81 | 0.99 | 0.35 | |||
| M51: | ||||||
| 3.6 | 0.69 | 1.06 | 0.16 | |||
| 7.3 | 0.85 | 0.91 | 0.25 | |||
| 7.4 | 0.85 | 1.02 | 0.33 | |||
[C ii] emission from the diffuse neutral medium.
The predicted [C ii] emission from the atomic gas has in general, for many galactic nuclei, been found to be far too weak to account for the observed [C ii] emission (Stacey et al. 1991) because the density is not high enough to appreciably excite the [C ii] emission at the measured H i column densities. This view was confirmed by (Carral et al. 1994) who conducted a detailed study of FIR cooling lines of NGC253 and NGC3256. Both in M51 and in M83, no large-scale correlation between H i emission and that of [C ii] is seen, indicating again that [C ii] does not trace the diffuse neutral medium (Nikola et al. 2001; Crawford et al. 1985).
Nikola et al. (2001) used H i column densities (Tilanus & Allen 1991; Rots et al. 1990) to derive the contribution to the [C ii] emission in M51, assuming the same range of temperatures, densities, and ionization fractions for the warm and cold neutral medium (WNM, CNM) as have been found for the Milky Way. They find that the contribution of the WNM is negligible for most of the M51 disk except the northwest, which was not studied here. The contribution of the CNM is estimated to be less than 10%20% in all regions but the northwest.
We have thus not corrected the [C ii] emission for a possible contribution from the diffuse neutral medium.
4.2.2 The infrared continuum and the FUV field
The stellar FUV photons heat the molecular gas and dust which subsequently cools via the FIR dust continuum and, with a fraction of less than % (Stacey et al. 1991),MKH01 via [C ii], [O i](63), and other cooling lines. To the extent that filling factors are 1 and other heating mechanisms like cosmic ray heating can be neglected, the observed TIR continuum intensity should equal the modelled FUV field. This is also expected if a constant fraction of FUV photons escape without impinging on cloud surfaces.
The PDR model of Kaufman et al. (1999) assumes a semi-infinite slab illuminated from one side only. For the extragalactic observations described here, we however have several PDRs within one beam and the clouds are illuminated from all sides. Hence, the optically thin total IR intensity stems from the near and far sides of clouds. Here, this is taken into account by dividing the observed TIR by 2 (Kaufman et al. 1999): (cf. Sec.2.4). While this correction holds exactly only for finite plane parallel slabs illuminated from both sides, it is a good first approximation. The corrected TIR can then be used to derive the corresponding FUV intensity via = TIRc ergs cm-2 s-1. Following the arguments of Kaufman et al. (1999), the additional factor 2 takes into account equal heating of the grains by photons outside the FUV band, i.e. by photons of eV. We find a variation by one order of magnitude, (Table 7, Fig. 4).
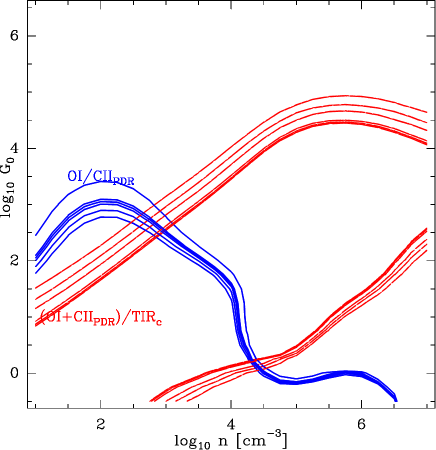
4.2.3 First estimates of FUV field and density
The two intensity ratios [O i](63)/[C ii]PDR and ([O i](63)[C ii]PDR)/TIRc, of the two major PDR cooling lines and the continuum, have been used extensively to derive the density and FUV field of the emitting regions (e.g. MKH01). Since [O i](63) and [C ii] are the dominant coolants, the latter ratio is a good measure of the photoelectric heating efficiency (e.g. Kaufman et al. 1999). The former ratio measures the relative importance of [C ii] vs [O i](63) cooling. For high FUV fields and high densities, the ratio becomes larger than one (Kaufman et al. 1999).
In M83 and M51, the intensity ratio [O i](63)/[C ii]PDR varies only slightly between 0.8 and 1.3 (Table 8b). The heating efficiency varies between and 0.36% at the outskirt positions while it drops to below 0.21% in the centers.
The values which we find in M83 and M51 lie within the range covered by MKH01, who find heating efficiencies ranging between % and % for the 60 galaxies studied, while the [O i]/[C ii] ratios range between 0.3 and . Though the scatter is large, the heating efficiency tends to be high for [O i]/[C ii] ratios of less than 2. The [O i](63)/[C ii]PDR ratios found in M83 and M51 agree roughly with the average value found by MKH01, while the heating efficiencies in M83 and M51 span the average value of MKH01 upto the highest efficiencies found by them.
MKH01 corrected the observed [C ii] emission by roughly 50% when taking into account the contribution from the ionized medium, based on the Milky Way results. Here, we corrected by only 15% to 30% (Table 8b). This uncertainty in how best to correct the [C ii] fluxes, needs to be considered when comparing the derived heating efficiencies and [O i]/[C ii] ratios.
The small scatter of the observed two ratios at the 6 positions in M83 and M51 indicates that the emitting gas has similar physical properties. Comparison with the results of the Kaufman PDR model shows that two solutions exist (Figure 3). The data can be reproduced either by high FUV fields at low densities or by low FUV fields and high densities. The high- solution indicates and . As we will show, the low- solution is less plausible. It indicates rather high densities of and low FUV fields of . In this case, the observed [C ii] intensities are more than three orders of magnitude larger than the modelled intensities which would indicate that many PDR slabs along the lines of sight. Since the optical depth of the [C ii] line in the line centers is expected to be about one (Kaufman et al. 1999), this scenario is discarded. This argument also holds when velocity filling is taken into account, since the velocity filling factor is at all positions, as discussed below. We note that Higdon et al. (2003) in their analysis of ISO/LWS data of M33, also discussed the two possible PDR solutions, and, following a different line of reasoning, also preferred the high- solution.
The values we find for the high- solution, agrees with the average values found by MKH01 who also exclude the low- solution. Their sample of 60 unresolved galaxies covers a slightly larger range of values: and . Our values also agree with the average value found in NGC 6946 by Contursi et al. (2002).
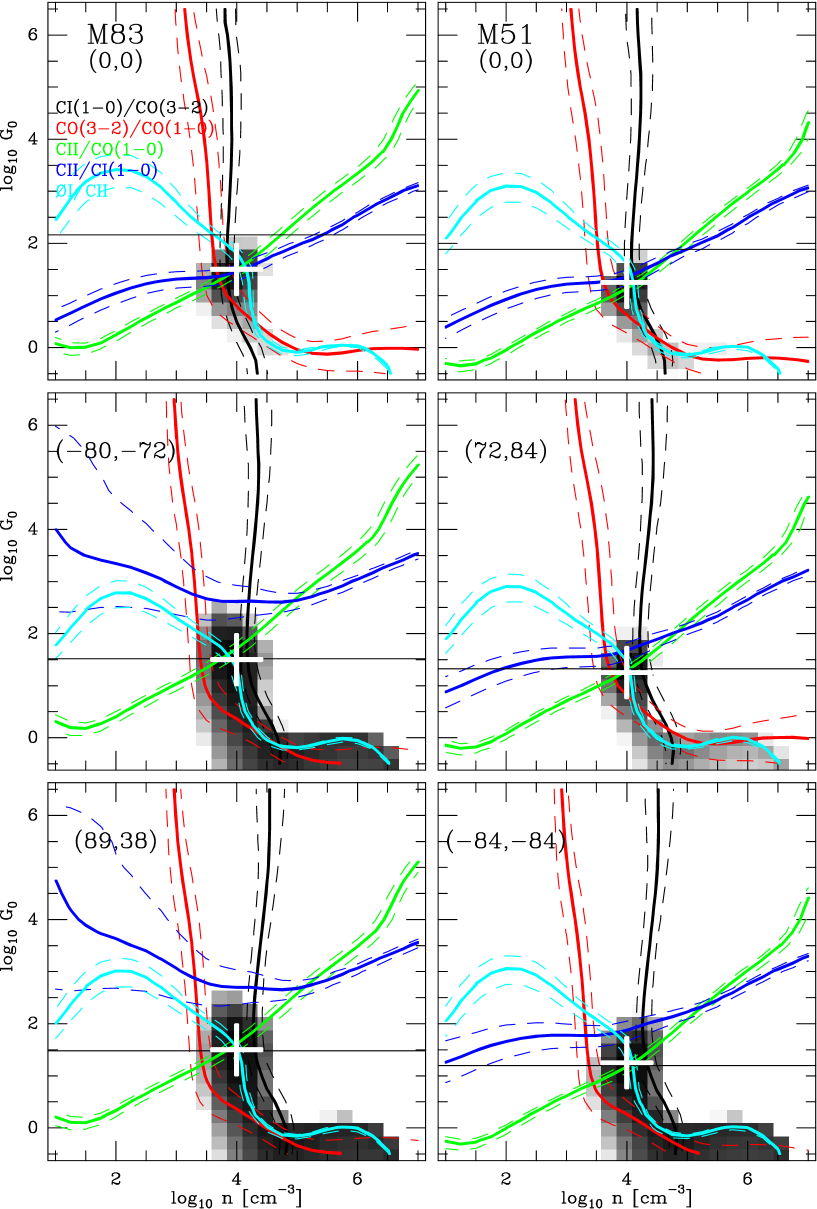
4.2.4 PDR model fitting of five line ratios
In order to determine with greater confidence the densities and UV fluxes which can explain the intensity ratios, we have performed a fitting of the observed 5 line intensity ratios [C ii]PDR/[C i](1–0), [C i](1–0)/CO(3–2), CO(3–2)/CO(1–0), [C ii]/CO(3–2), and, [O i](63)/[C ii]PDR relative to the predictions of the PDR model by Kaufman et al. (1999):
with the observed and modelled ratios and , and the error which is assumed to be 20% for all ratios333There are two degrees of freedom since we use four independent line ratios to fit two parameters.. In Fig. 4 each panel shows the observed line intensity ratios and the calculated reduced in greyscale for each observed position in M83 and M51. Table 7 summarizes the local density () and FUV radiation field () at the position of minimum reduced corresponding to the best fit models thus identified. The [C i](1–0)/CO(3–2) and the CO(3–2)/(1–0) ratios are excellent tracers of the local densities, almost independent of for . The sensitivity of [C ii] on the FUV field is reflected by the line ratios which include [C ii]. The combination of all these ratios therefore allows, in principle, to deduce and .
Densities.
Though the quality of the fit varies strongly between the six positions, the best fitting FUV field and density are almost identical: and (Table 7). Model surface temperatures are K. This is slightly lower than the upper energy level of [C ii](158), K, and much lower than the corresponding level of [O i](63), K. Since the critical densities of the two [O i] lines for collisions with H are also high, cm-3, the [O i] lines are subthermally excited. Nevertheless, gas cooling is dominated by [C ii] and [O i], contributions from H2 or Si, covered by ISO/SWS, are negligible at these low temperatures. The best fitting density agrees within a factor of 3 with the local densities derived above via simple radiative transfer analysis, using only the 12CO and 13CO line ratios (Table 6).
UV filling factor.
At the four spiral arm positions, the total infrared continuum agrees perfectly with the best fitting FUV field (Table 7), which is an independent confirmation of the validity of the PDR analysis using the five line ratios. The active center regions of M83 and M51 show filling factors of , indicating that other sources than PDRs heat the dust leading to the high observed TIR intensities, e.g. massive protostars.
Quality of the fits.
The minimum reduced chi squared of the 4 independent ratios lie between 3 and 15 at all positions (Table 7). While the two nuclei and the NE-spiral arm position of M51 show of better than 5, the other three spiral arm positions show rather poor values of 13–15.
Inspection of Figure 4 shows that, at the latter three positions, the [C ii]PDR/[C i] ratio indicates higher FUV fields than the best fitting solution. In addition, Figure 4 also shows that the CO 3–2/1–0 line ratios indicates systematically lower densities than the observed [C i]/CO 3–2 ratios. This holds to varying degrees for all positions and for . By assuming [C i] intensities which are a factor 2 higher, the quality of the fit is considerably improved, while the best fitting and density stay constant at all positions. At (,) in M83 for example, the is improved from 12.9 to 3.4. This indicates that the beam filling factors of the [C i] emission, derived from the CO 2–1 data (Table 5), are too small, i.e. [C i] is more extended than CO.
We also conclude that our results are consistent with the assumption that only the dense ionized medium contributes to the [C ii] emission. There is no need for an extended diffuse component.
Overall, the observed five ratios cannot be well fitted with a single plane-parallel PDR model of constant density at any of the positions. This is not surprising as the excitation requirements of the various tracers collected here vary widely. Especially, the critical densities vary between cm-3 for the lower [C i] transition and cm-3 for the [O i] 63m transition. Any density gradients in the emitting medium may thus lead to the above discrepancies with a single PDR model depending also on the chemical and temperature structure. In addition, the large difference between local densities derived here and beam averaged densities of more than three orders of magnitude (Table 6) shows that the emitting volume must be filled with very small but dense structures. From many Galactic observations, it is expected that these structure show a spectrum of masses, adding to the complexity ignored here.
Absolute intensities.
When comparing the observed intensities with the model results, the velocity filling has also to be taken into account. The observed [C i] line widths range between 30 and 130 kms-1 FWHM (cf. Sec.3.1 and 3.2) measuring the dispersion of clouds within the beam for these extragalactic observations. On the other hand, the microturbulent velocity dispersion of the gas of one PDR model is set to 1.5 kms-1 (Kaufman et al. 1999), corresponding to a Gaussian FWHM of 3.5 kms-1 as is typical for individual Galactic clouds. To calculate the [C i] area filling factors (Table 7), we divided the observed [C i] intensities by the predicted [C i] intensity from the best fitting model, corrected for beam (Table 5) and velocity filling, viz.,
[C i] emission fills only a few percent of the beam, the derived area filling factors vary between (Table 7), consistent with the low volume filling factors described above.
5 Summary
We have studied all major submillimeter and far infrared cooling lines together with the dust total infrared continuum at the center positions of the two galaxies M83 and M51 and at four spiral arm positions.
We observed [C i] 1–0 at the six positions at resolution. Complementary [C ii], [O i](63), and [N ii](122) data were obtained from ISO/LWS at resolution. CO maps of the lowest three transitions were obtained from the literature and smoothed to the ISO/LWS resolution. We also obtained pointed 13CO 1–0 and 2–1 data at all positions. In order to allow a comparison of all these data, the [C i] and 13CO data were scaled with beam filling factors derived from the 12CO data. For completeness, we also obtained the total far-infrared continuum intensities from HIRES/IRAS m and m data.
-
•
Integrated intensities peak in the two centers. However, M83 is much more centrally peaked than M51 as seen in CO and [C i] as is already seen in the spectra (Figs. 1,2). This is seen even more drastically in the drop of [C i] luminosities with galacto-centric distance. In M83, luminosities drop by more than one order of magnitude over kpc, while in M51, they drop by only a factor of 4 over kpc. Obviously, this analysis should be refined by more observations of [C i] at different radii.
-
•
The 12CO 3–2/1–0 line ratios lie below 0.6 at all positions, indicating subthermal excitation of the 3–2 line, i.e. densities are less than cm-3. This is confirmed by more detailed analysis using escape probability and PDR models. The former homogeneous models indicate densities between and cm-3 from CO and 13CO line ratios.
-
•
We estimated the fraction of observed [C ii] emission originating from the ionized medium by using the [N ii] 122m data which solely traces this medium. In the absence of additional data, which would allow to seperate the contributions from the different phases of the ionized medium, we argue that dense H ii regions are the primary source of [N ii] emission. These emit 15% to 30% of the observed [C ii] emission while the remainder stems from PDRs.
-
•
The gas heating efficiency was calculated from the ratio of the two major gas coolants [O i] at 63 m and [C ii]PDR at 158 m versus the total infrared intensity. The efficiency is low in the centers showing ratios of (1.6–2.1) , while the outer positions show higher ratios of (2.5–3.6) . The latter efficiencies lie at the high end of efficiencies observed by MKH01 in a sample of 60 unresolved normal galaxies.
-
•
We fitted the observed line intensity ratios [C ii]PDR/[C i](1–0), [C i](1–0)/CO(3–2), CO(3–2)/CO(1–0), [C ii]/CO(3–2), and, [O i](63)/[C ii]PDR to the predictions of the PDR model of Kaufman et al. (1999). The best fits yield densities of cm-3 and FUV fields of times the average interstellar, almost constant at the six positions studied here at resolution. This finding may be a selection effect, since we selected the four outer positions for their high star forming activity. More observations of other less prominent positions are needed to study variation of physical parameters over the galaxy surfaces.
-
•
Filling factors vary significantly between the center positions and the outer positions in both galaxies. The filling factor derived from the FUV field calculated from the observed total infrared intensity versus the fitted lies at 1 at the spiral arm positions, with a scatter of less than 20%. In contrast, the nuclei show ratios of . The density contrasts within the emitting gas must be high, given the local densities of cm-3 and the average densities, derived from CO column densities, of less than 1 cm-3, leading to very low volume filling factors. In accordance, the area filling factors of the [C i] emission are less than 2% at all positions.
-
•
The reduced chi squared lie between 3 and 5 at three positions, including the two nuclei, while the fits are worse at the three other positions, which show = 13–15. It is shown that the fits can be significantly improved by assuming that [C i] emission is more extended.
While the present analysis led to the results listed above, it needs to be refined with new data and improved modelling. The assumption that all gas tracers have the same filling factors may not be justified. We find indications that [C i] is more extended than CO 2–1. Clearly, maps of [C i] at resolution filling the ISO/LWS beam would be needed to verify this conclusion. A related question is the nature of the interclump medium and whether it can be ignored when interpreting the submm/FIR emission. The fraction of [C ii] emission from the different phases of the ionized medium has been addressed here by assuming that all emission stems from the dense ionized medium. While this is consistent with the PDR modelling, it probably is an oversimplification. Observations of the [N ii] line at m would allow to refine this analysis. Such observations will become possible with a new generation of submm telescopes and receivers operating at high altitudes. In this regard, modelling neads to include the ionized medium. Improved PDR models need to consider a distribution of clouds within each beam, following mass and size distribution laws.
Acknowledgements.
We thank Steve Lord for valuable discussions. We would like to thank the JCMT and the IRAM 30m staff for providing excellent support during several long runs at the Mauna Kea and the Pico Veleta. We are greatful to Michael Dumke for providing us with HHT CO 3–2 and 4–3 M51 data and Lucian Crosthwaite to provide NRAO CO 1–0 and 2–1 M83 data. And we thank Jim Brauher, Steve Lord, and Alessandra Contursi for providing us with the ISO/LWS line fluxes of both galaxies. The James Clerk Maxwell Telescope is operated by the Joint Astronomy Centre on behalf of the Particle Physics and Astronomy Research Council of the United Kingdom, the Netherlands Organisation for Scientific Research, and the National Research Council of Canada. This work has benefited from research funding from the European Community’s Sixth Framework Programme. We made use of the NASA IPAC/IRAS/HiRes data reduction facilities.References
- Aalto et al. (1999) Aalto, S., Huettemeister, S., Scoville, N. Z., & Thaddeus, P. 1999, ApJ, 522, 165
- Asplund et al. (2004) Asplund, M., Grevesse, N., Sauval, A. J., Allende Prieto, C., & Kiselman, D. 2004, A&A, 417, 751
- Aumann et al. (1990) Aumann, H., Fowler, J., & Melnyk, M. 1990, AJ, 99, 1674
- Bakes & Tielens (1994) Bakes, E. & Tielens, A. 1994, apj, 427, 822
- Bayet et al. (2004) Bayet, E., Gerin, M., Phillips, T., & Contursi, A. 2004, A&A, 427, 45
- Bennett et al. (1994) Bennett, C., Fixsen, D., & et al., G. H. 1994, ApJ, 434, 587
- Carral et al. (1994) Carral, P., Hollenbach, D. J., Lord, S. D., et al. 1994, ApJ, 423, 223
- Carranza et al. (1969) Carranza, G., Crillon, R., & Monnet, G. 1969, A&A, 1, 479
- Contursi et al. (2002) Contursi, A., Kaufman, M., Helou, G., et al. 2002, ApJ, 124, 751
- Crawford et al. (1985) Crawford, M., Genzel, R., Townes, C., & Watson, D. 1985, ApJ, 291, 755
- Crosthwaite et al. (2002) Crosthwaite, L., Turner, J., Buchholz, L., Ho, P., & Martin, R. 2002, ApJ, 123, 1892
- Dale et al. (2001) Dale, D. A., Helou, G., Contursi, A., Silbermann, N. A., & Kolhatkar, S. 2001, apj, 549, 215
- de Vaucouleurs (1979) de Vaucouleurs, G. 1979, AJ, 84, 1270
- de Vaucouleurs et al. (1991) de Vaucouleurs, G., de Vaucouleurs, A., Corwin, H. J., et al. 1991, Third reference catalogue of bright galaxies (New York: Springer-Verlag)
- Dumke et al. (2001) Dumke, M., Nieten, C., Thuma, G., Wielebinski, R., & Walsh, W. 2001, A&A, 373, 853
- Fixsen et al. (1999) Fixsen, D. J., Bennett, C. L., & Mather, J. C. 1999, ApJ, 526, 207
- Frerking et al. (1982) Frerking, M. A., Langer, W. D., & Wilson, R. W. 1982, ApJ, 262, 590
- Garcia-Burillo et al. (1993a) Garcia-Burillo, S., Combes, F., & Gerin, M. 1993a, A&A, 274, 148
- Garcia-Burillo et al. (1993b) Garcia-Burillo, S., Guelin, M., & Cernicharo, J. 1993b, A&A, 274, 123
- Garcia-Burillo et al. (1992) Garcia-Burillo, S., Guelin, M., Cernicharo, J., & Dahlem, M. 1992, A&A, 266, 21
- Garnett et al. (2004) Garnett, D. R., Edmunds, M. G., Henry, R. B. C., Pagel, B. E. J., & Skillman, E. D. 2004, AJ, 128, 2772
- Garnett et al. (1999) Garnett, D. R., Shields, G. A., Peimbert, M., et al. 1999, ApJ, 513, 168
- Genzel (1991) Genzel, R. 1991, in The Galactic Interstellar Medium, ed. W. Burton, B. Elmegreen, & R. Genzel (Berlin, Germany: Springer-Verlag), 280
- Gerin & Phillips (2000) Gerin, M. & Phillips, T. 2000, ApJ, 537, 644
- Gry et al. (2003) Gry, C., Swinyard, B., Harwood, A., et al. 2003, The ISO Handbook. Vol. III. LWS - The long wavelength spectrometer (ISO Data Centre: ESO)
- Habing (1968) Habing, H. 1968, Bull. Astr. Inst. Netherlands, 19, 421
- Handa et al. (1990) Handa, T., Nakai, N., Sofue, Y., Hayashi, M., & Fujimoto, M. 1990, PASJ, 41, 1
- Heiles (1994) Heiles, C. 1994, ApJ, 436, 720
- Helou et al. (1988) Helou, G., Khan, I., Malek, L., & Boehmer, L. 1988, apj, 68, 151
- Higdon et al. (2003) Higdon, S. J. U., Higdon, J. L., van der Hulst, J. M., & Stacey, G. J. 2003, ApJ, 592, 161
- Ho et al. (1997) Ho, L., Fillipenko, A., & Sargent, W. 1997, ApJ, 112, 315
- Israel (2004) Israel, F. 2004, in Kluwer Academic Publishers, 1
- Israel & Baas (2001) Israel, F. P. & Baas, F. 2001, A&A, 371, 433
- Israel & Baas (2002) Israel, F. P. & Baas, F. 2002, A&A, 383, 82
- Israel & Baas (2003) Israel, F. P. & Baas, F. 2003, A&A, 404, 495
- Kaufman et al. (1999) Kaufman, M., Wolfire, M., Hollenbach, D., & Luhman, M. 1999, ApJ, 527, 795
- Keene (1995) Keene, J. 1995, in The physics and chemistry of the interstellar medium, ed. G. Winnewisser & G.C.Pelz (Berlin: Springer)
- Kenney & Lord (1991) Kenney, J. & Lord, S. 1991, ApJ, 381, 118
- Kennicutt et al. (2003) Kennicutt, R., Armus, L., Bendo, G., & Calzetti, D. 2003, PASP, 115, 928
- Kohno et al. (1996) Kohno, K., Kawabe, R., Tosaki, T., & Okumura, S. 1996, ApJ, 461, 29
- Leech et al. (1999) Leech, K. J., Völk, H. J., Heinrichsen, I., et al. 1999, MNRAS, 310, 317
- Lord & Kenney (1991) Lord, S. & Kenney, J. 1991, ApJ, 381, 130
- Lundgren et al. (2004a) Lundgren, L., Olofsson, H., Wiklind, T., & Rydbeck, G. 2004a, A&A, 422, 865
- Lundgren et al. (2004b) Lundgren, L., Wiklind, T., Olofsson, H., & Rydbeck, G. 2004b, A&A, 413, 505
- Malhotra et al. (2001) Malhotra, S., Kaufman, M., Hollenbach, D., et al. 2001, ApJ, 561, 766
- Matsushita et al. (1998) Matsushita, S., Kohno, K., Vila-Vilaro, B., Tosaki, T., & Kawabe, R. 1998, ApJ, 495, 267
- Matsushita et al. (1999) Matsushita, S., Kohno, K., Vila-Vilaro, B., Tosaki, T., & Kawabe, R. 1999, Adv. Space Res., 23, 1015
- Matsushita et al. (2004) Matsushita, S., Sakamoto, K., Kuo, C.-Y., et al. 2004, ApJ, 999, 999
- Mauersberger & Henkel (1993) Mauersberger, R. & Henkel, C. 1993, Rev. Mod. Astron., 6, 69
- Mauersberger et al. (1999) Mauersberger, R., Henkel, C., Walsh, W., & Schulz, A. 1999, A&A, 341, 256
- Meyer et al. (1997) Meyer, D. M., Cardelli, J. A., & Sofia, U. J. 1997, ApJ, 490, 103
- Mezger (1978) Mezger, P. O. 1978, A&A, 70, 565
- Mueller et al. (1987) Mueller, P., Reif, K., & Reich, W. 1987, A&A, 183, 327
- Nakai et al. (1994) Nakai, N., Kuno, N., Handa, T., & Y. Sofue, Y. 1994, PASJ, 46, 527
- Negishi et al. (2001) Negishi, T., Onaka, T., Chan, K.-W., & Roellig, T. L. 2001, A&A, 375, 566
- Neri et al. (2003) Neri, R., Genzel, R., Ivison, R. J., et al. 2003, ApJ, 597, 113
- Nieten et al. (1999) Nieten, C., Dumke, M., Beck, R., & Wielebinski, R. 1999, A&A, 347, 5
- Nikola et al. (2001) Nikola, T., Geis, N., Herrmann, F., et al. 2001, ApJ, 561, 203
- Papadopoulos et al. (2004) Papadopoulos, P. P., Thi, W.-F., & Viti, S. 2004, MNRAS, 351, 147
- Petitpas & Wilson (1998) Petitpas, G. & Wilson, C. 1998, ApJ, 503, 219
- Petuchowski & Bennett (1993) Petuchowski, S. & Bennett, C. 1993, ApJ, 405, 591
- Petuchowski et al. (1994) Petuchowski, S. J., Bennett, C. L., Haas, M. R., et al. 1994, ApJ, 427, L17
- Pety et al. (2004) Pety, J., Beelen, A., Cox, P., et al. 2004, apj, 428, 21
- Rand et al. (1999) Rand, R., Lord, S., & Higdon, J. 1999, ApJ, 513, 720
- Regan et al. (2001) Regan, M., Thornley, M., Helfer, T., et al. 2001, ApJ, 561, 218
- Rice et al. (1988) Rice, W., Lonsdale, C. J., Soifer, B. T., et al. 1988, ApJ, 68, 91
- Rots et al. (1990) Rots, A., Crane, P., Bosma, A., Athanassoula, E., & van der Hulst, J. 1990, Astronomical Journal, 100, 387
- Rubin (1985) Rubin, R. H. 1985, ApJS, 57, 349
- Rubin et al. (1993) Rubin, R. H., Dufour, R. J., & Walter, D. K. 1993, ApJ, 413, 242
- Rubin et al. (1988) Rubin, R. H., Simpson, J. P., Erickson, E. F., & Haas, M. R. 1988, ApJ, 327, 377
- Sakamoto et al. (2004) Sakamoto, K., Matsushita, S., Peck, A., Wiedner, M., & Iono, D. 2004, ApJ, 999, 999
- Sakamoto et al. (1999) Sakamoto, K., Okumura, S., Ishizuki, S., & Scoville, N. 1999, ApJ, 124, 403
- Sandage & Tammann (1975) Sandage, A. & Tammann, G. 1975, ApJ, 196, 313
- Sofia et al. (1997) Sofia, U. J., Cardelli, J. A., Guerin, K. P., & Meyer, D. M. 1997, ApJ, 482, L105+
- Stacey et al. (1991) Stacey, G., Geis, N., Genzel, R., et al. 1991, ApJ, 373, 423
- Stoerzer et al. (1996) Stoerzer, H., Stutzki, J., & Sternberg, A. 1996, A&A, 310, 592
- Stutzki & Winnewisser (1985) Stutzki, J. & Winnewisser, G. 1985, A&A, 144, 13
- Talbot et al. (1979) Talbot, R. J., Jensen, E. B., & Dufour, R. J. 1979, ApJ, 229, 91
- Thim et al. (2003) Thim, F., Tammann, G. A., Saha, A., et al. 2003, ApJ, 590, 256
- Tielens & Hollenbach (1985) Tielens, A. & Hollenbach, D. 1985, ApJ, 291, 722
- Tilanus & Allen (1991) Tilanus, R. & Allen, R. 1991, A&A, 244, 8
- Tosaki et al. (2002) Tosaki, T., Hasegawa, T., Shioya, Y., Kuno, N., & Matsushita, S. 2002, PASJ, 54, 209
- Tully (1988) Tully, R. 1988, Nearby Galaxies Catalogue (Cambridge: University Press)
- Walter et al. (2004) Walter, F., Carilli, C., Bertoldi, F., et al. 2004, ApJ, 615, 17
- Weiss et al. (2005) Weiss, A., Downes, D., Henkel, C., & Walter, F. 2005, A&A, 429, 25
- Weiss et al. (2003) Weiss, A., Henkel, C., Downes, D., & Walter, F. 2003, A&A, 409, 41
- Wielebinski et al. (1999) Wielebinski, R., Dumke, M., & Nieten, C. 1999, A&A, 347, 634
- Zaritsky et al. (1994) Zaritsky, D., Kennicutt, R. C., & Huchra, J. P. 1994, ApJ, 420, 87