Feedback and Brightest Cluster Galaxy Formation: ACS Observations of the Radio Galaxy TN J1338–1942 at 11affiliation: Based on observations made with the NASA/ESA Hubble Space Telescope, which is operated by the Association of Universities for Research in Astronomy, Inc., under NASA contract NAS 5-26555. These observations are associated with program # 9291
Abstract
We present deep optical imaging of the radio galaxy TN J1338–1942 obtained using the Advanced Camera for Surveys (ACS) on-board the Hubble Space Telescope as well as ground-based near-infrared imaging data from ESO/VLT. The radio galaxy is known to reside within a large galaxy overdensity (both in physical extent and density contrast). There is good evidence that this ‘protocluster’ region is the progenitor of a present-day rich galaxy cluster. TN J1338 is the dominant galaxy in the protocluster, in terms of size and luminosity (in both the optical and near-infrared) and therefore seems destined to evolve into the brightest cluster galaxy.
The high spatial-resolution ACS images reveal several kpc-scale features within and around the radio galaxy. The continuum light is aligned with the radio axis and is resolved into two clumps in the and bands. These components have luminosities and sizes of a few kpc. The estimated nebular continuum, scattered light, synchrotron and inverse-Compton scattering contributions to the aligned continuum light are only a few percent of the observed total, indicating that the observed flux is likely dominated by forming stars. The estimated star-formation rate for the whole radio galaxy is yr-1. A simple model in which the jet has triggered star-formation in these continuum knots is consistent with the available data.
A striking, but small, linear feature is evident in the aligned light and may be indicative of a large-scale shock associated with the advance of the radio jet. The rest of the aligned light also seems morphologically consistent with star-formation induced by shocks associated with the radio source, as seen in other high- radio galaxies (e.g., 4C 41.17). An unusual feature is seen in Lyman- emission. A wedge-shaped extension emanates from the radio galaxy perpendicularly to the radio axis. This ‘wedge’ naturally connects to the surrounding, asymmetric, large-scale ( kpc) Lyman- halo. We posit that the wedge is a starburst-driven superwind, associated with the first major epoch of formation of the brightest cluster galaxy. The shock and wedge are examples of feedback processes due to both AGN and star-formation in the earliest stages of massive galaxy formation.
1 Introduction
The most massive galaxies in the local Universe reside in the centers of rich clusters. Within the context of hierarchical models of biased galaxy formation, the mass of a galaxy and its clustering properties are naturally connected via the initial density fluctuations (e.g., Kaiser, 1984). Therefore, not only locally, but throughout cosmic time, massive galaxies mark the densest regions of the Universe. The study of young overdensities at high redshift (‘protoclusters’) then also traces the history of the future brightest cluster galaxies.
Many observing programs, spanning wavelengths from radio to X-ray, have been devoted to identifying galaxy overdensities over a large range of redshift (e.g., Postman et al., 1996; Scharf et al., 1997; Stanford et al., 1997; Rosati et al., 1998; Oke, Postman, & Lubin, 1998; Rosati et al., 1999; Holden et al., 1999; Kurk et al., 2000; Pentericci et al., 2000a; Holden et al., 2000; Donahue et al., 2001; Francis et al., 2001; Stanford et al., 2002; Postman et al., 2002; Donahue et al., 2002; Mullis et al., 2003; Miley et al., 2004). To date the most distant protoclusters have been found at (Shimasaku et al., 2003; Venemans et al., 2004). Do these very young overdensities already contain a dominant, massive galaxy?
There are several observational clues to the mass of a high-redshift galaxy. One is the observed -band magnitude, which probes the rest-frame optical out to . Another is the presence of a high luminosity active nucleus (a supermassive accreting black-hole), which implies the existence of a large spheroidal host galaxy at least locally (Magorrian et al., 1998; Gebhardt et al., 2000; Ferrarese & Merritt, 2000). High-redshift radio galaxies (HzRGs) are bright at and harbor powerful nuclei (Jarvis et al., 2001a; De Breuck et al., 2002; Willott et al., 2003; Jarvis & McLure, 2002). Therefore the fields surrounding HzRGs are important targets for studying the earliest examples of massive galaxies and clusters. Using a narrow-band Lyman- imaging program Miley and collaborators discovered an overdensity of star-forming galaxies around all four radio galaxies observed to sufficient depth, out to (Venemans et al., 2004). The resulting set of protoclusters is the subject of several on-going studies. This discovery also implies that the radio galaxies are the seeds of brightest cluster galaxies.
Brightest cluster galaxies (BCGs) are the most massive galaxies known in the local Universe; having stellar masses in excess of (Jørgensen, Franx, & Kjærgaard, 1996; Bernardi et al., 2003). The luminosities and sizes of brightest cluster galaxies are not drawn from the same distributions as the majority of the galaxy population (Oegerle & Hoessel, 1991). BCGs at low redshift lie on the extrapolated Fundamental Plane of elliptical galaxies (Oegerle & Hoessel, 1991). The surface-brightness profiles of some BCGs, the cD galaxies, extend out to hundreds of kiloparsecs. These shallow power-law stellar envelopes blur the distinction between the galaxy and the diffuse intracluster light. Such extreme sources are clearly very useful laboratories for studying the processes inherent to massive galaxy and cluster formation. In fact, several authors have shown that the observed build-up of BCGs can provide key constraints on the hierarchical theory of galaxy formation (Aragon-Salamanca, Baugh, & Kauffmann, 1998; Burke, Collins, & Mann, 2000). The present discrepancies between the predicted (using semi-analytic models) and observed abundance of massive galaxies imply that fundamental processes are not being accounted for in the current models (Cole et al., 2000; Baugh et al., 2003; Somerville et al., 2004). One possibility to solve this discrepancy is to postulate the existence of strong interactions between accreting black-holes, star-formation and their host galaxy and surroundings (i.e., “feedback”).
Galaxies which host powerful radio sources are peculiar in several respects. The most striking property is the radio-optical ‘alignment effect’. This effect is the strong tendency of the rest-frame ultraviolet continuum light of the radio host to be aligned with the axis defined by the radio source. Several explanations for this behavior have been put forward: recent star-formation induced by the radio jet, nebular continuum from emission line gas which is photo or shock ionized by the AGN, light from the central engine scattered into the line of sight by either dust or electrons, and inverse-Compton scattering of the microwave background or other local photon fields (McCarthy et al., 1987; Chambers, Miley, & van Breugel, 1987; Daly, 1992; Dickson et al., 1995). These explanations of the alignment, but particularly the jet-induced star-formation, are excellent examples of feedback on the galaxy formation process.
The giant (100 kpc) Lyman- emitting halos surrounding distant radio galaxies may be an observable consequence of feedback from galaxy formation (e.g., van Ojik et al., 1997; Reuland et al., 2003). The enormous line luminosities of these objects, often in excess of ergs s-1, imply they are massive reservoirs of gas (Kurk et al., 2000; Steidel et al., 2000). What is the origin of this gas; outflow from the galaxy or infall of primordial material? There are several pieces of circumstantial evidence that these halos are connected with the AGN. The halos are often aligned with the FRII radio axis, and in some cases Ly emission is directly associated with radio structures (Kurk et al., 2003). Perhaps photoionization by the AGN or shocks due to the radio source expansion are responsible for the extended line emission. Spectroscopically, Ly absorption is seen in addition to the bright halo emission (e.g., van Ojik et al., 1997; Wilman et al., 2004). There is a good correlation between the amount of absorption and the size of the radio source (Jarvis et al., 2001b). A possible scenario is that a neutral hydrogen shell initially surrounds the radio source, but is subsequently ionized during the growth of the radio source. There are also some halos known which do not contain a bright radio source (Steidel et al., 2000) suggesting that perhaps the halo phenomenon is associated with the more general processes of galaxy formation, rather than being specific to active nuclei.
The radio galaxy TN J1338–1942 (; De Breuck et al., 1999) resides in one of the youngest protoclusters known (Venemans et al., 2002; Miley et al., 2004). This galaxy lies within a large Ly halo which shows unusually asymmetric morphology when compared to other similar radio sources (Venemans et al., 2002). In this paper we present high spatial-resolution HST Advanced Camera for Surveys (ACS) imaging of this radio galaxy. These data provide the clearest view of a young brightest cluster galaxy to date. Images in four broadband filters (,, and ) have been obtained. The resulting magnitudes and colors have been used to apply the ‘Lyman-break’ technique to select galaxies at the same redshift as the radio galaxy (Miley et al., 2004). The exquisite spatial resolution of HST/ACS allows us to study the detailed morphology of the radio galaxy. Using these data we present a scenario which describes the observed morphology (both continuum and Ly) and the measured kiloparsec-scale colors and magnitudes within a self-consistent formation framework for TN J1338–1942 (hereafter TN J1338).
This paper is structured as follows: we describe the observations and data reduction in § 2, we present the results of our analysis of the combined multi-wavelength dataset in § 3, and discuss these results in § 4. We adopt the ‘concordance’ cosmology (Spergel et al., 2003) with , and km s-1 Mpc-1. Within this cosmology the angular scale at the redshift of TN J1338, , is 7.0 kpc arcsec-1. We use the AB magnitude system (Oke & Gunn, 1983) except where noted.
2 Observations and Data Reduction
2.1 ACS Imaging
The ACS data of TN J1338 were taken with two primary goals in mind: first, to enable color-selection of faint protocluster members using the ‘Lyman-break’ technique and second, to investigate the detailed morphological structure of the brightest protocluster galaxies, including the radio galaxy. To achieve these goals, images were taken in 4 broad-band filters: (F475W), (F625W), (F775W) and (F805LP). The -band is below the Lyman-break for galaxies at . The -band contains (and for the case of the radio galaxy, is dominated by) the Lyman- emission line. Both the and bands are relatively unaffected by bright emission lines (see Table 1). However, we note that one emission line, CIII], may be affecting the -band morphology of the radio galaxy. The , and observations were carried out between 8 and 12 July 2002 and the images between 11 and 12 July 2003 with the Wide Field Channel of the ACS. The total observing time of 18 orbits was split between the broad-band filters 9400 seconds in , 9400 s in , 11700 s in , and 11800 sec in . Each orbit was split into two 1200 sec exposures to facilitate the removal of cosmic rays. dropouts were selected using the , and bands as described in Miley et al. (2004) and Overzier et al., in prep. This effort was very successful and confirmed the presence of a galaxy overdensity around TN J1338. In this paper we present the first discussion of the radio galaxy itself and its role as the dominant protocluster galaxy.
The ACS data were reduced using the ACS pipeline science investigation software (Apsis; Blakeslee et al., 2003a), developed for the ACS Guaranteed Time Observation (GTO) program. After the initial flat-fielding of the images through CALACS at STScI, the Apsis processing steps include the empirical determination of image offsets and rotations, the rejection of cosmic rays, the combining of images through drizzling, and object detection and photometry using SExtractor (Bertin & Arnouts, 1996). The final images have a scale of per pixel, and () limiting (AB) magnitudes of 28.46 ( ), 28.23 ( ), 28.07 ( ), and 27.73 ( ) in 0.2-arcsec2 apertures (corrected for Galactic extinction).
2.2 VLT Optical Imaging and Spectroscopy
Deep VLT/FORS2 images () of the TN J1338 field were made in March 2001 in both the broad-band filter ( Å, Å) and a custom narrow-band filter ( Å, Å) to target the redshifted Lyman- emission line (Venemans et al., 2002). The limiting surface-brightnesses are 28.6 and 29.2 per arcsec2 for the narrow and broad bands respectively. These images were used to identify candidate Ly emitting galaxies (Venemans et al., 2002). For the current paper these images are used to elucidate the larger scale structure of the Lyman- emission and to compare it to the structures seen in the ACS images.
A follow-up spectroscopy program using FORS2 in multiobject mode was carried out in May 2001. These spectra have a dispersion of 1.32 Å pixel-1 (using the 600RI grism) and cover the wavelength range from 5300 to 8000 Å. Candidate Ly galaxies were placed on two slit-masks (Venemans et al., 2002). The radio galaxy itself was included on both slitmasks providing a deep spectrum along the radio axis which covers both the Ly and CIV emission lines.
2.3 VLT NIR Imaging
-band images of TN J1338 were obtained in two separate observing runs. One on March 24–26 2002 collected 2.1 hours of total exposure time using ISAAC on UT1 of the Very Large Telescope (VLT). The second run, using the same instrument, was done in service mode at VLT between the nights of 27 May and 13 June 2004. The total exposure time for this run was 5.7 hours. All the data were processed, sky-subtracted and combined using the XDIMSUM package within IRAF111IRAF is distributed by the National Optical Astronomy Observatories, which are operated by the Association of Universities for Research in Astronomy, Inc., under cooperative agreement with the National Science Foundation. (Tody, 1993). The final image has a scale of 0.148′′per pixel, a seeing of , and a (, 1 sq. arcsec aperture) limiting magnitude of 25.6. ISAAC has some geometrical distortion across the face of the detector. We have not corrected the distortion in detail because the morphology of the radio galaxy matches features seen in the continuum ACS observations.
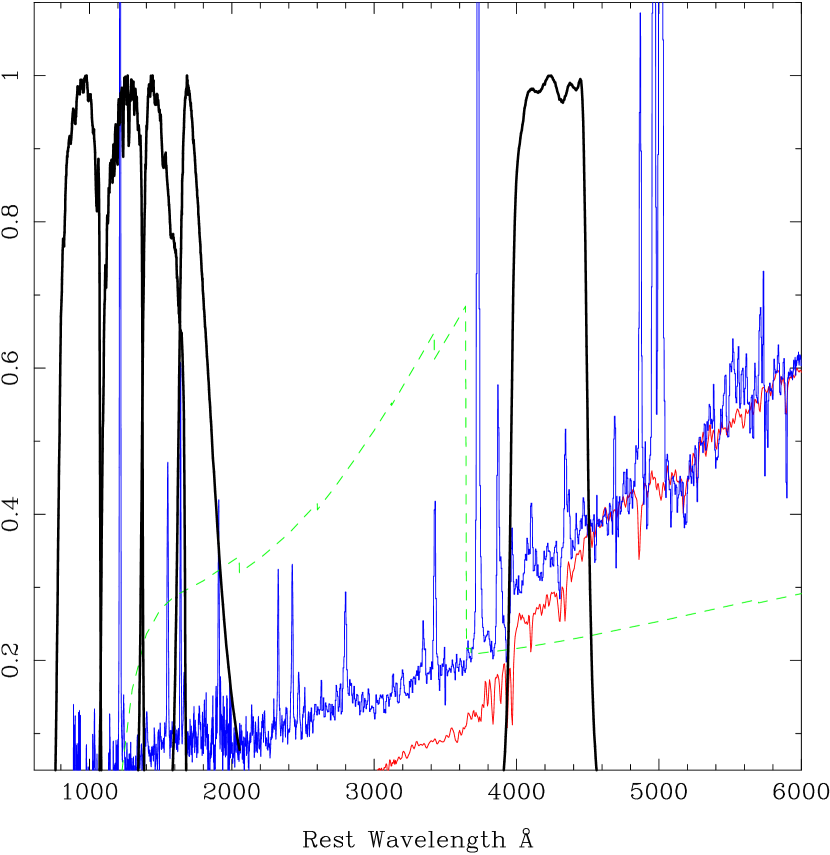
The -band is the only band which probes wavelengths longward of the 4000 Å break, beyond which an old stellar population should dominate the emergent flux (see Figure 1). It should be noted, however, that the bandpass is not entirely at Å. However, these data still provide a crucial point on the spectral energy distribution (SED) of the radio galaxy.
2.4 Radio Imaging
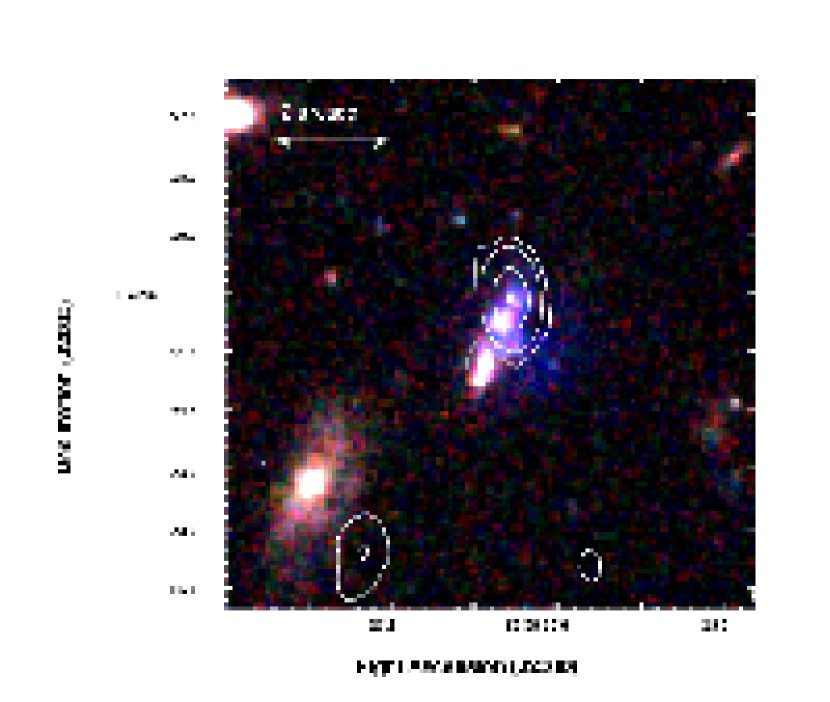
The radio source TN J1338 was originally selected because of its ultra-steep spectrum (between 365 MHz and 1.4 GHz) which has been shown to be an indicator of high redshift (De Breuck et al., 2000b). The first radio data were culled from the Texas and NVSS catalogs (Douglas et al., 1996; Condon et al., 1998). Follow-up observations were made with the VLA at 4.71 and 8.46 GHz in March 1998 (Pentericci et al., 2000b). The noise levels are 25 and 50 Jy beam-1 for the 8 and 5 GHz maps, respectively. The resolution is for the 8 GHz and for the 5 GHz map. These are the primary radio data used in this paper (see overlay in Figure 2). The radio source has three distinct components at both these frequencies; the northwest ( mJy) and southeast ( mJy) lobes (separated by ) and the likely radio core ( mJy) located very close () to the northwest lobe (De Breuck et al., 1999). The radio source is highly asymmetric, with the NW lobe nearly 20 times brighter at 4.7 GHz than the SE lobe. The radio asymmetry may indicate an asymmetry in the ambient medium (McCarthy, van Breugel, & Kapahi, 1991).
2.5 Image Registration
The center position, orientation and angular-resolution all differ between the ground-based and space-based data sets. To facilitate comparison amongst these datasets we registered them all to a common reference frame and pixel scale. The ACS images were registered with respect to each other in the ACS GTO pipeline. We chose the ACS frame as this common grid. For the ground-based and data this registration requires interpolation from plate-scales of and to per pixel respectively. The shifts, rotations and rebinning were all done in a single interpolation step using the IRAF tasks geomap and geotran. We fitted a general coordinate transformation using 2nd order polynomials in both axes. The rms deviations of the data from the fits were of order 0.3 input pixels () for the image and 0.07 input pixels () for the FORS2 narrow and broad band images. The calculated transformations were done using ‘sinc’ interpolation within geotran. At least 15-20 unsaturated stars were matched within the ACS -band and each of the ground-based images to calculate the appropriate transformations. We applied these transformations to the ground-based , narrow-band and images.
The optical/near-infrared frame is defined by stellar positions and that of the radio image is defined by the positions of radio point sources (quasars). The radio image of the TN J1338 field is sparse, so a direct matching of sources will not produce a robust transformation between the two frames; particularly when we do not want to use the radio galaxy itself. Therefore the accuracy limit to the radio-optical registration is determined solely by the systematic error in the optical reference frame. To better quantify this we have used two different optical frames, the USNO and the GSC-2.0, and compared the astrometric solutions using both to the radio data. This gives us a conservative amplitude of to the error on the position of the radio core with respect to the optical structures in the ACS and ground-based data. Therefore we can confidently associate the radio core with the region near the peak of the -band flux and at one tip of the ACS galaxy.
2.6 Continuum subtraction
To model the continuum in the we have used a power-law extrapolation from the relatively emission-line free and bands. While these filters are not strictly line-free due to the presence of CIV in the band, HeII in both passbands and, to a lesser extent, CIII] in the band, none of these lines are expected to dominate the continuum (based on spectroscopic data, see Table 1). We assume that the continuum follows a simple power-law in that extrapolates through to the ACS bandpass, VLT and narrow-bands. We have accounted for the intergalactic absorption shortward of the emission line and the relative throughputs of the filter curves. Light at wavelengths shorter than Lyman- is easily absorbed by neutral hydrogen located between the source and the observer. This will greatly affect the amount of continuum light detected in any bandpass shortward of the emission line. We have therefore adopted the model of the intergalactic hydrogen optical depth presented in Madau (1995); . This is the optical depth due to Lyman- forest lines, and not due to higher order Lyman series or metal lines. These two opacity sources make negligible contributions to the total optical depth at this redshift (Madau, 1995). We integrate this attenuation over the filter curve shortward of Ly to determine the amount of continuum flux absorbed in the intergalactic medium (IGM). This correction decreases the amount of continuum by 23.9%, 16.9% and 36.2% in the ACS , VLT and VLT narrow-bands respectively. In addition, the continuum flux detected in the images is affected by the filter throughput curves. The extrapolation from continuum measured in some filters (in our case, the ACS and ) to other bandpasses depends on the relative filter curves. We have used the total integrated throughputs to correct for the differential sensitivities. The final value of for the entire radio galaxy is (or , where ).
3 Results
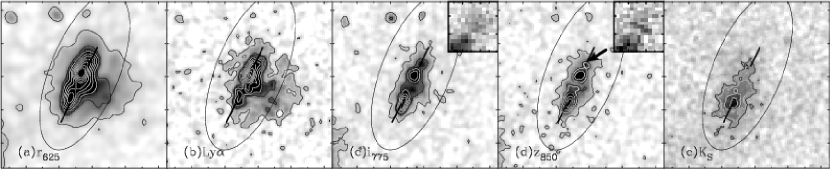
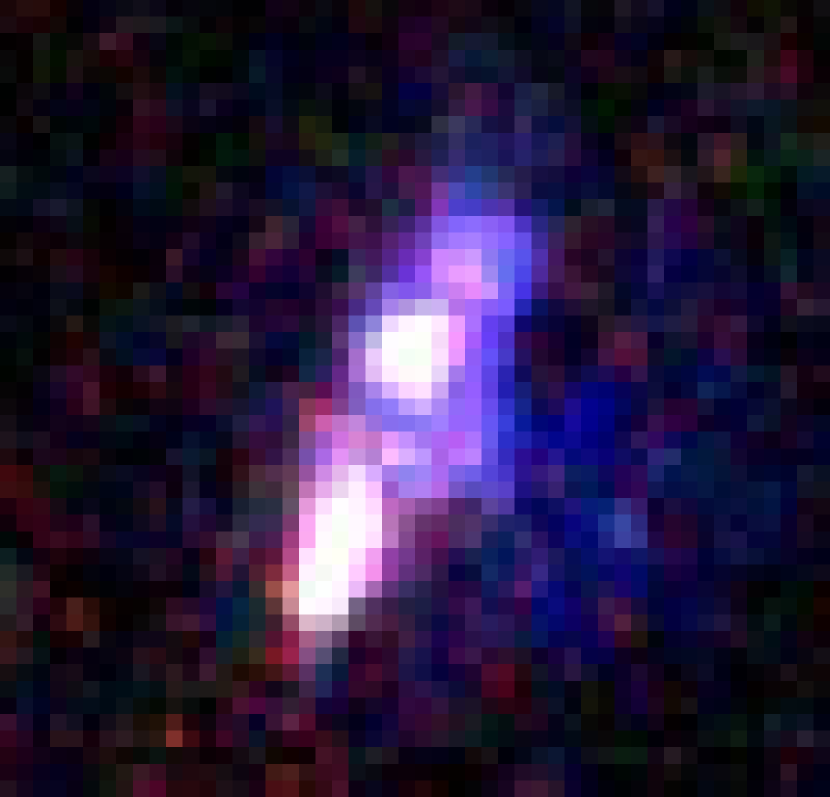
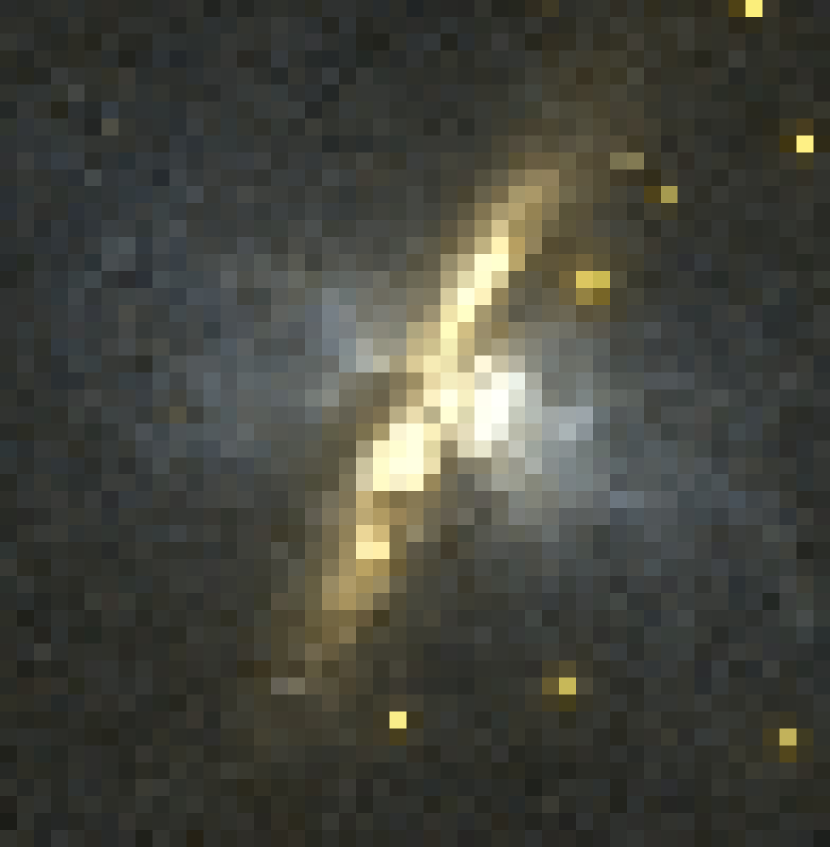
The ACS and VLT images are shown in Figure 3. The rest-frame ultraviolet morphology of TN J1338 is complex and multi-faceted. The radio galaxy exhibits the usual alignment between its continuum, line emission and radio axis (Chambers, Miley, & van Breugel, 1987; McCarthy et al., 1987; Best, Longair, & Röttgering, 1998). Two kiloparsec-sized clumps along the radio axis dominate the continuum structure in the and bands. This is similar to many powerful 3CR radio galaxies at (Best, Longair, & Röttgering, 1998; Zirm, 2003; Zirm, Dickinson, & Dey, 2003). In the band, the ACS image reveals both concentrated and diffuse Lyman- emitting regions. In this section we quantify the line and continuum flux distributions for the radio galaxy by performing photometry in a set of varied apertures.
3.1 Estimating the Contributions to the Aligned Light
The presence of a powerful radio source has several effects on the emitted spectrum. As mentioned above, at least three of these effects tend to align the observed continuum emission with the axis defined by the double radio lobes. Any remaining continuum flux we attribute to a young stellar population.
Ionized gas not only emits emission lines, but also continuum photons from two-photon recombination, bremsstrahlung and standard recombination. For a given gas temperature and density, this nebular continuum spectrum can be calculated (see Figure 1). Observationally, the normalization of the nebular spectrum is determined by using the emission line spectrum. For TN J1338–1942 we have a spectrum which was taken along the radio axis and spatially-averages the entire optical extent of the radio galaxy (RG). Ideally one would measure Balmer recombination emission lines. These lines directly correspond to the nebular continuum. At , these lines have shifted out of the optical window visible from the ground. As a ‘Balmer proxy’ we use the HeII emission line (Vernetetal2001), which has a flux of ergs s-1 cm-2 (2004, C. De Breuck, private communication). Assuming the HeII/H ratio () from a high-redshift radio galaxy composite spectrum (McCarthy, 1993), we estimate the H flux to be ergs s-1 cm-2. If these emission lines arise in a 15,000 K gas, at low enough densities where collisional de-excitation is negligible, then the corresponding nebular continuum flux densities in the , and bands are , and ergs s-1 cm-2 Hz-1 respectively. So, at its brightest the nebular continuum averaged over the entire galaxy is only (AB) =27.4, much fainter than even the individual components of TN J1338. We subtract the nebular continuum from all quoted magnitudes and fluxes by scaling the subtracted amounts for the sub-components by their estimated Ly flux.
The same population of electrons that is responsible for the radio synchrotron emission can also inverse-Compton (IC) scatter ambient photon fields. The primary seed photons are those making up the cosmic microwave background (CMB), with secondary contributions from the synchrotron photons themselves (synchrotron self-Compton; SSC) and other AGN emission. By assuming equipartition to calculate the magnetic field in the northern radio lobe of TN J1338, we find a -field on the order of a few hundred micro-Gauss. Using the extrapolation to the rest-UV as calculated by Daly (1992), this translates to an IC-CMB contribution of only a few ergs s-1 cm-2 Hz-1, or fainter than 28 magnitudes (AB). The estimated energy density in the synchrotron field is similar to that of the CMB at this high-redshift, so SSC adds a similar amount to the aligned continuum. These two contributions combined are negligible. As with the spectroscopy above, these values are spatially-averaged over the entire galaxy.
Optical spectropolarimetry of the entire galaxy reveals a polarization of (2004, C. De Breuck, private communication). This value is much lower (about a factor of two) than similar measurements of RGs (e.g., Dey et al., 1996; Cimatti et al., 1996, 1997; Solórzano-Iñarrea et al., 2004), but similar to other powerful radio galaxies at (Dey et al., 1997). The amount of scattered light is related to the percent polarization by the intrinsic polarization, . depends on the type of scatterer (either dust or electrons) and the geometry of the scattering, neither of which is well-constrained for TN J1338. Therefore we can only put the lower limit on the percentage of scattered light of 5%. However, we also note that for 3CR radio galaxies the observed polarizations are high and suggest that is also high. We therefore conclude that for TN J1338 the aligned continuum contains some scattered light (), but is substantially diluted by unpolarized sources. We have already shown that neither the nebular continuum nor the IC scattering can account for this dilution.
Clear evidence for the presence of young stellar populations in radio galaxies has proven difficult to find. The same spectral region, the ultraviolet, where massive stars are brightest coincides with the bright region of the AGN spectral energy distribution. Therefore, the detection depends on being able to find stellar-specific features in very deep spectra (e.g., the SV photospheric absorption feature in 4C 41.17 at Dey et al., 1997). Existing spectra of TN J1338 do not show such features. In this case the presence of young massive stars must be inferred from the UV excess after subtracting the other known contibutors to the aligned light. As we have shown above, there seems to be such an excess in TN J1338, which implies the existence of many young stars. We examine this result further below.
3.2 Large Aperture Photometry
To perform integrated photometry over the whole galaxy we used a “Kron” aperture (Kron, 1980) to approximate a total galaxy magnitude in the ACS and VLT images. This enables easy comparisons between the space and ground-based observations of TN J1338. This aperture is optimized to be as large as possible while still retaining a high signal-to-noise ratio. The magnitudes were determined using SExtractor (Bertin & Arnouts, 1996). The Apsis pipeline “deblends” the radio galaxy into two distinct objects. We therefore reset the SExtractor deblending parameters to maintain the radio galaxy as a single object. We overplot the aperture in Figure 3. The ‘total’ magnitudes within this aperture are listed in Table 1.
The radio galaxy is magnitudes brighter than the next brightest “dropout” or Lyman- emitting galaxy (within similarly defined apertures). This is true even in the band where the light from older stars is presumed to dominate the emission rather than processes related to the AGN. Therefore the radio galaxy is securely identified as the dominant, and likely most massive, galaxy within the protocluster and the probable progenitor of a present-day brightest cluster galaxy.
3.3 Rest-frame Optical Surface-brightness Profile
The -band samples the rest-frame optical continuum emission, mostly longward of the 4000 Å break, and shortward of the potentially bright [OIII] and H lines. At these wavelengths it is likely that the galaxy luminosity is dominated by older, low-mass stars. We show the final ISAAC image of the radio galaxy in panel (e) of Figure 3 and the raw surface-brightness profile of the radio galaxy and a star in this band in Figure 4. This profile is centered on the peak of the -band light. It is clear that the galaxy is resolved, but it is not possible to measure the size of the galaxy robustly from these data. A simple -law fit roughly estimates the effective radius at or kpc. This is considerably smaller than the corresponding radii of local BCGs (e.g., Graham et al., 1996). In fact, the observed morphology in the image is very similar to that seen in the ACS -band. The galaxy is highly elongated and is nearly perfectly aligned with the radio axis. There are no bright emission lines within the bandpass, and none of the continuum processes discussed above are bright in . Therefore, we conclude that the stellar distribution is aligned with the radio axis.
3.4 Multi-component Decomposition and Diffuse Light
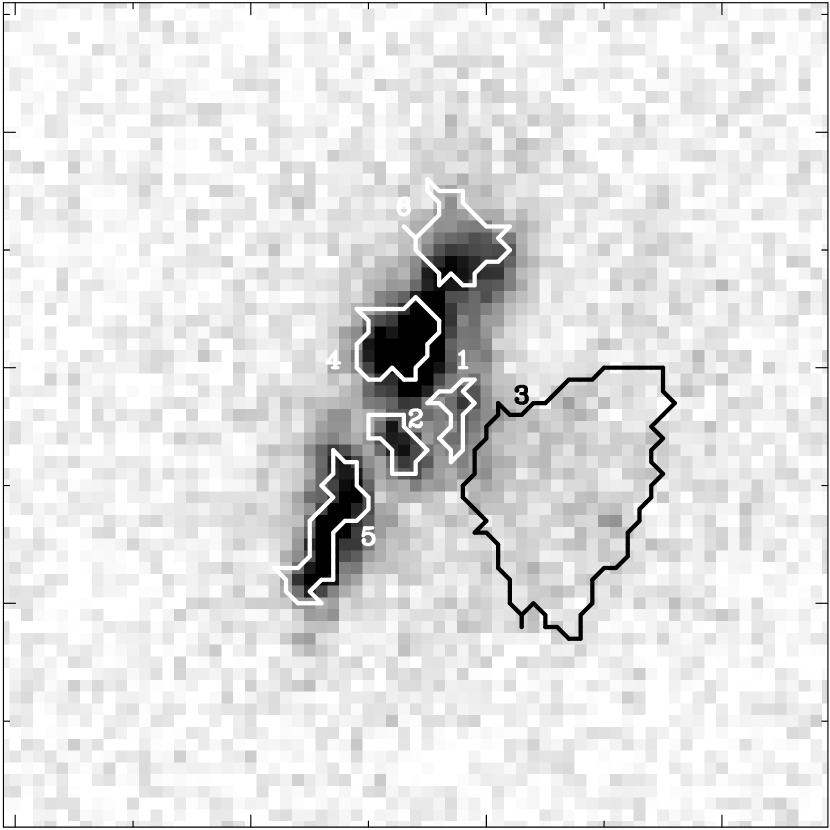
The rest-frame ultraviolet morphology of TN J1338 can be decomposed into several discrete components. To better understand the morphology of the galaxy we have extracted multi-band photometry of these individual components. We divided the radio galaxy into distinct regions both in the line-dominated -band and in the continuum-dominated -band. The resulting segmentation map is shown in Figure 5. The regions are numbered 1 thru 6. Regions 1, 2 and 3 (‘wedge’) are found only in the emission-line dominated -band. Conversely, regions 4 and and 5 are most prominent in the continuum bands ( and ). Finally, region 6 contains a linear feature in .
For each region we have measured the magnitude in each ACS band and in the ACS Ly (continuum subtracted ) image. Using these values we have derived the UV continuum slope and line flux independently for each portion of the galaxy. In addition, we have measured the magnitudes in the -band for the two primary continuum clumps visible in the ACS data (regions 4 and 5). The color for region 5 is magnitudes redder than region 4. The sum of the light contained within these clumps is about one magnitude fainter in the -band than the total radio galaxy, indicating that there is some “diffuse” light detected in these high angular-resolution images. This remains the case in the -band with the extended light apparently having the same color as the mean color of the entire galaxy. The magnitudes and Ly fluxes are presented in Columns 3-6 of Table 2.
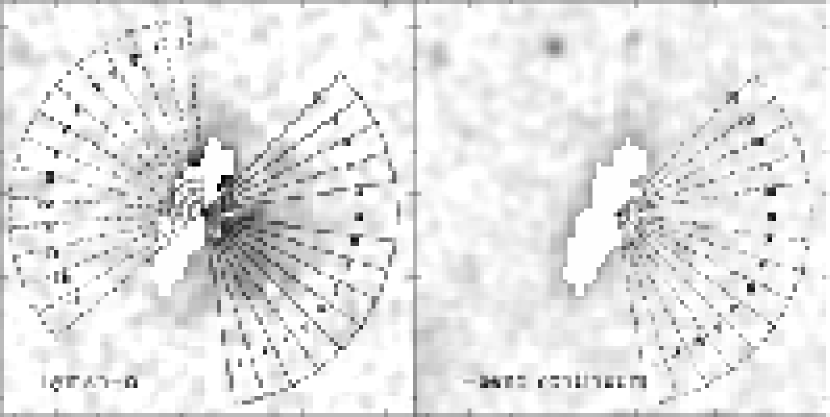
3.5 Azimuthal Binning
While the aligned light is a common feature of high-redshift radio galaxies, the wedge of extended line-emission to the southwest of the radio galaxy (region 3 in Figure 5) is unusual. We have measured the azimuthal surface-brightness distribution of this feature by extracting photometry in angular bins. The bins are shown in Figure 6. The angular regions are sized and placed to cover the entire visible extent of the wedge and to be small enough to accentuate the internal structure of the feature. The flux in each bin was summed using the IRAF task ‘polyphot’. The corresponding errors were calculated by performing the same aperture photometry on the error maps. The pixels within the radio galaxy (as defined by the extent of the -band continuum) were masked out. The resulting flux histogram is shown in Figure 7 for the wedge (solid line), the opposite side of the galaxy in the line image (‘anti-wedge’, dashed line) and for the -band continuum in the wedge region (dotted line).
The bins covering the wedge show a clear excess of flux with respect to both the opposite side of the galaxy and to the continuum. There also appears to be some structure to the azimuthal profile. The azimuthal profile has relatively sharp-cutoffs at either side. There is no evidence for limb-brightening toward the edges of the wedge. However, the spatial resolution ( kpc/bin) is insufficient to resolve a thin shell of limb-brightened emission.
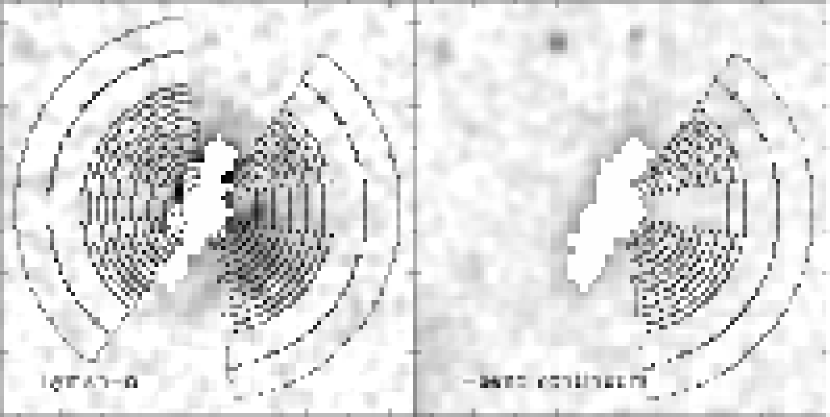
3.6 Semi-circular Annuli
To measure the radial profile of the wedge we have constructed semi-circular annuli which cover the same region(s) as the angular bins above (Figure 8). We have increased the width of the annuli towards the outer edge of the wedge to maintain constant signal-to-noise ratio per annulus. The annular photometry again shows that the line emission is significantly brighter in the wedge than on either the opposite side of the galaxy or in the continuum. The surface-brightness profiles for the wedge (solid line), ‘anti-wedge’ (dashed line) and continuum (dotted line) are shown in Figure 9. The errors for each data point were derived by performing identical photometry on the corresponding error map. There does not seem to be evidence for limb-brightening toward the outer edge of the wedge. Also shown are power-law profiles of the form SB with values of 1 and 2 (dot-dash lines). The wedge profile has a profile much closer to the curve. We shall consider these profiles further in the discussion.
4 Discussion
The unparalleled spatial resolution provided by HST and the Advanced Camera for Surveys has allowed us to observe kpc-scale structures within the radio galaxy TN J1338–1942 at . The rest-frame ultraviolet continuum and line emission of the host galaxy is morphologically complex and consists of several distinct components. In this section we discuss these features, their implications for the formation of this galaxy and attempt to construct a possible scenario for the on-going processes in this source.
4.1 On-going Star-Formation
Are we witnessing the formation of the bulk of the final stellar mass in this radio galaxy? Previous studies based on ground-based optical and millimeter imaging suggest that the current star-formation rate (SFR) within TN J1338 is very high, of order several hundred solar masses per year (Venemans et al., 2002; De Breuck et al., 2004). The current study not only confirms this estimate, under different assumptions, but also determines the spatial gradients in star-formation activity. This new spatial information allows us to constrain both the timescale and possible physical origin of the current star-formation episode.
There are two methods to estimate the SFR in TN J1338 using the ACS imaging data; one using the Ly luminosity and the other using the UV continuum luminosity. Both estimates are based on the assumption that the UV light we see from the galaxy is due solely to star-formation. As we have shown earlier, the UV continuum is relatively unpolluted by the non-stellar contributors to the aligned light. Conversely, for the line emission, the high observed equivalent-widths argue in favor of non-stellar excitation (e.g., Charlot & Fall, 1993). Therefore, the line emission provides an upper limit (modulo dust extinction) to the SFR, while the UV continuum provides a lower limit. The comparison of these two derived values provides an estimate of the mean SFR for each portion of the galaxy.
For a given Ly flux we calculate the corresponding Balmer line flux and hence the SFR (Kennicutt, 1998). This SFR is a lower limit locally due to Ly being a resonantly scattered line and very susceptible to dust. For example, the Ly flux of the wedge (region 3 in Figure 5) is ergs s-1 cm-2 corresponding to an intrinsic luminosity of ergs s-1 at . If we adopt a Case B Ly/H ratio of (Brocklehurst, 1971), and use the relation between H line flux and SFR, we find that region 3 is forming stars at a rate of . The analogous results for the other regions are listed in Table 2. The total “Kron” Ly SFR is . The sum of the individual SFRs does not equal this total; underpredicting it by . There is a considerable amount of low surface-brightness line emission even within the “Kron” apeture ( kpc). We have not corrected for the observed HI absorption (De Breuck et al., 1999; Wilman et al., 2004).
The and band probe the rest-frame UV of TN J1338–1942 at Å and Å, respectively. We can use the ACS continuum magnitudes to estimate the current star formation rate, under the assumptions that the UV luminosity is dominated by the light from late-O/early-B stars on the main sequence. We measure total (“Kron”) star formation rates of 86 and 96 yr-1 for the and bands, assuming a Salpeter IMF. The derived SFRs are lower limits, since they are dependent on the amount and distribution of dust present in the UV emitting regions. The slope of the UV continuum can also be used to measure the extinction. We measure the slope of the continuum from the color and use a template spectrum of a typical star-forming galaxy redshifted to to convert the measured slope to a color excess, . For the template spectrum we have used the stellar population synthesis models of Bruzual & Charlot (2003) to create a typical “Lyman-break” galaxy spectrum, having an exponentially-declining star formation history (with time constant, Myr), an age of 70 Myr, 0.2 metallicity, and a Salpeter initial mass function. The parameters of this template are taken from the best-fit SED at of Papovich et al. (2001). We varied the dust content by applying the attenuation curve of Calzetti et al. (2000) to this template. We find , yielding a dust-corrected SFR of yr-1 in good agreement with the emission line estimate above. If we repeat this calculation for each discrete region of the galaxy (allowing for and SFR to change for each; see Table 2), we again find evidence for diffuse UV light and star-formation. The sum of the SFRs for all the regions again falls short of the total by a factor of 4.5, “missing” yr-1.
4.1.1 Shocks and Jet-Induced Star-Formation
One of the primary explanations for the alignment effect is that the passage of the radio jet through the interstellar gas induces star-formation (e.g., Rees, 1989). Strong large-scale shocks associated with the expanding radio source overpressure molecular gas clouds which then collapse to form stars. The presence of powerful shocks in radio galaxies at has been inferred via their ultraviolet emission line ratios (e.g., Best, Röttgering, & Longair, 2000; De Breuck et al., 2000a). For TN J1338 most of the important diagnostic emission lines are unobservable from the ground. However, we can use morphological information to search for possible signatures of shock processes in this radio galaxy.
In these respects, useful analogies can be drawn between TN J1338 at and 4C 41.17 at . The shock properties of 4C 41.17 were studied and modeled in detail by Bicknell et al. (2000). In addition to HST imaging of 4C 41.17, these authors also used deep emission line spectra and high angular-resolution radio imaging to study the relationship between the radio source, the gas and the stars. We apply a similar analysis to TN J1338.
A bow-shock is formed at the tip of the advancing radio jet (cf. Figure 3 in Bicknell et al. (2000)). Due to the unresolved radio structure we cannot robustly determine the location of the jet interaction. We assume that region 4 in the continuum ACS image is the primary site where the jet has shocked or is still impacting the gas. This continuum knot is very blue and has a morphological structure which is suggestive of jet-cloud interaction; namely, a paraboloid oriented along the radio axis. From the spatially-resolved optical images we estimate the interaction area to be cm2 by assuming the emission we see is emitted by a spherical shell. The jet is most likely well-collimated and therefore the area of the jet itself is much smaller than the total; we assume 10%. If we assume that most of the momentum flux of the jet is dissipated in this interaction, the shock velocity (see Eqn. 1 of Bicknell et al.) will be greater than:
| (1) |
is the energy flux of the jet in units of ergs s-1, is the relativistic Doppler parameter, and is the hydrogen density per cm3 in the cloud. Comparison between model and observed CIV doublet fluxes can help to constrain the pre-shock gas density and the energy flux of the jet. Assuming that the ACS UV/Ly image also the spatial distribution of CIV, we can constrain the area from which the line is being emitted. We use the observed CIV/Ly flux ratio to convert the Ly image to a “CIV” image. If we follow Bicknell et al. (2000) and take to be the projection of the true area of the shock in region 4 and predict the CIV line luminosity for our estimated shock velocity we find:
| (2) |
is the radiative efficiency of the CIV doublet. By comparing this to the observed line luminosity ( ergs s-1) we estimate that the pre-shock electron number density to be on the order of cm-3.
We have estimated the star-formation rate produced by the jet-cloud interaction in region 4. To determine whether these shocks can lead to star-formation rates in excess of a couple dozen solar masses per year (for region 4) we parameterize the jet-induced star-formation as follows.
| (3) |
We have taken the ambient pre-shock gas number density, , to be 3 cm-3 as inferred above using the line luminosity. The area of the shock front is taken from the image itself and the shock velocity was assumed to be between the extremes possible in equation 1 above. The efficiency with which the shocked gas is converted into stars is denoted by and the gas volume filling factor by . The assumption of order unity filling factor is most likely incorrect globally in the galaxy, but more likely to be realistic in this limited region where the gas is approximately uniform. We conclude that jet-cloud interactions could be responsible for the observed star-formation in TN J1338.
The existing radio imaging data of TN J1338 does not have sufficient angular-resolution to make direct correspondence with specific features in the ACS images. However, since the radio structure clearly overlaps the optical galaxy the comparison with 4C 41.17 and our assumption of a physical connection between the radio and optical structures are likely to be justified.
4.2 The ‘Wedge’
The coupling and regulation of star-formation and nuclear activity in forming galaxies and their interaction with their environments (i.e., “feedback”) is a key issue in modern astrophysics. At low redshift, imaging and spatially-resolved spectrocopic observations of starbursting galaxies show that supernovae-driven outflows, so-called “superwinds”, are common among this population (e.g., Heckman, Armus, & Miley, 1990). Whether such outflows actually achieve escape velocity and enrich the inter-galactic medium (IGM) is still an outstanding question (Heckman, 2000; Heckman et al., 2000; Martin, 2004). However, these winds, along with nuclear outflows, are the only processes observed to transport material into the outer halos of galaxies and are therefore prime candidates for injecting the metals and energy that are observed in the IGM. At high-redshift, where these processes are likely to be even more prevalent due to the higher global star-formation rates, the strongest evidence for the presence of outflows is spectroscopic. However, the spectroscopic features observed are of ambiguous origin and could be due to inflow, outflow or rotation (e.g., van Ojik et al. (1997) but see also Adelberger et al. (2003)). Spatially-resolved imaging of the emission-line gas can provide a more certain indication of outflow, if the gas is collimated or exhibits the bi-polar morphology of low-redshift superwinds. In the next sections we consider several possible origins for the wedge: the photoionization cone of an AGN or young stellar population, in-situ star-formation, scattering by dust, or an ionized outflow associated with a starburst (i.e., a superwind).
4.2.1 Photoionization
In several low-redshift Seyfert galaxies cone-shaped regions of high ionization are observed, consistent with photoexcitation by an active nucleus (e.g., Wilson & Tsvetanov, 1994). In some cases these cones extend to distances of 15-20 kpc from the nucleus, similar to the size of the Ly wedge seen in our ACS image (Wilson & Tsvetanov, 1994). Both the ionized cone and our wedge have high equivalent-width. We derive a lower-limit to the Ly rest-frame equivalent-width of 650Å for the wedge emission. Furthermore, powerful radio galaxies are known to photoionize their surroundings based on emission line diagnostics and imaging of low-redshift sources. Generally both the line and UV continuum emission are elongated and aligned with the radio axis, particularly at (McCarthy et al., 1987; Chambers, Miley, & van Breugel, 1987).
Conversely however, the principal wedge axis is perpendicular to that of the radio source. The unified model for AGN posits that the observed radiation is anisotropic (Antonucci, 1993) due to a combination of obscuration close to the nucleus and the intrinsically anisotropic radiation. For radio-loud galaxies this preferential radiation axis is traced by the line connecting the dual radio lobes. The misalignment of the wedge therefore argues against photoionization due to the AGN or shocks due to the radio jet. Furthermore, the most likely position of the accreting black hole powering the radio emission and therefore also the primary source of hard ionizing radiation is where the radio core and -band surface-brightness peak coincide. The apex of the wedge does not coincide with this position. It is possible that a second AGN (this one radio-quiet), coinciding with region 4 in Figure 5, could ionize the wedge. However, this additional black hole would have to have its primary axis roughly perpendicular to the radio-loud AGN and be much less luminous at -band. While not impossible, this explanation is ad hoc and not preferred.
4.2.2 In Situ Star Formation or Galaxy Interaction
On-going star-formation within the wedge itself, and perhaps extending into the outer Ly halo (outside the “Kron” radius), would also produce bright line emission. However, there is a robust upper-limit to the Lyman- equivalent width produced by normal massive stars of Å (Charlot & Fall, 1993). For the wedge we estimate a significantly higher equivalent width. We also note that dust extinction will decrease the observed equivalent width from its true value; the resonant scattering of Ly photons increases their optical depth relative to continuum photons. This equivalent width argument also applies to tidal debris ejected from the galaxy via a merger or interaction. It therefore seems unlikely that stars are directly responsible for the wedge emission.
4.2.3 “Superwind”: Comparison with M82
In Heckman, Armus, & Miley (1990) the authors use their observations of local starburst galaxies to determine the minimal condition for driving a galactic-scale outflow powered by supernovae explosions, or a ‘superwind’. They phrase this criterium in terms of the star-formation rate per unit area (), and emprically determine the minimum to be . If we adopt this minimal value for TN J1338 and apply it to the resolved area where we see the wedge emerging from the galaxy (assuming a circular region seen in projection), we derive a lower-limit to the SFR over this same area of yr-1. Above we have shown that the SFR for this galaxy greatly exceeds this limit even only in region 4 where the wedge may originate.
Galactic-scale winds have been observed in detail around local starburst galaxies, a well-studied example being M82 (e.g., Heckman et al., 1990). Morphologically, these superwinds are bipolar structures emanating from the galaxy nucleus and along the minor axis of the galaxy. They are detected as emission-line filaments, extended X-ray lobes and bipolar thermal dust emission (Heckman et al., 1990). In M82, the emission-line gas is photoionized in the innermost regions and primarily shock-excited in the outskirts. The optically emitting gas flows from M82 in filaments which trace the biconical surface. The outflows have double-peaked emission lines (due to the two surfaces of the cone being separated in velocity) and also, depending on geometry and spectral resolution, emission lines with blue-shifted absorption. On the basis of these spectroscopic signatures, galactic-winds seem to be a generic feature of high-redshift star-forming galaxies (Pettini et al., 2001). All the existing spectroscopy of TN J1338 has been taken along the radio axis where the dynamics of the gas are presumably dominated by the AGN outflow and jet-cloud interactions (see above and e.g., Villar-Martín et al., 1999; Solórzano-Iñarrea, Tadhunter, & Axon, 2001). So we must rely on morphology alone to infer the presence of a superwind emanating from this radio galaxy along the wedge.
Comparison of the recent ultraviolet GALEX image of M82 (Hoopes et al., 2005) with our TN J1338 image reveals a striking degree of similarity (Figure 10). The scales of the two outflows are somewhat different; in M82 the narrowest collimated section is only 1.5 kpc across, while in TN J1338 the similarly defined region is approximately twice that. The surface-brightness profile is also similar between the wedge and the M82 far-UV outflow (see Figure 9). The shallow drop-off of emission-line surface-brightness is consistent with having shock ionization dominate at these large radii rather than photoionization by a central source.
Why do we see only one side of the presumably bipolar outflow? This could be due to obscuration of the line emission on one side of the galaxy. If the radio galaxy is flattened (perpendicular to the plane of the sky) and inclined with respect to the line-of-sight then any dust in the galaxy would naturally obscure the side tilted away from the observer. This is the primary explanation for the observed asymmetry in the bipolar superwind in M82 (Shopbell & Bland-Hawthorn, 1998). Alternatively, the lack of line emission on the northeast side may be due to a strong gradient in the ambient gas density.
Alternatively, if the pressure is higher on the northeast side of the galaxy, a situation which could arise due to the motion of the radio galaxy within the protocluster medium, i.e., ram pressure, then the outflow would be impeded on this side of the galaxy. Marcolini, Brighenti, & D’Ercole (2004) have made simulations (albeit for dwarf galaxies) that show that motion through the IGM does not greatly affect the dynamics of galactic outflows until the ram pressure becomes comparable to the static thermal pressure of the galactic ISM. This result should be extendable to the case of TN J1338. To estimate the thermal pressure in the galaxy we must first estimate a density for the gas. If we assume that the observed Ly emission is due to Case B recombination at K, then we can use the fiducial Ly/H ratio of to deduce the number of ionized hydrogen atoms. Given the observed geometry of the wedge we can assume further that the emitting gas is contained in the surface of a cone with half-angle 30 and length 10 kpc. The thickness of the gas layer cannot be larger than a few hundred parsec due to the absence of significant limb-brightening in the azimuthal profile of the wedge. Consequently, the number density and mass of ionized hydrogen are:
| (4) |
| (5) |
Where is the mean particle mass, which we have taken to be the proton mass, is the luminosity in units of ergs s-1. The true electron density is likely to be higher than this, but only within smaller clouds or filaments as is seen in the M82 outflow. The resulting thermal pressure is equivalent to the ram pressure produced by a relative velocity of 300 km s-1 (if the surrounding gas has a density 1/1000th of that in the wedge). This is some evidence that the radio galaxy is not in the center of the galaxy overdensity, and that motion towards the center would provide the requisite ram pressure (Intema et al. 2005, in prep.). We conclude that the wedge is likely to be a supernovae-driven ouflow, with the current episode of star-formation possibly triggered by the radio jet. This superwind is one-sided due to ram pressure inhibiting the flow on one side.
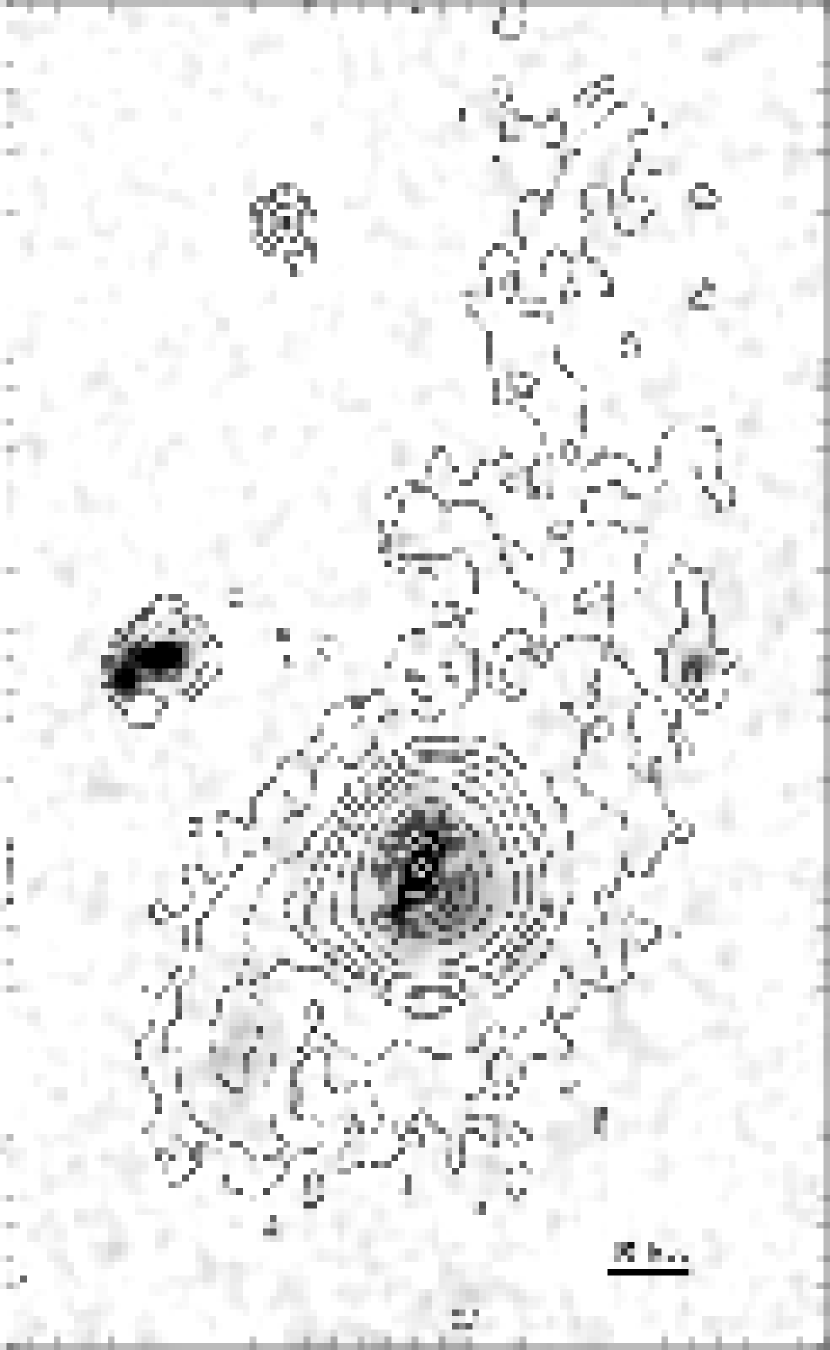
4.3 The Outer Ly Halo
In Figure 11, the extended Ly (out to kpc), as detected in the very deep VLT narrow-band image, is shown as contours. The TN J1338 halo is somewhat has an asymmetric ‘plume’ which is aligned with the radio axis. It is clear from the underlying ACS image showing the wedge that there is a natural connection between the high surface-brightness wedge (out to 20 -30 kpc) and the larger scale lower surface-brightness halo along the southwest direction. However, the halo at larger distances appears to be aligned with the radio axis of TN J1338. What is the relation, if any, between the wedge and the large-scale Ly structure?
If the wedge is an outflow, as we conclude above, the resulting bubble will stall at some radius where gravity and the amount of swept up intergalactic matter balance the input energy. The gas deposited at this radius will naturally flow along the boundary of the excavated cavity and follow any density gradients in the ambient medium. The halo-radio alignment would then be a natural consequence if lower density regions were preferentially along the radio axis. This would be the case if either the current radio source extended further out in radius than our current radio observations indicate, or that the radio source was previously (either during this same accretion episode or during an earlier one) much larger and had excavated the region along the radio axis. However, there is no evidence in the current radio data for a relic radio source at larger distances. In any case, if the ionized gas has originated in the starburst, the observed alignment implies that the AGN had already ‘imprinted’ the region before the starburst was triggered. We discuss this possibility and its implications further in the next section.
4.4 A Self-Consistent Scenario
The host galaxy of the powerful radio source TN J1338–1942 at is unique. It is arguably the youngest brightest cluster galaxy known to date, and has been the subject of several multi-wavelength investigations. In this paper we have presented imaging from HST/ACS which reveals several interesting morphological and broad-band spectral features in this radio galaxy. In this section we attempt to construct a plausible and self-consistent story of the past, present and future of TN J1338.
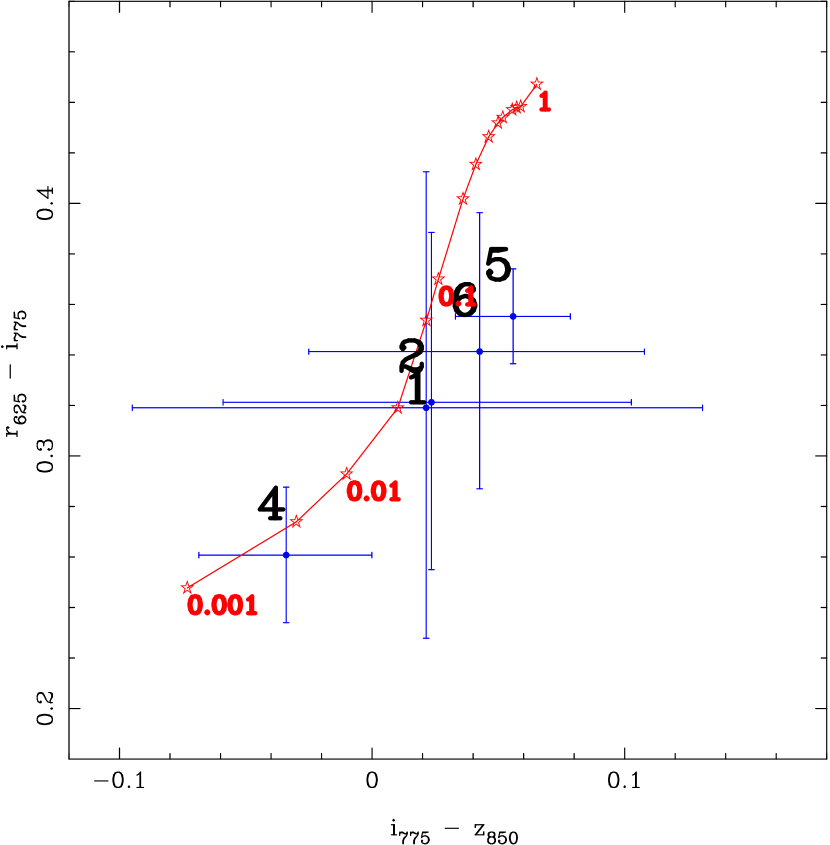
The host galaxy of TN J1338 appears to be forming stars at a high rate. None of the non-stellar processes known to produce the alignment effect in other galaxies can be dominant in this case. The ACS data presented here reveals a morphology that is consistent with most of the star-formation being triggered by the passage of the radio jet. In Figure 12 we show a color-color diagram for the discrete regions within the radio galaxy. The color difference between regions 4 and 5 may be an age effect (region 4 is also bluer in ). We use the overplotted model colors in Fig. 12 to derive an age difference between the two regions. The model has constant star-formation with 0.4 solar metallicity and , the ages are labeled at timesteps of 1, 10, 100 and 1000 Myr. We estimate from the comparison between the model points and the data that the age difference is between 25 and 200 Myr. This matches within the (large) errors the shock travel time from the radio core (in region 5) to the jet-cloud interaction in region 4 (a distance of kpc with a 300 km/s shock). We do not see very extended star-formation which may be triggered by the expanding radio cocoon. The energy injection from the AGN may be rather isolated to these few nodes along the radio jet itself. Therefore, we suspect that the large-scale Lyman- gas has an origin apart from the AGN, namely in the newly-formed stars.
Once the prodigious star-formation is initiated, the supernovae explosions expel the ionized gas into the surrounding media by means of a superwind. In addition, ram pressure is stripping the gas from the star-forming regions as the radio galaxy moves through the ICM/IGM. This gas remains ionized primarily via shock excitation at the interface between the outflow and the ambient intergalactic gas. At a distance of approximately 20-30 kpc from the nucleus, the outflow reaches pressure equilibrium with the IGM. The gas rapidly cools at this interface, consistent with the boundary to the Ly halo observed at this region. This cooling gas will follow the density gradients in the IGM. The very low surface-brightness line emission seen to the northeast of the radio galaxy, which is aligned with the radio axis, is probably gas which originated in the outflow, cooled, and is now being re-excited by low-luminosity shocks associated with the radio source.
The observed rest-frame magnitude of TN J1338 is approximately 1.5-2 magnitudes brighter than that of the six brightest cluster galaxies at observed with ACS (PostmanMDR). If we use the same star-formation model as above (constant for 1 Gyr and 0.4 solar metallicity) and age the galaxy from 1 Gyr at to 5.2 Gyr at the galaxy fades by 3.3 magnitudes. This would imply that some additional star formation or merging must occur during those 4.2 Gyrs for TN J1338 to match the luminosity of the BCGs. This is certainly not surprising. It is interesting to note as well, that several of these BCGs have a nearby bright companion, of almost equal luminosity ( mag), with which it seems to be destined to merge. The resulting increase in luminosity would nearly make up the 1 magnitude of “extra” fading seen for the 1 Gyr constant star formation model.
It is debatable whether one should attempt to draw conclusions for an entire population of sources (either BCGs or radio galaxies in this case) based on observations of a single example. TN J1338 may be a galaxy which in a special phase of its evolution, or alternatively, it may be a special source whose history cannot be generalized to describe other galaxies. However, studies of ensembles of radio galaxies, including their luminosity functions and duty-cycles, suggest that the space density of radio source hosts at high- are roughly in agreement with the density of BCGs at low redshift and the density of non-RG overdensities at (West94; Venemans et al., 2002)
5 Conclusions and Future
The host galaxy of powerful radio source TN J1338–1942 shows signatures of several feedback processes which connect the black-hole, stellar host and intergalactic medium. The elongated and multi-component ultraviolet continuum is aligned with the FRII radio axis and is likely to be due to emission from young stars being formed along the jet axis. Interpretation of this light in terms of jet-induced star-formation is consistent with the observations. There is, however, also evidence for considerable star-formation outside the highest surface-brightness regions. If the current star-formation rate has been constant over the jet travel-time from the radio core to the site of the presumed jet-cloud interaction, this process could have produced in excess of of stars. Data from the Spitzer Space Telescope will allow us to determine the total stellar mass of TN J1338 and help verify our hypothetical star-formation history.
We interpret the ACS wedge of Ly emission as a superwind driven by the winds and supernovae explosions associated with prodigious star-formation activity. This outflow connects with the larger-scale Ly halo. The initial source of the halo gas is then within the starburst, and is possibly enriched. Deep spectroscopy from the ground along the wedge axis would help us determine the ionization mechanism more definitively. In particular, covering the Ly, CIV, HeII and CIII] emission-lines may enable us to also measure the enrichment of the outflowing gas. An on-going ACS program using the narrow-band (ramp) filter (PI: W. van Breugel) to image several high-redshift radio galaxies in Ly will discover how prevalent such wedge features are in this population.
References
- Adelberger et al. (2003) Adelberger, K. L., Steidel, C. C., Shapley, A. E., & Pettini, M. 2003, ApJ, 584, 45
- Antonucci (1993) Antonucci, R. 1993, ARA&A, 31, 473
- Aragon-Salamanca et al. (1998) Aragon-Salamanca, A., Baugh, C. M., & Kauffmann, G. 1998, MNRAS, 297, 427
- Baugh et al. (2003) Baugh, C. M., Benson, A. J., Cole, S., Frenk, C. S., & Lacey, C. 2003, in The Mass of Galaxies at Low and High Redshift, ed. R. Bender & A. Renzini, ESO Springer, 91
- Bernardi et al. (2003) Bernardi, M., et al. 2003, AJ, 125, 1866
- Bertin & Arnouts (1996) Bertin, E. & Arnouts, S. 1996, A&AS, 117, 393
- Best et al. (1998) Best, P. N., Longair, M. S., & Röttgering, H. J. A. 1998, MNRAS, 295, 549
- Best et al. (2000) Best, P. N., Röttgering, H. J. A., & Longair, M. S. 2000, MNRAS, 311, 23
- Bicknell et al. (2000) Bicknell, G. V., Sutherland, R. S., van Breugel, W. J. M., Dopita, M. A., Dey, A., & Miley, G. K. 2000, ApJ, 540, 678
- Blakeslee et al. (2003a) Blakeslee, J. P., Anderson, K. R., Meurer, G. R., Benítez, N., & Magee, D. 2003a, in ASP Conf. Ser. 295: Astronomical Data Analysis Software and Systems XII 257
- Blakeslee et al. (2003b) Blakeslee, J. P., et al. 2003b, ApJ, 596, 143
- Brocklehurst (1971) Brocklehurst, M. 1971, MNRAS, 153, 471
- Bruzual & Charlot (2003) Bruzual, G. & Charlot, S. 2003, MNRAS, 344, 1000
- Burke et al. (2000) Burke, D. J., Collins, C. A., & Mann, R. G. 2000, ApJ, 532, 105
- Calzetti et al. (2000) Calzetti, D., Armus, L., Bohlin, R. C., Kinney, A. L., Koornneef, J., & Storchi-Bergmann, T. 2000, ApJ, 533, 682
- Chambers et al. (1987) Chambers, K. C., Miley, G. K., & van Breugel, W. 1987, Nature, 329, 604
- Charlot & Fall (1993) Charlot, S. & Fall, S. M. 1993, ApJ, 415, 580
- Cimatti et al. (1996) Cimatti, A., Dey, A., van Breugel, W., Antonucci, R., & Spinrad, H. 1996, ApJ, 465, 145
- Cimatti et al. (1997) Cimatti, A., Dey, A., van Breugel, W., Hurt, T., & Antonucci, R. 1997, ApJ, 476, 677
- Cole et al. (2000) Cole, S., Lacey, C. G., Baugh, C. M., & Frenk, C. S. 2000, MNRAS, 319, 168
- Condon et al. (1998) Condon, J. J., Cotton, W. D., Greisen, E. W., Yin, Q. F., Perley, R. A., Taylor, G. B., & Broderick, J. J. 1998, AJ, 115, 1693
- Daly (1992) Daly, R. A. 1992, ApJ, 386, L9
- De Breuck et al. (2004) De Breuck, C., et al. 2004, A&A, 424, 1
- De Breuck et al. (2000a) De Breuck, C., Röttgering, H., Miley, G., van Breugel, W., & Best, P. 2000a, A&A, 362, 519
- De Breuck et al. (1999) De Breuck, C., van Breugel, W., Minniti, D., Miley, G., Röttgering, H., Stanford, S. A., & Carilli, C. 1999, A&A, 352, L51
- De Breuck et al. (2000b) De Breuck, C., van Breugel, W., Röttgering, H. J. A., & Miley, G. 2000b, A&AS, 143, 303
- De Breuck et al. (2002) De Breuck, C., van Breugel, W., Stanford, S. A., Röttgering, H., Miley, G., & Stern, D. 2002, AJ, 123, 637
- Dey et al. (1996) Dey, A., Cimatti, A., van Breugel, W., Antonucci, R., & Spinrad, H. 1996, ApJ, 465, 157
- Dey et al. (1997) Dey, A., van Breugel, W., Vacca, W. D., & Antonucci, R. 1997, ApJ, 490, 698
- Dickson et al. (1995) Dickson, R., Tadhunter, C., Shaw, M., Clark, N., & Morganti, R. 1995, MNRAS, 273, L29
- Donahue et al. (2001) Donahue, M., et al. 2001, ApJ, 552, L93
- Donahue et al. (2002) Donahue, M., et al. 2002, ApJ, 569, 689
- Douglas et al. (1996) Douglas, J. N., Bash, F. N., Bozyan, F. A., Torrence, G. W., & Wolfe, C. 1996, AJ, 111, 1945
- Ferrarese & Merritt (2000) Ferrarese, L. & Merritt, D. 2000, ApJ, 539, L9
- Fragile et al. (2004) Fragile, P. C., Murray, S. D., Anninos, P., & van Breugel, W. 2004, ApJ, 604, 74
- Francis et al. (2001) Francis, P. J., et al. 2001, ApJ, 554, 1001
- Gebhardt et al. (2000) Gebhardt, K., et al. 2000, ApJ, 539, 13
- Graham et al. (1996) Graham, A., Lauer, T. R., Colless, M., & Postman, M. 1996, ApJ, 465, 534
- Heckman (2000) Heckman, T. M. 2000, in Gas and Galaxy Evolution, ed. J. Hibbard, M. Rupen, & J. van Gorkom, Volume 240 PASP, 345
- Heckman et al. (1990) Heckman, T. M., Armus, L., & Miley, G. K. 1990, ApJS, 74, 833
- Heckman et al. (2000) Heckman, T. M., Lehnert, M. D., Strickland, D. K., & Armus, L. 2000, ApJS, 129, 493
- Holden et al. (2000) Holden, B. P., et al. 2000, AJ, 120, 23
- Holden et al. (1999) Holden, B. P., Nichol, R. C., Romer, A. K., Metevier, A., Postman, M., Ulmer, M. P., & Lubin, L. M. 1999, AJ, 118, 2002
- Hoopes et al. (2005) Hoopes, C. G., et al. 2005, ApJ, 619, 99
- Jarvis & McLure (2002) Jarvis, M. J. & McLure, R. J. 2002, MNRAS, 336, L38
- Jarvis et al. (2001a) Jarvis, M. J., Rawlings, S., Eales, S., Blundell, K. M., Bunker, A. J., Croft, S., McLure, R. J., & Willott, C. J. 2001a, MNRAS, 326, 1585
- Jarvis et al. (2001b) Jarvis, M. J., et al. 2001b, MNRAS, 326, 1563
- Jørgensen et al. (1996) Jørgensen, I., Franx, M., & Kjærgaard, P. 1996, MNRAS, 280, 167
- Kaiser (1984) Kaiser, N. 1984, ApJ, 284, 9
- Kennicutt (1998) Kennicutt, R. C. 1998, ARA&A, 36, 189
- Kron (1980) Kron, R. G. 1980, ApJS, 43, 305
- Kurk et al. (2003) Kurk, J., Röttgering, H., Pentericci, L., Miley, G., & Overzier, R. 2003, New Astronomy Review, 47, 339
- Kurk et al. (2000) Kurk, J. D., et al. 2000, A&A, 358, L1
- Madau (1995) Madau, P. 1995, ApJ, 441, 18
- Magorrian et al. (1998) Magorrian, J., et al. 1998, AJ, 115, 2285
- Marcolini et al. (2004) Marcolini, A., Brighenti, F., & D’Ercole, A. 2004, MNRAS, 352, 363
- Martin (2004) Martin, C. L. 2004, ApJ in press, astro-ph/0410247
- McCarthy (1993) McCarthy, P. J. 1993, ARA&A, 31, 639
- McCarthy et al. (1991) McCarthy, P. J., van Breugel, W., & Kapahi, V. K. 1991, ApJ, 371, 478
- McCarthy et al. (1987) McCarthy, P. J., van Breugel, W., Spinrad, H., & Djorgovski, S. 1987, ApJ, 321, L29
- Mellema et al. (2002) Mellema, G., Kurk, J. D., & Röttgering, H. J. A. 2002, A&A, 395, 13
- Miley et al. (2004) Miley, G. K., et al. 2004, Nature, 427, 47
- Mullis et al. (2003) Mullis, C. R., et al. 2003, ApJ, 594, 154
- Oegerle & Hoessel (1991) Oegerle, W. R. & Hoessel, J. G. 1991, ApJ, 375, 15
- Oke & Gunn (1983) Oke, J. B. & Gunn, J. E. 1983, ApJ, 266, 713
- Oke et al. (1998) Oke, J. B., Postman, M., & Lubin, L. M. 1998, AJ, 116, 549
- Papovich et al. (2001) Papovich, C., Dickinson, M., & Ferguson, H. C. 2001, ApJ, 559, 620
- Pentericci et al. (2000a) Pentericci, L., et al. 2000a, A&A, 361, L25
- Pentericci et al. (2000b) Pentericci, L., Van Reeven, W., Carilli, C. L., Röttgering, H. J. A., & Miley, G. K. 2000b, A&AS, 145, 121
- Pettini et al. (2001) Pettini, M., Shapley, A. E., Steidel, C. C., Cuby, J., Dickinson, M., Moorwood, A. F. M., Adelberger, K. L., & Giavalisco, M. 2001, ApJ, 554, 981
- Postman et al. (2002) Postman, M., Lauer, T. R., Oegerle, W., & Donahue, M. 2002, ApJ, 579, 93
- Postman et al. (1996) Postman, M., Lubin, L. M., Gunn, J. E., Oke, J. B., Hoessel, J. G., Schneider, D. P., & Christensen, J. A. 1996, AJ, 111, 615
- Rees (1989) Rees, M. J. 1989, MNRAS, 239, 1
- Reuland et al. (2003) Reuland, M., et al. 2003, ApJ, 592, 755
- Rosati et al. (1998) Rosati, P., della Ceca, R., Norman, C., & Giacconi, R. 1998, ApJ, 492, L21
- Rosati et al. (1999) Rosati, P., Stanford, S. A., Eisenhardt, P. R., Elston, R., Spinrad, H., Stern, D., & Dey, A. 1999, AJ, 118, 76
- Scharf et al. (1997) Scharf, C. A., Jones, L. R., Ebeling, H., Perlman, E., Malkan, M., & Wegner, G. 1997, ApJ, 477, 79
- Shimasaku et al. (2003) Shimasaku, K., et al. 2003, ApJ, 586, L111
- Shopbell & Bland-Hawthorn (1998) Shopbell, P. L. & Bland-Hawthorn, J. 1998, ApJ, 493, 129
- Solórzano-Iñarrea et al. (2004) Solórzano-Iñarrea, C., Best, P. N., Röttgering, H. J. A., & Cimatti, A. 2004, MNRAS, 351, 997
- Solórzano-Iñarrea et al. (2001) Solórzano-Iñarrea, C., Tadhunter, C. N., & Axon, D. J. 2001, MNRAS, 323, 965
- Somerville et al. (2004) Somerville, R. S., et al. 2004, ApJ, 600, 135
- Spergel et al. (2003) Spergel, D. N., et al. 2003, ApJS, 148, 175
- Stanford et al. (2002) Stanford, S. A., Eisenhardt, P. R., Dickinson, M., Holden, B. P., & De Propris, R. 2002, ApJS, 142, 153
- Stanford et al. (1997) Stanford, S. A., Elston, R., Eisenhardt, P. R., Spinrad, H., Stern, D., & Dey, A. 1997, AJ, 114, 2232
- Steidel et al. (2000) Steidel, C. C., Adelberger, K. L., Shapley, A. E., Pettini, M., Dickinson, M., & Giavalisco, M. 2000, ApJ, 532, 170
- Tody (1993) Tody, D. 1993, in Astronomical Society of the Pacific Conference Series 173
- van Ojik et al. (1997) van Ojik, R., Roettgering, H. J. A., Miley, G. K., & Hunstead, R. W. 1997, A&A, 317, 358
- Venemans et al. (2002) Venemans, B. P., et al. 2002, ApJ, 569, L11
- Venemans et al. (2004) Venemans, B. P., et al. 2004, A&A, 424, L17
- Villar-Martín et al. (1999) Villar-Martín, M., Tadhunter, C., Morganti, R., Axon, D., & Koekemoer, A. 1999, MNRAS, 307, 24
- Willott et al. (2003) Willott, C. J., Rawlings, S., Jarvis, M. J., & Blundell, K. M. 2003, MNRAS, 339, 173
- Wilman et al. (2004) Wilman, R. J., Jarvis, M. J., Röttgering, H. J. A., & Binette, L. 2004, MNRAS, 351, 1109
- Wilson & Tsvetanov (1994) Wilson, A. S. & Tsvetanov, Z. I. 1994, AJ, 107, 1227
- Zirm (2003) Zirm, A. W. 2003. Stellar hosts, aligned light and polarization of high- redshift radio galaxies. Ph. D. thesis, Johns Hopkins University
- Zirm et al. (2003) Zirm, A. W., Dickinson, M., & Dey, A. 2003, ApJ, 585, 90
| Bandpass | AB Magnitude | Estimated Line |
|---|---|---|
| ContaminationaaCalculated using the observed spectrum of TN J1338–1942 | ||
| magaaCalculated using the observed spectrum of TN J1338–1942 | ||
| mag (Ly) | ||
| mag (CIV,HeII) | ||
| mag (HeII,CIII]) | ||
| magbbCalculated assuming the composite spectrum of McCarthy (1993) |
| Number | Piece | AB Magnitude | Lyman- Flux | Lyman- Rest-frame | Extinction | Star Formation Rate | ||
|---|---|---|---|---|---|---|---|---|
| aaCalculated for the Ly subtracted image, where the line flux is determined from power-law continuum fits to the and bands for each piece | ( ergs/s/cm2) | Equivalent Width (Å) | UV Continuum (Ly)bbThe star formation rate as calculated by the UV continuum magnitude and the Ly flux (in parenthesis) | |||||
| 1 | Line 1 | 27.14 | 26.82 | 26.80 | 1.17 | 448 | 0.02 | 3 (17) |
| 2 | Line 2 | 27.66 | 27.34 | 27.32 | 0.80 | 492 | 0.02 | 2 (12) |
| 3 | Wedge | 26.19 | 26.36 | 26.81 | 4.20 | 645 | 0.0 | 3 (61) |
| 4 | Continuum 2 | 25.74 | 25.48 | 25.51 | 3.73 | 390 | 0.0 | 9 (54) |
| 5 | Continuum 1 | 25.33 | 24.98 | 24.92 | 1.69 | 121 | 0.06 | 24 (24) |
| 6 | Shock | 26.54 | 26.20 | 26.15 | 2.45 | 536 | 0.04 | 7 (35) |