The composition and size distribution of the dust in the coma of comet Hale-Bopp
Abstract
We discuss the composition and size distribution of the dust in the coma of comet Hale-Bopp. We do this using a model fit for the infrared emission measured by the infrared space observatory (ISO) and the measured degree of linear polarization of scattered light at various phase angles and wavelengths. The effects of particle shape on the modeled optical properties of the dust grains are taken into account. Both the short wavelength (7-44 m) and the long wavelength (44-120 m) infrared spectrum are fitted using the same dust parameters, as well as the degree of linear polarization at different wavelengths in the optical to near infrared domains. We constrain our fit by forcing the abundances of the major rock forming chemical elements to be equal to those observed in meteorites. The infrared spectrum at long wavelengths reveals that large grains are needed in order to fit the spectral slope. The size and shape distribution we employ allows us to estimate the sizes of the crystalline silicates. The ratios of the strength of various forsterite features show that the crystalline silicate grains in Hale-Bopp must be submicron sized. On the basis of our analysis the presence of large crystalline silicate grains in the coma can be excluded. Because of this lack of large crystalline grains combined with the fact that we do need large amorphous grains to fit the emission spectrum at long wavelengths, we need only approximately 4% of crystalline silicates by mass (forsterite and enstatite) to reproduce the observed spectral features. After correcting for possible hidden crystalline material included in large amorphous grains, our best estimate of the total mass fraction of crystalline material is 7.5%, which is significantly lower than deduced in previous studies in which the typical derived crystallinity is %. The implications of this low abundance of crystalline material on the possible origin and evolution of the comet are discussed. We conclude that the crystallinity we observe in Hale-Bopp is consistent with the production of crystalline silicates in the inner solar system by thermal annealing and subsequent radial mixing to the comet forming region (30 AU).
keywords:
comets, composition , comets, Hale-Bopp , infrared observations , polarimetry1 Introduction
Comet Hale-Bopp is undoubtedly the best studied long period comet in the solar system. The unusual brightness of this comet allowed for its discovery when it was still at 7 AU distance from the Earth, and a long term monitoring of the dust activity after perihelion up to almost 13 AU (Weiler et al., 2003). The infrared spectrum taken by the Infrared Space Observatory (ISO) provided a unique opportunity to study the composition of cometary dust (Crovisier et al., 1997; Lellouch et al., 1998). The strong resonances visible in this spectrum were attributed to the presence of crystalline silicates.
The relatively sharp m feature in the ISO spectrum together with observations of an extremely high degree of linear polarization lead to the conclusion that the dust in the coma of Hale-Bopp has an overabundance of submicron sized grains (see e.g. Hanner et al., 1999; Mason et al., 2001, and references therein).
The composition of the dust in Hale-Bopp has been modeled frequently in the literature applying various approaches (see e.g Lellouch et al., 1998; Li and Greenberg, 1998; Brucato et al., 1999; Wooden et al., 1999; Harker et al., 2002; Bouwman et al., 2003; Moreno et al., 2003). The interpretation of the results obtained from the observations lead to discussions in the literature on the origin and evolution of cometary dust (for a review see Wooden, 2002). Cometary dust is believed to be the most primitive material present in the solar system. The high crystallinity found by most studies of the infrared emission spectrum presents a problem for this scenario. Since the dust that entered the proto-solar nebula from the interstellar medium is almost completely amorphous (Li and Draine, 2001; Kemper et al., 2004), the crystalline silicates in Hale-Bopp have to be products of processing in the early solar system. Crystalline silicates can only be produced in high temperature environments (K), so close to the Sun, while comets form in regions where the temperatures are low enough for water ice to exist (K). Thus, the crystalline silicates have to be transported outwards to the regions where the comets form, or the dust temperature must be locally increased due to for example lightning or shock annealing (Harker and Desch, 2002; Pilipp et al., 1998; Desch and Cuzzi, 2000).
It is clear that in order to constrain the models explaining the crystalline silicates in cometary material, accurate knowledge of the abundances of the various components in the dust is required. However, the large differences in the derived crystalline silicate abundances published in the literature so far make progress in this area difficult. All studies agree that the abundance of sub-micron sized crystalline silicates is very high (although again with considerable spread), but the question remains open what the crystallinity of the larger grain population is, where most of the mass resides. This is because modeling the optical properties of large, irregularly shaped particles composed of material with high refractive index is difficult.
In this study, we combine for the first time both the available observations of the thermal emission as obtained by ISO (Crovisier et al., 1997; Lellouch et al., 1998) and the degree of linear polarization taken from Ganesh et al. (1998); Jockers et al. (1999); Hasegawa et al. (1999); Manset and Bastien (2000) and Jones and Gehrz (2000), with a single dust model. In contrast with previous studies we calculate the optical properties of the dust grains using a method where we can take into account both size and shape effects. With this method, we obtain information on the composition and mass of the large grain component. Also we constrain the chemical abundances as known from studies of meteorites. Thus, we are able to better constrain the dust composition and size distribution in the model than previous studies. As we will show, the size distributions of crystalline and amorphous silicates are very different, and we are able to rule out the presence of substantial amounts of large (1-10 m) crystalline silicates. This results in a much lower overall crystallinity than most other studies found.
2 Method
In this section we will outline the method used to interpret the observations of the thermal infrared emission and the degree of linear polarization of comet Hale-Bopp in terms of the properties of the particles in the coma. The method we use has a few important characteristics:
-
•
Both size and shape effects of the dust grains are taken into account when calculating the optical properties, i.e. the absorption (emission) cross sections and the degree of linear polarization of scattered light. In contrast with previous studies, our shape distribution enables us to use the same particle shapes for all dust components and grain sizes. This implies that we can, for the first time, include the effects of grain size on the optical properties of crystalline silicate grains.
-
•
The parameters of the size distributions and the abundances of the various components are determined using an ’objective’ least squares fitting routine.
-
•
We require the best fit model to fulfill the constraint that the dust in comet Hale-Bopp has the same abundances of the chemical elements of the major solid state materials as observed in interplanetary dust particles and meteorites.
2.1 Size and shape of the dust grains
The optical properties at a particular wavelength, i.e. the absorption and scattering cross sections as well as the scattering matrix, of a dust grain are determined by its size, shape, orientation, structure and chemical composition. Throughout this paper the size of a dust grain is defined as the radius of a volume equivalent sphere, . We use for the size distribution a powerlaw given by
| (1) |
Here is the number of dust particles of an ensemble with sizes between and ; and are the minimum and maximum grain size, respectively, in the size distribution; is the index of the powerlaw, and is a normalization constant. We choose so that
| (2) |
where is the density of the material considered. Hence, is the number of dust particles with sizes between and per unit mass. The effective radius, , and the effective variance, , are often used to characterize a size distribution. They are defined by (Mishchenko et al., 2002)
| (3) | |||||
| (4) |
where
| (5) |
is the average geometrical shadow of the dust grains. The is simply the surface-area weighted mean whereas is the surface-area weighted variance of the distribution.
The shape of the dust grains is an important parameter determining their optical properties. Pictures of interplanetary dust particles (IDPs) show very complex shapes and structures (Warren et al., 1994). To model these complex shapes in detail requires much computing time, which limits the number of other particle parameters that can be studied. In Min et al. (2003) it is shown that when the absorption cross sections of small particles are considered their shapes can be roughly divided into two categories. The first category contains homogeneous spherical particles, whereas the second category contains all other particle shapes. Effects of the specific particle shape distribution on the absorption properties in the second category are present, but small compared to the differences with homogeneous spheres. This implies that the exact shape of the particles is, in a first approximation, not important as long as we brake the homogeneity or perfect spherical symmetry of a homogeneous sphere. This approach is an example of the statistical approach (see e.g. Kahnert et al., 2002; Kahnert, 2004). In this approach the absorption properties of an ensemble of irregular particles are simulated by the average absorption properties of an ensemble of particles with simple shapes.
In this paper we use a distribution of hollow spherical particles (DHS). In this distribution a uniform average is taken over the fraction, , of the total volume occupied by the central vacuum inclusion in the range , where . All particles in this distribution have the same material volume, so that the particles with higher values of have larger outer radii. For details regarding this distribution we refer to Min et al. (2003). In order to reproduce the wavelength positions of the spectral features of crystalline silicate grains, we have to choose (Min et al., 2003). Numerical computations for particles with are not possible since these would have an infinitely large outer radius. For particles much smaller than the wavelength, integrating the optical properties up to can be done analytically (Min et al., 2003). For larger particles numerical computations are necessary. We then choose large enough to reach convergence to the values for . For most cases we considered, it suffices to integrate up to . The optical properties of hollow spherical particles are calculated using a simple extension of Mie theory (Aden and Kerker, 1951). The calculations were done using the layered sphere code for which the basic ideas are explained in Toon and Ackerman (1981). We would like to stress that we do not allege that hollow spheres are a good approximation for the real shape of cometary dust grains. Rather, the properties of the particles in the DHS determining the absorption and polarization behavior of the entire ensemble represent in a statistical way those of an ensemble of realistically shaped dust grains.
One of the advantages of the DHS is that the scattering and absorption properties can be calculated easily for almost all grain sizes and wavelengths. This means that we can calculate the absorption cross sections as well as the degree of linear polarization for incident unpolarized light as a function of scattering angle, which enables us to fit simultaneously the observed infrared emission spectrum and the degree of linear polarization using the same dust parameters. In Min et al. (2003) it is shown that good agreement between calculations for the distribution of hollow spheres and measurements of the mass absorption coefficients of small forsterite grains as a function of wavelength can be obtained. Also, as is shown by Min et al. (2005), the degree of linear polarization as calculated using the DHS is in good agreement with laboratory measurements of irregularly shaped quartz particles.
A cometary dust grain consists most likely of a mixture of various components such as, for example, olivine, carbon and ironsulfide. In using the model described above we assume that the optical properties of such a mixed particle can be represented by the average properties of homogeneous particles for each of the separate components. The validity of this approach for core-mantle grains is studied by Li et al. (2002) and shown to be dependent on the shape of the dust grains. In general, whether it is a valid assumption depends on the compactness of the composite particle. When the grains are very ’fluffy’ aggregates composed of homogeneous monomers, the grain components will approximately interact with the incoming light as if they were separate. However, in a more compact structure, the effects of interaction between the separate components can become visible.
Throughout the paper we will first average over particle shape () which will be denoted by . The averaging over particle shape and size will be denoted by .
2.2 Thermal emission
To compute the radiation emitted by an ensemble of monodisperse dust grains in random orientation as a function of wavelength we need two ingredients, i) the orientation averaged absorption cross section as a function of wavelength, and ii) the temperature of the dust grains. When both are known we can calculate the observed thermal radiation of a dust grain averaged over all orientations as follows
| (6) |
Here is the flux density at distance , is the wavelength of radiation, is the temperature of the dust grain, is the Planck function, and is the orientation averaged absorption cross section of the dust grains at wavelength . The thermal radiation of grains with the temperatures we consider is mainly emitted in the infrared part of the spectrum. At these wavelengths the effect of scattering of solar radiation on the total observed flux is negligible.
The temperature of the dust grains is calculated by assuming thermal equilibrium, i.e. the energy absorbed is equal to the energy emitted. Note that dust grains with equal size and composition but different shapes and/or orientations can have different equilibrium temperatures. However, we assume that all dust grains with the same volume and composition have the same temperature determined by the shape and orientation averaged absorption properties (as is usually done).
The coma of Hale-Bopp is optically thin. Therefore, we only need to consider direct illumination of the coma grains by the Sun and we may ignore the diffuse radiation field caused by, e.g., scattering of solar light by the coma material. We assume the Sun to radiate like a black body with a temperature of K.
Since the absorption cross section, and, therefore, the temperature, depends on the size and chemical composition of the particles we determine the temperature for each different dust particle size and material separately. Using the size distribution given by Eq. (1) the flux per unit mass from dust component is given by
| (7) |
In this equation is the size distribution of component with minimum and maximum radii and ; is the orientation and shape averaged absorption cross section of an ensemble of dust grains of material with size , and is the temperature of the dust grains in this ensemble. Since the coma of comet Hale-Bopp is optically thin, the total flux averaged over particle size, shape, orientation and composition is simply the sum over the various components
| (8) |
where is the total mass of dust component .
2.3 Degree of linear polarization of scattered light
In the visible part of the spectrum the radiation from the cometary halo is dominated by sunlight scattered once by dust grains. The intensity and polarization of the scattered light depend on the angle of scattering and the wavelength. For a comet it is possible to obtain measurements of the degree of linear polarization for various scattering angles by observing the comet at various moments during its orbit around the Sun. All information on the angular dependence of the scattering behavior of an optically thin ensemble of dust grains is contained in its scattering matrix. When the size and shape distributions and the abundances of all dust species are known, we can calculate the average scattering matrix of the ensemble if enough data of the refractive index is available. From this matrix we can obtain the degree of linear polarization for incident unpolarized light of dust component
| (9) |
where is the phase angle and is the th element of the scattering matrix averaged over size and shape of the dust grains (for details see van de Hulst, 1957). It should be noted that for calculations and measurements presented in the literature often the scattering angle, , is used instead of the phase angle, . For comets it is more convenient to use the phase angle. Since multiple scattering can be neglected for comets we have .
In order to calculate the degree of linear polarization of an ensemble of particles not only averaged over particle size and shape distributions but also over dust materials, we have to average the matrix elements . Thus the average polarization is given by
| (10) |
2.4 Least squares fitting procedure
To make a fit to the observations of Hale-Bopp we need to fine-tune the free parameters in the model in such a way that we minimize the differences between the results of the model computations and the observations in a well defined way. The model we constructed has free parameters, where is the number of dust species we include in the fitting procedure. By choosing the index of the powerlaw, , the same for all dust species this reduces to free parameters, namely . The error on the infrared emission spectrum is defined as
| (11) |
In this equation () is a chosen wavelength grid; is the observational value of the flux at wavelength , and is the error of the observed flux at wavelength . In order to estimate we assume that the error in the spectral observations is proportional to the square root of the observed flux. The position of the minimum value of is independent of the absolute value of the error. Note that, since we do not have the values of the absolute errors of the spectral measurements, the is not equal to the reduced and cannot be interpreted as the statistical goodness of fit.
The error of the degree of linear polarization is defined as
| (12) |
In this equation is the degree of linear polarization observed at phase angle () and wavelength (), while is the error in the observed polarization at phase angle and wavelength . Note that the number of phase angles at which observations are available may vary with wavelength.
The most straightforward way to define the total is to take the sum of and . However, since we have many more measurements of the infrared flux than we have observations of the degree of linear polarization and we are unable to compute the reduced , this would lead to a stronger weight of the spectral measurements than the polarization observations. Therefore, we chose to minimize
| (13) |
The minimization of as defined by Eq. (13) is done using a combination of two methods. Since the total spectrum is a linear combination of the separate spectra for the different components (see Eq. 8), we are able to separate the fitting problem into a non-linear and a linear part. The non-linear part consists of minimizing for all , and , and the linear part does the minimization for all .
For the non-linear part of the minimization we use a genetic optimization algorithm called pikaia (Charbonneau, 1995). This algorithm tries to find a global maximum of an arbitrary function in a large parameter space by using concepts from evolution theory. Every set of parameters is called an individual, the parameters are the ’genes’. The procedure starts with a randomly initialized population of individuals and calculates the for each individual. The individuals with the highest values of (lowest values of ) are then given the best chance to ’reproduce’ into the next generation of individuals. This reproduction is done by mixing the genes of two individuals into a new individual. When this procedure is repeated through several generations, the individuals with low values of will die out and only individuals with high values of will survive. In the end (after generations) the best individual, which represents the best fit parameters, will survive. To ensure convergence also mutations – random variations on the parameters – are included in the algorithm. An extensive description can be found in Charbonneau (1995). Although the algorithm is not very fast – many models need to be calculated – it is very robust in the sense that it will (almost) always find the global maximum, whereas other optimization codes frequently end up with a local maximum.
For every individual in the genetic algorithm we determine the best values for the by minimizing the using a linear least squares fitting procedure. Linear least squares fitting amounts to solving an overdetermined matrix equation in a least squares sense. To ensure that all are positive we need a robust linear least squares fitting procedure with extra linear equality and inequality constraints. We use the subroutine dlsei from the slatec library111The slatec library is publicly available for download at: http://www.netlib.org/slatec/. The inequality constraints are used to ensure that . The equality constraints are used to constrain the chemical abundances as will be explained in section 2.6. Using the thus derived, we calculate and . Although in this way we might miss the absolute minimum, we can use this approach since the infrared spectrum is more sensitive to the exact dust composition than the degree of linear polarization is, which is more sensitive to the size distribution.
In order to estimate the errors on the derived abundances of the dust species we consider all individuals from all generations with a value of smaller than times the minimum value of . The value was chosen such that all fits within this range are still in reasonable agreement with the observations.
The entire fit procedure is schematically outlined in Fig. 1.

2.5 Dust components
In this section we will discuss the dust components we chose for our model computations. Based on previous studies and on the composition of IDPs we make the following selection of components.
- Amorphous Carbon
-
(C). We assume that most of the Carbon atoms that are in the solid state phase will be present as amorphous carbon. The emission spectrum of amorphous carbon gives a smooth continuum contribution without clear spectral structure. From the in situ measurements by the Vega spacecraft when it encountered the coma of comet Halley, we know that approximately half of the total available C is present in the solid state phase (Geiss, 1987). Carbon probably acts as a matrix in which the other materials are embedded. The refractive index as a function of wavelength is taken from Preibisch et al. (1993).
- Amorphous Olivine
-
(Mg2xFe2-2xSiO4). Amorphous olivine is one of the most abundant dust species in circumstellar and interstellar material (see e.g. Molster et al., 1999; Bouwman et al., 2001; Li and Draine, 2001; Forrest et al., 2004; Kemper et al., 2004). The silicate dust in the diffuse interstellar medium is dominated by amorphous olivine (Kemper et al., 2004). The emission by small amorphous olivine grains shows broad spectral features at and m. Both are detected in the spectrum of Hale-Bopp. T he data for the refractive indices are taken from Dorschner et al. (1995).
- Amorphous Pyroxene
-
(MgxFe1-xSiO3). Amorphous pyroxene is spectroscopically hard to distinguish from amorphous olivine. Pyroxene is often found in IDPs. The emission by small amorphous pyroxene grains shows a spectral structure which is similar to that of amorphous olivine grains. However, the maximum of the m feature is shifted towards slightly shorter wavelengths and the shape of the m feature is slightly different. The refractive indices for amorphous pyroxene are taken from Dorschner et al. (1995).
- Crystalline Forsterite
-
(Mg2SiO4). Crystalline forsterite is the magnesium rich end member of the crystalline olivine family. Experiments indicate that when amorphous olivine is annealed under certain conditions, the iron is removed from the lattice structure and crystalline forsterite is formed. The most important resonances in the emission spectrum of small crystalline forsterite grains are located at wavelengths , , and m. These features are observed in the spectra of, for example, AGB stars and protoplanetary disks (see e.g. Waters et al., 1996; Bouwman et al., 2001) and are clearly visible in the spectrum of Hale-Bopp (Crovisier et al., 1997). For the refractive indices of forsterite we use the data of Servoin and Piriou (1973).
- Crystalline Enstatite
-
(MgSiO3). Crystalline enstatite is the magnesium rich end member of the crystalline pyroxene family. Under the right conditions, enstatite can form from a reaction between forsterite and silica. Also, from IDPs there are indications that some enstatite grains formed directly from gas phase condensation (Bradley et al., 1983). The spectrum of small enstatite grains shows prominent features at , , , and m. Although we have no direct evidence for the presence of most of these features, we include enstatite in the fitting procedure because enstatite features have been reported in the ground based spectrum of Hale-Bopp when it was at AU (Wooden et al., 1999). The data for the refractive indices are taken from Jäger et al. (1998).
- Amorphous Silica
-
(SiO2). Laboratory measurements show that when amorphous silicates are annealed to form crystalline silicates, a certain amount of silica is also produced (Fabian et al., 2000). The emission spectrum of small amorphous silica grains shows features at , and m. We take the refractive indices as a function of wavelength measured by Spitzer and Kleinman (1960).
- Metallic Iron
-
(Fe). When amorphous silicates are annealed to form magnesium rich crystalline silicates, the iron is removed from the lattice. The spectral signature of metallic iron grains is very smooth but slightly different than that of amorphous carbon. Although it is not crucial in obtaining a reasonable fit, we include the possibility of metallic iron grains in the fitting procedure for completeness. The refractive indices of metallic iron are taken from Henning et al. (1996).
- Iron Sulfide
-
(FeS). In IDPs all available sulfur is present as iron sulfide. The spectral structure of emission from iron sulfide grains shows a broad feature around m. The fact that this feature is not prominent in the spectrum of Hale-Bopp is probably due to the fact that the iron sulfide grains are relatively large, which reduces the spectral structure significantly. We use the refractive indices measured by Begemann et al. (1994).
To decrease the number of free parameters, we have chosen equal size distributions for both amorphous silicate species (amorphous olivine and amorphous pyroxene) and equal size distributions for both crystalline silicate species (forsterite and enstatite). Furthermore , the index of the powerlaw, is the same for all materials.
2.6 Chemical abundance constraints
The number of free parameters in the method as described above is very large. When we apply no extra constraints we encounter a large set of solutions that all have a more or less equal , but with totally different size distributions and material abundances. We also run the risk of obtaining a best fit solution with very implausible values for the fit parameters. To avoid these problems we constrain the solution by requiring that the major elements for solid state materials (Si, Mg, Fe and S) are all in the solid phase and that their chemical abundances are the same as those found in meteorites. Furthermore, we take the abundance of Carbon in the solid phase to be half the solar abundance, consistent with in situ measurements of the dust in the coma of comet Halley (Geiss, 1987). This gives us four extra constraints on the model. These extra constraints prove to be sufficient to obtain consistent results with the fitting procedure.
We constrain the abundances of C, Mg, Fe and S relative to Si. For the Carbon abundance we take half of the total solar abundance to be in the solid phase, the remaining Carbon is in the the gas phase. Magnesium, iron, sulfur and silicon are assumed to be completely in the solid phase. The abundances we use are taken from Grevesse and Sauval (1998) and are summarized in Table 1. Note that the sulfur abundance measured in meteorites is lower than the solar abundance. Thus by taking the constraints from meteorites for the solid state particles we assume there is also sulfur in the gas phase. This is consistent with observations (Bockelée-Morvan et al., 2000; Irvine et al., 2000). All abundance constraints are incorporated as linear equality constraints to the linear least squares fitting part of the minimization procedure.
| Chemical element | Meteorites | Solar | Constraints |
|---|---|---|---|
| C/Si | - | 9.33 | 4.67 |
| Mg/Si | 1.05 | 1.07 | 1.05 |
| Fe/Si | 0.87 | 0.89 | 0.87 |
| S/Si | 0.44 | 0.60 | 0.44 |
To use the chemical abundance constraints we have to introduce an extra free parameter, , the magnesium fraction in the amorphous silicates. In section 3.2 we will show that the bulk of the material consists of olivine, pyroxene, carbon and iron sulfide. Using this information we can already make a simple but reliable estimate of the value of by adopting these four species only and applying the abundance constraints discussed above (as this implies that we have four constraints and four unknown parameters the material abundances are uniquely defined). The results of this simple calculation are summarized in Table 2, and give . Note that here it is not possible to distinguish between amorphous and crystalline material. The results from the fitting procedure will be slightly different due to a different composition of crystalline and amorphous silicates and the fact that in the fitting procedure we also added silica and metallic iron.
| Dust component | Chemical formula | Abundance (Mass %) |
|---|---|---|
| Carbon | C | 24.6 |
| Olivine | Mg2xFe2-2xSiO4 | 33.4 |
| Pyroxene | MgxFe1-xSiO3 | 25.0 |
| Iron Sulfide | FeS | 17.0 |
3 Results
3.1 Observations
The spectroscopic observations we use are the infrared spectra obtained by the Short Wavelength Spectrometer (SWS) and the Long Wavelength Spectrometer (LWS) on board the Infrared Space Observatory (ISO) (Crovisier et al., 1997; Lellouch et al., 1998). These spectra were taken when the comet was at AU distance from the Sun and AU distance from the Earth. The SWS and LWS spectra have a small overlapping wavelength range (mm). Since the LWS has a larger beam size, it catches emission from a larger part of the coma, resulting in a higher absolute flux level. We assume that the properties of the dust causing the emission does not change as a function of distance from the core of the comet, so we can simply scale the LWS spectrum to match the SWS spectrum in the overlapping wavelength region. We have to note here that there are indications that the size distribution or the compactness of the particles varies slightly as a function of position in the coma (see e.g. Kolokolova et al., 2004, and references therein). When the particles move away from the comet nucleus, the particles might fall apart resulting in more fluffy, or smaller structures. Therefore, one might argue that taking into account the extended region covered by the LWS might bias our results towards a slightly higher fraction of small grains. However, we believe that this effect is only minor since these differences are largest when considering the region very close to the coma, which is covered by both the SWS and the LWS (Kolokolova et al., 2004). For the fitting procedure we used the wavelength range from to m.
For the observational data of the degree of linear polarization we used the combined measurements from various studies in the optical to near infrared part of the spectrum. The measurements were taken from Ganesh et al. (1998); Jockers et al. (1999); Hasegawa et al. (1999); Manset and Bastien (2000) and Jones and Gehrz (2000). The observations also provide the errors . Combining the observations we have polarization data at twelve different wavelengths for various phase angles. We note that in order to obtain observations at different phase angles, the comet has to be observed at different phases during its orbit around the Sun. Therefore, in order to model all these observations using a single dust model, we have to assume that the composition and size distribution of the dust is more or less constant at different phases. Since we consider the degree of linear polarization of scattered light, variations in the total dust mass in the coma are not important.
3.2 Best fit model
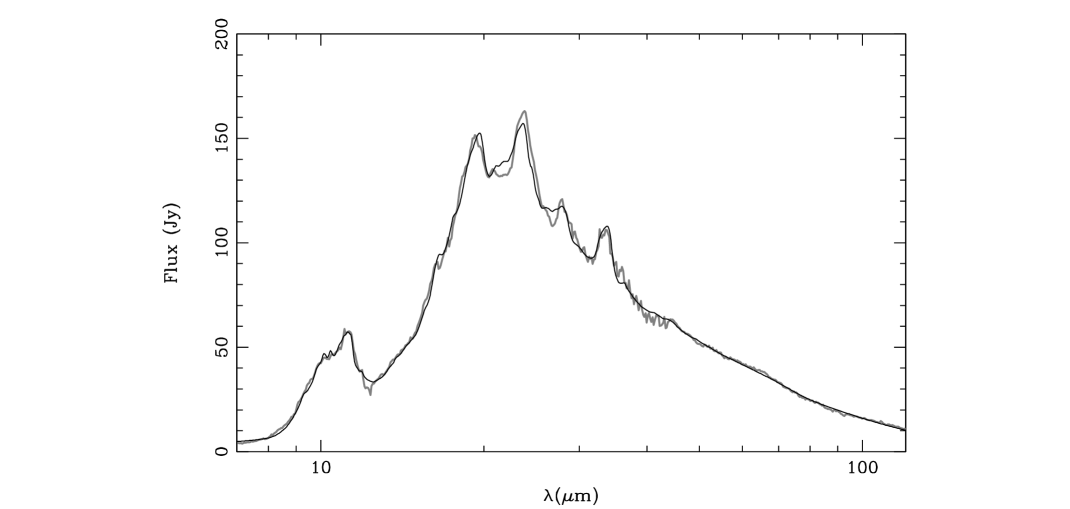
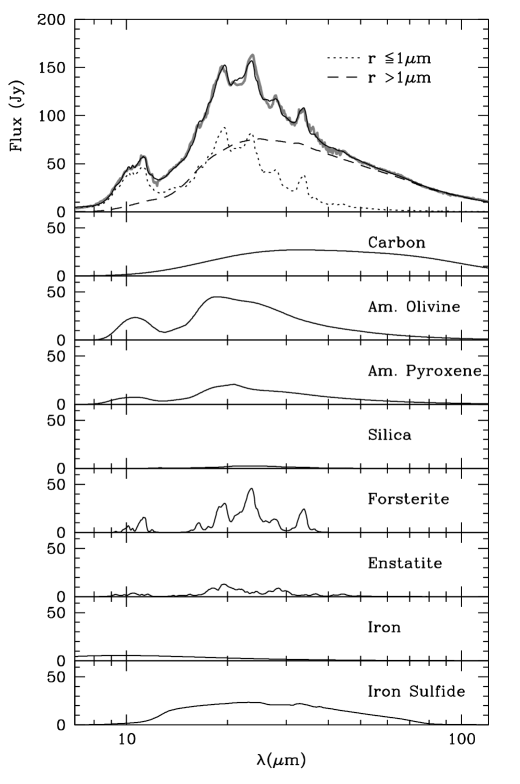
We minimized as defined by Eq. (13) using the method described in section 2.4. The were chosen on a logarithmic grid. Throughout the fitting procedure we fix the value of for each dust species. From the positions of the crystalline silicate resonances we already know that for these materials we have to choose the most extreme shape distribution parameters (). The other materials are chosen to have equal values of . For these materials, we obtain an optimum value . The parameters are shown in Table 4. The infrared spectrum corresponding to the best fit model is shown in Fig. 2 together with the measurements. The resulting curves for the degree of linear polarization as functions of the phase angle, together with the observations, are shown in Fig. 3. The emission spectra of the separate dust components are plotted in Fig. 4.

[]
| Material | Chemical Formula | Bulk density | Volume ( | min / | max ) | Mass | ||||
|---|---|---|---|---|---|---|---|---|---|---|
| (g/cm3) | (%) | (%) | m) | m) | ||||||
| Amorphous Carbon | C | 1.80 | 0.8 | 39.1 ( | 39.0 / | 39.3 ) | 23.8 | 7.0 | 11.6 | -3.48 |
| Amorphous Olivine | Mg2xFe2-2xSiO4 | 3.71 | 0.8 | 25.7 ( | 22.9 / | 32.7 ) | 32.3 | 0.01 | 92.8 | -3.48 |
| Amorphous Pyroxene | MgxFe1-xSiO3 | 3.20 | 0.8 | 18.3 ( | 7.8 / | 23.5 ) | 19.8 | 0.01 | 92.8 | -3.48 |
| Amorphous Silica | SiO2 | 2.60 | 0.8 | 2.2 ( | 0.8 / | 5.6 ) | 1.9 | 6.5 | 7.5 | -3.48 |
| Crystalline Forsterite | Mg2SiO4 | 3.33 | 1.0 | 2.7 ( | 2.5 / | 3.0 ) | 3.1 | 0.05 | 0.1 | -3.48 |
| Crystalline Enstatite | MgSiO4 | 2.80 | 1.0 | 1.3 ( | 0.9 / | 1.7 ) | 1.2 | 0.05 | 0.1 | -3.48 |
| Metallic Iron | Fe | 7.87 | 0.8 | 0.6 ( | 0.3 / | 1.1 ) | 1.5 | 0.2 | 0.3 | -3.48 |
| Iron Sulfide | FeS | 4.83 | 0.8 | 10.1 ( | 10.0 / | 10.1 ) | 16.4 | 0.8 | 4.3 | -3.48 |
Results for the best fit model. The error estimates are obtained by considering all possible fits with . The total dust mass in the beam of the SWS as found from the fit is kg.
Figs. 2 and 3 show that the observations of both the infrared spectrum and the degree of linear polarization can be reproduced remarkably well using the same dust model. In other words, we do not need quite different models for the infrared and optical parts of the spectrum. The differences between the observed and predicted infrared spectrum are most probably mainly caused by uncertainties in the refractive index data, and the assumptions on which the model is based. For the degree of linear polarization we notice that the negative polarization branch at nm (and to a smaller extend at and nm) at small phase angles is not reproduced satisfactorily by the model. This is most likely due to the spherical symmetry of the shapes we employed. In addition a discrepancy between the model and the observations occurs at and nm, which is possibly also connected to the adopted spherical particle shapes. The scattered light is dominated by the contributions from the silicate (olivine and pyroxene) and ironsulfide grains. The contribution to the scattered light from carbon grains is negligible. Although the abundance of silicates is much higher than that of ironsulfide, the scattering caused by ironsulfide grains is comparable to that of the silicates due to its high scattering efficiency. Especially at near infrared wavelengths (the and nm measurements) the scattering is dominated by ironsulfide grains.
The best fit model we present combines for the first time observations of the SWS infrared spectrum (m), the LWS infrared spectrum (m) and the degree of linear polarization at several wavelengths in the optical to near infrared. This results in a better constrained dust model. The spectral structure of the thermal emission in the SWS part of the spectrum provides crucial information on the composition of the dust. The LWS part of the spectrum combined with the degree of linear polarization provides information on the size of the dust grains. We also constructed fits excluding some of the observations from the model. An attempt to fit only the SWS part of the spectrum resulted in an underestimate of the fraction of large grains, which in turn resulted in a higher fraction of crystalline silicates, more comparable to that found in, for example, Bouwman et al. (2003). Fitting both the SWS and the LWS part of the spectrum without the linear polarization resulted in a dust composition only slightly different (i.e. within the given error bars) from that presented in Table 4. The size distribution is affected more significantly. Also, using observations of the linear polarization at less wavelength points changed the parameters of the best fit model. For example, the best fit model when the observation of the degree of linear polarization at and nm are removed from the model contains no amorphous pyroxene and % amorphous silica. This can be explained in part by the interchangeability of olivine and pyroxene grains (see also van Boekel et al., 2005). The size distribution of this best fit model is changed such that the upper size limit of the amorphous olivine component is only m but the slope of the size distribution is more weigthed towards the larger grains, . The other parameters are only affected mildly.
The total dust mass in the SWS beam derived from the best fit model is kg. This dust mass is comparable to that estimated by Bouwman et al. (2003) which is kg. Note that the dust mass derived in this way is a lower limit on the real mass of the solid state material in the coma of Hale-Bopp since the mass most likely resides predominantly in the very large grains. Using data obtained at submillimeter wavelengths, which provides information on millimeter sized dust grains, Jewitt and Matthews (1999) derive a total dust mass of kg within a beam size comparable to that of the ISO SWS.
In our model the temperature of all dust species is determined self-consistently. However, from the ratio of the strengths of the forsterite features it can be seen that the temperature of the forsterite grains is higher than would be determined from thermal equilibrium calculations using pure forsterite grains (Harker et al., 2002). Pure forsterite grains are not very efficient absorbers in the UV and the optical part of the spectrum where a large part of the solar energy is emitted. They are very efficient emitters in the infrared. Therefore, pure forsterite grains will be cold compared to other dust species. The fact that they are observed to be relatively warm is probably an effect of thermal contact between the various dust species (Bouwman et al., 2003). An aggregated structure where all dust species are in thermal contact is also consistent with pictures of interplanetary dust particles. To calculate the optical properties of an aggregated structure in a completely consistent way is very computationally intensive which makes it extremely difficult to examine the entire parameter space of dust abundances and grains sizes. Some work on this has been done by Moreno et al. (2003) considering fixed values of the material abundances. To simulate thermal contact we polluted the forsterite and enstatite grains with 3% of small metallic iron inclusions. We calculated an effective refractive index using the Maxwell-Garnet effective medium theory (see e.g. Bohren and Huffman, 1983). When we pollute the crystalline silicates in this way, the equilibrium temperature is in agreement with the observations.
3.3 Dust composition and size distribution
When discussing the size distribution of the dust we have to consider the grain sizes that our analysis is sensitive to. For grains smaller than a few micron (m) we have a strong spectroscopic diagnostic. At relatively short wavelengths (around 10 m) we are mainly sensitive to the composition of these small grains. If we go to longer wavelengths, we are also sensitive to the composition of larger grains. Using the SWS and LWS range from m, we have a spectroscopic diagnostic for the composition of grains with a volume equivalent radius up to 10-15 m. Although larger grains do show spectral structure (Min et al., 2004), their emission efficiency is too low to be detected.
When we compare our best fit parameters with those obtained by others (Brucato et al., 1999; Galdemard et al., 1999; Wooden et al., 1999; Hayward et al., 2000; Harker et al., 2002; Bouwman et al., 2003) there are a few differences. First of all the amount of crystalline silicates is much smaller than that found in most of these studies. This is caused by the fact that previous studies mainly considered the small (submicron sized) grain component. In our model, we find that in order to reproduce the spectral features, the crystalline silicate grains have to be very small and thus they have a high emission efficiency. From, i.e. the LWS spectrum, we find that the amorphous grains are relatively large, and thus emit less efficiently. Thus, if one only considers the small grain component, the crystallinity is increased with respect to our findings. The crystalline grains have to be small in order to reproduce the ratios of the strengths of the different emission features. However, these ratios are also influenced by the temperature of the dust grains. Fortunately, we can distinguish temperature effects from grain size effects in the following way. In determining the absorption cross sections of dust particles the most important parameter is where is the complex refractive index and is the size parameter of the dust grain. When the grains are in the Rayleigh domain and strong spectral emission resonances occur. When increases, the spectral features decrease in strength. For very large grains () the emission features will change into emission dips (see Min et al., 2004). When the grain size is increased, first the features caused by resonances with high values of become weaker and then the features with smaller values of . This means that this effect depends on the wavelength but also on the refractive index; the strongest features (with the highest values of ) will go down first. However, when going from high temperatures to low temperatures, the effect on the strength of the features shifts with the maximum of the underlying Planck function, so this effect only depends on the wavelength position of the features. This difference allows us to distinguish between size and temperature effects by carefully looking at the feature strength ratios.

To test if the ratios of the forsterite resonances can be explained using temperature effects instead of a difference in grain size between amorphous and crystalline silicates, we calculated the strengths of the and m features above the local continuum using the DHS for different grain sizes and temperatures. These strengths are denoted by and respectively. The strength ratios are plotted in Fig. 5 for various grain sizes and temperatures. The temperatures were varied from K. Also plotted in Fig. 5 is the peak ratio measured in the spectrum of Hale-Bopp. We see that there is no corresponding set of temperature and grain size in Fig. 5 that reproduces the ratios measured in Hale-Bopp. To get the best fit we need to go to very small and relatively warm forsterite grains. The fact that the forsterite has to be warm also indicates that the grains must be small and most probably are in thermal contact with (at least) a strong absorbing material like carbon or iron.
The fact that we cannot find a set of temperature and grain size with peak ratios in Fig. 5 corresponding to those observed in the infrared spectrum could be caused by the effect that in the spectrum of Hale-Bopp the m feature is partly blended with an enstatite feature resulting in a weaker feature. If we would take this effect into account, the point would shift downward in Fig. 5. Another explanation could be that the forsterite in Hale-Bopp is slightly contaminated with iron, which results in a slightly weaker m feature (Koike et al., 1993).
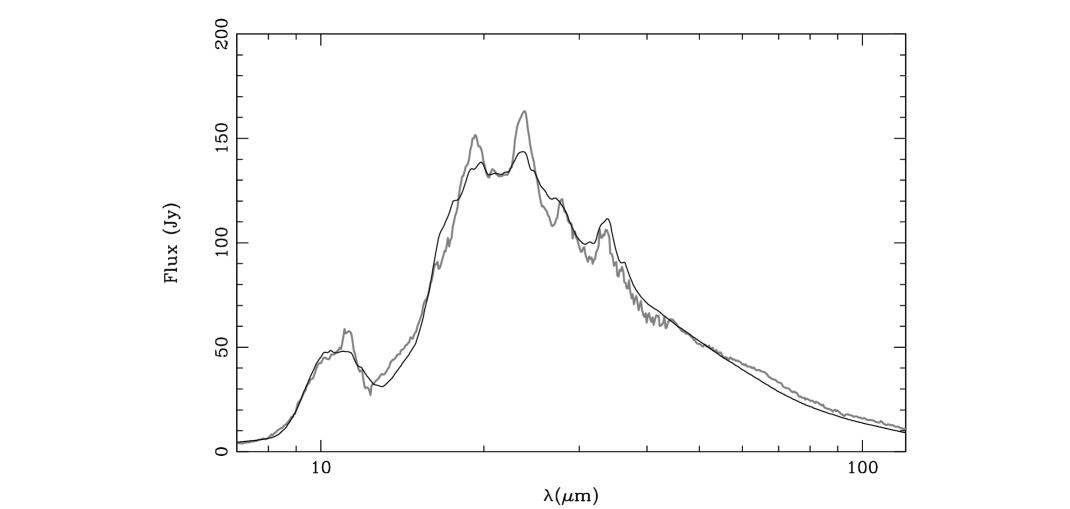
As a test we made a fit to the SWS and LWS spectra fixing the upper size of the crystalline silicate grains. We have tried to make a fit to the spectrum using and m, respectively, and varying all other parameters. The resulting model spectra did not satisfactorily reproduce the measured ISO spectra. In order to obtain a reasonable fit to the observed forsterite features, we had to employ a power law for the size distribution more biased towards small grains, . However, in all these model fits the strength ratios of the forsterite features were poorly reproduced. In Fig. 6 we plot the resulting best fit model for the case when m. We note that the emission spectrum is not sensitive to the very large forsterite grains. Although these grains still display significant spectral structure (Min et al., 2004), their emission efficiency is small. Therefore, it is possible to have a bimodal size distribution of crystalline silicates, in which only very small and very large crystals are present while the intermediate sized grains are absent, and still reproduce the infrared spectrum of Hale-Bopp. However, such a size distribution is very unlikely.
When comparing our results to those obtained by other studies, we have to be careful with the definition of crystallinity. Here, we mean by crystallinity the mass fraction of crystalline silicates compared to the total dust mass. In previous studies, sometimes the crystallinity is defined as the mass fraction of crystalline silicates compared to the total mass in the silicate component. In our fit, approximately % of the dust mass is contained in non silicate materials like carbon and ironsulfide. When comparing with other studies we have to correct for this.
Since previous studies of the mineralogy of the dust in the coma of Hale-Bopp focused on the SWS part of the spectrum, little information was available on the large grain component. As can be seen from Fig. 4 the LWS spectrum (longward of 44 m) displays a long wavelength slope that can only be explained using large grains at approximately blackbody temperature (see also Lellouch et al., 1998). We have just shown that this large grain component cannot be crystalline. Since the large grains contain most of the mass, the resulting abundance of crystalline silicates is small, % (Table 4). We should note here that part of the crystalline silicates are probably not spectroscopically detectable since these are hidden inside large amorphous silicate or carbon grains. Therefore the % crystallinity we derive is a lower limit. We can make a quantitative estimate of the true fraction of crystalline grains by only considering grains smaller than a certain size, for which we assume that we observe the properties of the entire grain. In order to assure that the resulting mixture still has solar abundances, we fix the total abundance of silicates (crystalline and amorphous olivine and pyroxene). Considering only the silicate component, we compute the crystalline over amorphous ratio excluding the larger silicate grains. We then use this crystalline over amorphous ratio to compute the fraction of crystalline silicates in the total mixture. We choose a volume equivalent radius of m as the maximum grain size, which represents approximately half of the total dust mass. The crystallinity derived in this way depends on the assumption of this grain size, and detailed calculations are required to obtain a better estimate of the appropriate size. We thus derive a crystallinity of 7.5% (5% of crystalline forsterite and 2.5% of crystalline enstatite). Note that most previous studies on the SWS spectrum of Hale-Bopp only included forsterite, no enstatite. In contrast with our findings, these studies typically find forsterite fractions of 20-30%. The fraction of crystalline silicates in our best fit model increases when we consider only smaller grains. The submicron grain component contains approximately % forsterite and % enstatite. This fraction of forsterite is consistent with the results from previous studies that focused on the submicron grain component (see e.g. Brucato et al., 1999).
It can be noted from Table 4 that the dust components with a high abundance reside in relatively large grains. Although the large grains contribute much to the total dust mass, they contribute only little to the infrared emission at short wavelengths. Therefore, we conclude that the long wavelength part of the spectrum and the degree of linear polarization contain crucial information on the large dust grains, and, therefore, on a large fraction of the total dust mass.
We can calculate the effective radius and variance, and , of the dust grains in our model using Eqs. (3) and (4). For our best fit model m and . Typical values for the effective volume equivalent radii computed from the size distributions found in other studies are m (Bouwman et al., 2003) and m (Moreno et al., 2003). The larger that we find is most likely due to the additional information contained in the long wavelength slope. Employing a simple model for porous dust grains, Li and Greenberg (1998) argue that the average grain size in Hale-Bopp might be much larger (8-25 m) and that the fraction of submicron grains might be negligible. Perhaps cometary dust grains are indeed very fluffy aggregates of small particles. However, it is probably difficult to discriminate between a large fluffy grain and a large number of small separate grains using spectroscopy or observations of the degree of linear polarization.
The fact that the most abundant dust species reside in the largest grains is a natural consequence of the formation mechanism of the larger dust grains. Larger dust grains are believed to form by coagulation of smaller grains. The materials that are more abundant, can form large clusters of this material, whereas the less abundant species may be distributed in the aggregate as separate monomers. If the aggregate is very fluffy, the low abundance of the latter species causes the distance between the inclusions to be on average relatively large. Thus, one could argue that these inclusions will not interact very strongly with each other, and their resulting optical properties will be those of small particles. On the other hand, the larger clusters formed by the more abundant dust species will produce optical properties more like those of large grains. This hypothesis may be tested by simulations of the optical properties of fluffy composite particles with extreme abundance differences.
We conclude that the crystalline silicates in the coma of comet Hale-Bopp are submicron sized. This is much smaller than the typical grain size found for the other dust components. In agreement with these findings, the crystalline silicates found in IDPs are predominantly submicron sized (Bradley et al., 1999). This difference in grain size between the amorphous and crystalline components results in a relatively low overall abundance of crystalline silicates. The abundance of crystalline silicates and the difference in grain size are important constraints when considering models of the processing and dynamical history of dust in the early solar system.
4 Discussion: Origin and evolution of cometary dust
Since comets are small bodies that have been frozen all of their lifetime, the comet material is expected to have undergone little processing since the comet’s formation. In larger bodies, like planets, the material has experienced severe parent body processing erasing the information on the original dust grains. Therefore, comets contain a unique diagnostic of the mineralogy of the dust in the protoplanetary disk at times when the planets and comets were formed. The fraction of crystalline silicates in the diffuse interstellar medium (ISM) is very low. Li and Draine (2001) derive an upper limit for the crystallinity of the dust in the ISM of %, while Kemper et al. (2004) even derive an upper limit of %. In addition, the crystallinity of the ISM dust derived by van Boekel et al. (2005) is 1%. This implies that the dust in Hale-Bopp has undergone at least some processing in the solar nebula, before it got incorporated into the comet. In order to form crystalline silicates, the amorphous silicates have to be heated above the glass temperature of 1000 K. Comets form in the outer regions of the disk where the temperatures are low enough for water ice to exist K. There are two possible ways to explain the presence of crystalline silicates in cometary dust grains. The first is that the amorphous silicates are crystallized by thermal annealing in the hot inner regions of the protoplanetary disk. The crystalline silicates are then mixed out to the regions where the comets form. Another possibility is that the crystalline silicates are produced locally. Processes that have been proposed for this are, for example, shock annealing (Harker and Desch, 2002) and lightning (Pilipp et al., 1998; Desch and Cuzzi, 2000). Recent evidence for radial mixing in protoplanetary disks is presented in van Boekel et al. (2004) on the basis of interferometric measurements of the dust in the inner disk regions. In that paper it is found that the crystallinity in the inner disk regions is higher than that in the outer disk regions. This difference, along with a varying forsterite over enstatite ratio, is consistent with predictions from radial mixing models (Gail, 2004).
Several studies have tried to explain the presence of crystalline silicates in comets by considering radial mixing. In these studies only the evolution of the silicate component is computed. For comparison with our computations, we therefore have to correct for the additional components included in the fit. The fraction of crystalline silicates in the silicate component (amorphous and crystalline olivine and pyroxene) is approximately %. In Gail (2004) a detailed model for the protosolar disk is presented in which dust chemistry, thermal annealing and radial mixing are incorporated. The computations in this paper are for a stationary model, so an equilibrium situation is calculated. The crystallinity that follows from this detailed model depends strongly on the distance to the star. Close to the star, the crystallinity is very high (70% at AU), while in the comet forming region (20 AU) the crystalline fraction equals approximately % (% crystalline olivine and % crystalline pyroxene). The author concludes that the results from the stationary model cannot be extrapolated to distances beyond AU, and can only be considered an approximation for the mineral composition of the inner AU at several times years. Wehrstedt and Gail (2002) present a time depend model of radial mixing. From the results of this paper, it is apparent that the equilibrium situation as computed in Gail (2004) is already attained after years. This is slightly shorter than the anticipated typical timescale for comet formation (which is a few times years, see Weidenschilling, 1997). The crystallinity computed by Wehrstedt and Gail (2002) at a distance of AU is approximately % after years. Bockelée-Morvan et al. (2002) also present a model describing time-dependent radial mixing in a protoplanetary disk. In this paper, three different solar nebula models are presented, a warm, a nominal, and a cold model referring to the temperature structure in the solar nebula. This temperature structure is set by the viscosity parameter ; the higher the values of the lower the temperature. They derive an extremely well mixed nebula, in which, after years, the crystallinity at distances AU is independent of the distance. They arrive at a final crystallinity in the outer solar system ( AU) of approximately , and % according to the warm, nominal, and cold solar nebula model. Note that the parameters chosen by Wehrstedt and Gail (2002) and Gail (2004) correspond to the warm to nominal solar nebula model of Bockelée-Morvan et al. (2002). The predicted crystallinity in the comet forming region from both Gail (2004) and Bockelée-Morvan et al. (2002) shows that thermal annealing and radial mixing are more than sufficiently efficient mechanisms to explain the crystalline silicates in Hale-Bopp. The most important free parameter in the above models is the viscosity parameter. The crystallinity of cometary dust can be used to constrain this parameter, providing a better insight in the dynamics of protoplanetary disks. While the crystallinity derived for Hale-Bopp in previous studies could only be explained employing a viscosity parameter that is representative for a warm solar nebula model, the crystallinity we derive for Hale-Bopp is consistent with a viscosity parameter that is typical for an approximately nominal solar nebula and a formation distance of some AU from the central star.
The crystalline silicates we find are all submicron sized, consistent with studies of IDPs, in which the crystalline inclusions are predominantly submicron sized (Bradley et al., 1999). There are two possible explanations for this. The first explanation is that the crystalline silicates are formed before efficient grain growth sets in. Due to the low crystallinity this would result in a dust grain that has the crystalline silicates scattered in the aggregate as small separate inclusions. However, this possibility can likely be excluded on the basis of the results presented by van Boekel et al. (2005). From the analysis of a large sample of protoplanetary disks, it is concluded that grain growth occurs before efficient crystallization sets in. Another explanation might be that the mechanism that produces the crystalline silicates in the comet forming region is more efficient for small grains than for large grains. Both local flash heating events (like shock annealing and lightning) as well as radial mixing are more efficient for small grains. For the local production mechanisms this is due to the fact that small grains are more easily heated than large grains. In the radial mixing models this is due to the fact that small grains more easily couple to the gas, and are thus more easily mixed outwards by, for example, turbulent radial mixing. It is, however, unclear if the size dependencies of the various models are strong enough to explain the absence of large crystalline silicate grains in the coma of Hale-Bopp.
5 Conclusions
We have successfully modeled the thermal emission and the degree of linear polarization of radiation scattered by grains in the coma of comet Hale-Bopp. Our method has the following important characteristics relative to previous studies.
-
•
Both grain size and grain shape effects are taken into account in the calculations of the optical properties.
-
•
The parameters of the best fit model are determined using an objective least squares fitting routine.
-
•
The abundances of the chemical elements observed in interplanetary dust particles and meteorites could be used as constraints for the model.
-
•
The resulting model is consistent with the infrared emission spectrum observed in the wavelength range m and with observations of the degree of linear polarization at various phase angles and twelve different wavelengths in the optical to near infrared part of the spectrum.
To model the effects of grain shape on the optical properties, we employed the distribution of hollow spheres. In this distribution we average over the volume fraction occupied by the central vacuum inclusion while preserving the material volume of the particles. We showed that this shape distribution is successful in reproducing the observed properties of cometary grains.
We deduced from the ratios of the strengths of various forsterite features in the observed spectrum of Hale-Bopp that the crystalline silicate grains have a volume equivalent radius m. This is much smaller than the typical grain size of the other dust components and is in agreement with the sizes of the crystalline silicate inclusions found in fluffy interplanetary dust particles. The crystalline inclusions in these grains are predominantly submicron sized (Bradley et al., 1999).
The long wavelength observations showed that most of the mass resides in relatively large grains. The lack of large crystalline silicate grains in our model thus implies that the amount of mass in this component is small. Our best fit model has a relative amount of crystalline silicates that is significantly lower than found in previous studies of the infrared spectrum. If we consider only the grains with a volume equivalent radius smaller than m, the fraction of the total dust mass contained in crystalline silicates is only 7.5%. The fraction of crystalline silicates in the silicate component (both amorphous and crystalline olivine and pyroxene) is 12.5%. This crystallinity can easily be produced by models in which the crystalline silicates are formed close to the Sun by thermal annealing and then mixed outwards to the comet forming region (20-30 AU). The crystallinity derived by us for comet Hale-Bopp is in agreement with these models assuming an approximately nominal model of the protosolar nebula and a formation of the comet at a distance of 30 AU from the Sun. This crystallinity is also in agreement with that found in interplanetary dust particles.
Acknowledgments
It is a pleasure to express our gratitude to M. S. Hanner, C. Dijkstra and L. Kolokolova for enlightening discussions. We are grateful to J. Crovisier for providing us with the reduced data of the LWS spectrum of Hale-Bopp.
References
- Aden and Kerker (1951) Aden, A. L., Kerker, M., 1951. Scattering of electromagnetic waves from two concentric spheres. Journal of Applied Physics 22, 1242–1246.
- Begemann et al. (1994) Begemann, B., Dorschner, J., Henning, T., Mutschke, H., Thamm, E., Mar. 1994. A laboratory approach to the interstellar sulfide dust problem. ApJ 423, L71–L74.
- Bockelée-Morvan et al. (2002) Bockelée-Morvan, D., Gautier, D., Hersant, F., Huré, J.-M., Robert, F., Mar. 2002. Turbulent radial mixing in the solar nebula as the source of crystalline silicates in comets. A&A 384, 1107–1118.
- Bockelée-Morvan et al. (2000) Bockelée-Morvan, D., Lis, D. C., Wink, J. E., Despois, D., Crovisier, J., Bachiller, R., Benford, D. J., Biver, N., Colom, P., Davies, J. K., Gérard, E., Germain, B., Houde, M., Mehringer, D., Moreno, R., Paubert, G., Phillips, T. G., Rauer, H., Jan. 2000. New molecules found in comet C/1995 O1 (Hale-Bopp). Investigating the link between cometary and interstellar material. A&A 353, 1101–1114.
- Bohren and Huffman (1983) Bohren, C. F., Huffman, D. R., 1983. Absorption and scattering of light by small particles. New York: Wiley.
- Bouwman et al. (2003) Bouwman, J., de Koter, A., Dominik, C., Waters, L. B. F. M., Apr. 2003. The origin of crystalline silicates in the Herbig Be star HD 100546 and in comet Hale-Bopp. A&A 401, 577–592.
- Bouwman et al. (2001) Bouwman, J., Meeus, G., de Koter, A., Hony, S., Dominik, C., Waters, L. B. F. M., Sep. 2001. Processing of silicate dust grains in Herbig Ae/Be systems. A&A 375, 950–962.
- Bradley et al. (1983) Bradley, J. P., Brownlee, D. E., Veblen, D. R., Feb. 1983. Pyroxene whiskers and platelets in interplanetary dust - Evidence of vapour phase growth. Nature 301, 473–477.
- Bradley et al. (1999) Bradley, J. P., Snow, T. P., Brownlee, D. E., Hanner, M. S., 1999. Sollid Interstellar Matter: The ISO Revolution. No. 11 in Centre de Physique des Houches. Springer, Berlin, p. 297.
- Brucato et al. (1999) Brucato, J. R., Colangeli, L., Mennella, V., Palumbo, P., Bussoletti, E., Jun. 1999. Silicates in Hale-Bopp: hints from laboratory studies. Planet. Space Sci. 47, 773–779.
- Charbonneau (1995) Charbonneau, P., Dec. 1995. Genetic Algorithms in Astronomy and Astrophysics. ApJS 101, 309–+.
- Crovisier et al. (1997) Crovisier, J., Leech, K., Bockelee-Morvan, D., Brooke, T. Y., Hanner, M. S., Altieri, B., Keller, H. U., Lellouch, E., 1997. The spectrum of Comet Hale-Bopp (C/1995 01) observed with the Infrared Space Observatory at 2.9 AU from the Sun. Science 275, 1904–1907.
- Desch and Cuzzi (2000) Desch, S. J., Cuzzi, J. N., Jan. 2000. The Generation of Lightning in the Solar Nebula. Icarus 143, 87–105.
- Dorschner et al. (1995) Dorschner, J., Begemann, B., Henning, T., Jäger, C., Mutschke, H., Aug. 1995. Steps toward interstellar silicate mineralogy. II. Study of Mg-Fe-silicate glasses of variable composition. A&A 300, 503–+.
- Fabian et al. (2000) Fabian, D., Jäger, C., Henning, T., Dorschner, J., Mutschke, H., Dec. 2000. Steps toward interstellar silicate mineralogy. V. Thermal Evolution of Amorphous Magnesium Silicates and Silica. A&A 364, 282–292.
- Forrest et al. (2004) Forrest, W. J., Sargent, B., Furlan, E., D’Alessio, P., Calvet, N., Hartmann, L., Uchida, K. I., Green, J. D., Watson, D. M., Chen, C. H., Kemper, F., Keller, L. D., Sloan, G. C., Herter, T. L., Brandl, B. R., Houck, J. R., Barry, D. J., Hall, P., Morris, P. W., Najita, J., Myers, P. C., Sep. 2004. Mid-infrared Spectroscopy of Disks around Classical T Tauri Stars. ApJS 154, 443–447.
- Gail (2004) Gail, H.-P., Jan. 2004. Radial mixing in protoplanetary accretion disks. IV. Metamorphosis of the silicate dust complex. A&A 413, 571–591.
- Galdemard et al. (1999) Galdemard, P., Lagage, P. O., Dubreuil, D., Jouan, R., Masse, P., Pantin, E., Bockelée-Morvan, D., 1999. Mid-Infrared Spectro-Imaging Observations Of Comet Hale-Bopp. Earth Moon and Planets 78, 271–277.
- Ganesh et al. (1998) Ganesh, S., Joshi, U. C., Baliyan, K. S., Deshpande, M. R., May 1998. Polarimetric observations of the comet Hale-Bopp. A&AS 129, 489–493.
- Geiss (1987) Geiss, J., Nov. 1987. Composition measurements and the history of cometary matter. A&A 187, 859–866.
- Grevesse and Sauval (1998) Grevesse, N., Sauval, A. J., Aug. 1998. Standard Solar Composition. Space Science Reviews 85, 161–174.
- Hanner et al. (1999) Hanner, M. S., Gehrz, R. D., Harker, D. E., Hayward, T. L., Lynch, D. K., Mason, C. C., Russell, R. W., Williams, D. M., Wooden, D. H., Woodward, C. E., 1999. Thermal Emission from the Dust Coma of Comet Hale-Bopp and the Composition of the Silicate Grains. Earth Moon and Planets 79, 247–264.
- Harker and Desch (2002) Harker, D. E., Desch, S. J., Feb. 2002. Annealing of Silicate Dust by Nebular Shocks at 10 AU. ApJ 565, L109–L112.
- Harker et al. (2002) Harker, D. E., Wooden, D. H., Woodward, C. E., Lisse, C. M., Nov. 2002. Grain Properties of Comet C/1995 O1 (Hale-Bopp). ApJ 580, 579–597.
- Hasegawa et al. (1999) Hasegawa, H., Ichikawa, T., Abe, S., Hamamura, S., Ohnishi, K., Watanabe, J., 1999. Near-Infrared Photometric and Polarimetric Observations Of Comet Hale-Bopp. Earth Moon and Planets 78, 353–358.
- Hayward et al. (2000) Hayward, T. L., Hanner, M. S., Sekanina, Z., Jul. 2000. Thermal Infrared Imaging and Spectroscopy of Comet Hale-Bopp (C/1995 O1). ApJ 538, 428–455.
- Henning et al. (1996) Henning, T., Chan, S. J., Assendorp, R., Aug. 1996. The nature of objects with a 21-m feature. A&A 312, 511–520.
- Irvine et al. (2000) Irvine, W. M., Senay, M., Lovell, A. J., Matthews, H. E., McGonagle, D., Meier, R., Feb. 2000. NOTE: Detection of Nitrogen Sulfide in Comet Hale-Bopp. Icarus 143, 412–414.
- Jäger et al. (1998) Jäger, C., Molster, F. J., Dorschner, J., Henning, T., Mutschke, H., Waters, L. B. F. M., Nov. 1998. Steps toward interstellar silicate mineralogy. IV. The crystalline revolution. A&A 339, 904–916.
- Jewitt and Matthews (1999) Jewitt, D., Matthews, H., Feb. 1999. Particulate Mass Loss from Comet Hale-Bopp. AJ 117, 1056–1062.
- Jockers et al. (1999) Jockers, K., Rosenbush, V. K., Bonev, T., Credner, T., 1999. Images of Polarization and Colour in the Inner Coma of Comet Hale-Bopp. Earth Moon and Planets 78, 373–379.
- Jones and Gehrz (2000) Jones, T. J., Gehrz, R. D., Feb. 2000. Infrared Imaging Polarimetry of Comet C/1995 01 (Hale-Bopp). Icarus 143, 338–346.
- Kahnert et al. (2002) Kahnert, F. M., Stamnes, J. J., Stamnes, K., Jul. 2002. Using simple particle shapes to model the Stokes scattering matrix of ensembles of wavelength-sized particles with complex shapes: possibilities and limitations. Journal of Quantitative Spectroscopy and Radiative Transfer 74, 167–182.
- Kahnert (2004) Kahnert, M., May 2004. Reproducing the optical properties of fine desert dust aerosols using ensembles of simple model particles. Journal of Quantitative Spectroscopy and Radiative Transfer 85, 231–249.
- Kemper et al. (2004) Kemper, F., Vriend, W. J., Tielens, A. G. G. M., Jul. 2004. The Absence of Crystalline Silicates in the Diffuse Interstellar Medium. ApJ 609, 826–837.
- Koike et al. (1993) Koike, C., Shibai, H., Tuchiyama, A., Oct. 1993. Extinction of Olivine and Pyroxene in the Mid Infrared and Far Infrared. MNRAS 264, 654–+.
- Kolokolova et al. (2004) Kolokolova, L., Hanner, M. S., Levasseur-Regourd, A. C., Gustafson, B. Ȧ. S., 2004. Physical properties of cometary dust from light scattering and thermal emission. Comets II. Arizona Press.
- Lellouch et al. (1998) Lellouch, E., Crovisier, J., Lim, T., Bockelee-Morvan, D., Leech, K., Hanner, M. S., Altieri, B., Schmitt, B., Trotta, F., Keller, H. U., Nov. 1998. Evidence for water ice and estimate of dust production rate in comet Hale-Bopp at 2.9 AU from the Sun. A&A 339, L9–L12.
- Li and Draine (2001) Li, A., Draine, B. T., Apr. 2001. On Ultrasmall Silicate Grains in the Diffuse Interstellar Medium. ApJ 550, L213–L217.
- Li and Greenberg (1998) Li, A., Greenberg, J. M., May 1998. From Interstellar Dust to Comets: Infrared Emission from Comet Hale-Bopp (C/1995 O1). ApJ 498, L83–+.
- Li et al. (2002) Li, A., Greenberg, J. M., Zhao, G., Aug. 2002. Modelling the astronomical silicate features - I. On the spectrum subtraction method. MNRAS 334, 840–846.
- Manset and Bastien (2000) Manset, N., Bastien, P., May 2000. Polarimetric Observations of Comets C/1995 O1 Hale-Bopp and C/1996 B2 Hyakutake. Icarus 145, 203–219.
- Mason et al. (2001) Mason, C. G., Gehrz, R. D., Jones, T. J., Woodward, C. E., Hanner, M. S., Williams, D. M., Mar. 2001. Observations of Unusually Small Dust Grains in the Coma of Comet Hale-Bopp C/1995 O1. ApJ 549, 635–646.
- Min et al. (2004) Min, M., Dominik, C., Waters, L. B. F. M., Jan. 2004. Spectroscopic diagnostic for the mineralogy of large dust grains. A&A 413, L35–L38.
- Min et al. (2003) Min, M., Hovenier, J. W., de Koter, A., Jun. 2003. Shape effects in scattering and absorption by randomly oriented particles small compared to the wavelength. A&A 404, 35–46.
- Min et al. (2005) Min, M., Hovenier, J. W., de Koter, A., 2005. Modeling optical properties of cosmic dust grains using a distribution of hollow spheres. A&A 432, 909–920.
- Mishchenko et al. (2002) Mishchenko, M. I., Travis, L. D., Lacis, A. A., 2002. Scattering, Absorption and Emission of Light by Small Particles. Cambridge University Press, Cambridge.
- Molster et al. (1999) Molster, F. J., Waters, L. B. F. M., Trams, N. R., Van Winckel, H., Decin, L., van Loon, J. T., Jäger, C., Henning, T., Käufl, H.-U., de Koter, A., Bouwman, J., Oct. 1999. The composition and nature of the dust shell surrounding the binary AFGL 4106. A&A 350, 163–180.
- Moreno et al. (2003) Moreno, F., Muñoz, O., Vilaplana, R., Molina, A., Sep. 2003. Irregular Particles in Comet C/1995 O1 Hale-Bopp Inferred from its Mid-Infrared Spectrum. ApJ 595, 522–530.
- Pilipp et al. (1998) Pilipp, W., Hartquist, T. W., Morfill, G. E., Levy, E. H., Mar. 1998. Chondrule formation by lightning in the Protosolar Nebula? A&A 331, 121–146.
- Preibisch et al. (1993) Preibisch, T., Ossenkopf, V., Yorke, H. W., Henning, T., Nov. 1993. The influence of ice-coated grains on protostellar spectra. A&A 279, 577–588.
- Servoin and Piriou (1973) Servoin, J. L., Piriou, B., 1973. Infrared reflectivity and Raman scattering of Mg2SiO4 single crystal. Phys. Stat. Sol. (b) 55, 677–686.
- Spitzer and Kleinman (1960) Spitzer, W. G., Kleinman, D. A., 1960. Infrared lattice bands of quartz. Physical Review 121, 1324–1335.
- Toon and Ackerman (1981) Toon, O. B., Ackerman, T. P., Oct. 1981. Algorithms for the calculation of scattering by stratified spheres. Appl. Opt. 20, 3657–3660.
- van Boekel et al. (2004) van Boekel, R., Min, M., Leinert, C., Waters, L. B. F. M., Richichi, A., Chesneau, O., Dominik, C., Jaffe, W., Dutrey, A., Graser, U., Henning, T., de Jong, J., Köhler, R., de Koter, A., Lopez, B., Malbet, F., Morel, S., Paresce, F., Perrin, G., Preibisch, T., Przygodda, F., Schöller, M., Wittkowski, M., Nov. 2004. The building blocks of planets within the ‘terrestrial’ region of protoplanetary disks. Nature 432, 479–482.
- van Boekel et al. (2005) van Boekel, R., Min, M., Waters, L. B. F. M., de Koter, A., Dominik, C., van den Ancker, M. E., Bouwman, J., 2005. A 10m spectroscopic survey of Herbig Ae star disks: grain growth and crystallization. A&A , in press.
- van de Hulst (1957) van de Hulst, H. C., 1957. Light Scattering by Small Particles. Wiley, New York.
- Warren et al. (1994) Warren, J. L., Barret, R. A., Dodson, A. L., Watts, L. A., Zolensky, M. E. (Eds.), 1994. Cosmic Dust Catalog. Vol. 14. NASA Johnson Space Center, Houston.
- Waters et al. (1996) Waters, L. B. F. M., Molster, F. J., de Jong, T., Beintema, D. A., Waelkens, C., Boogert, A. C. A., Boxhoorn, D. R., de Graauw, T., Drapatz, S., Feuchtgruber, H., Genzel, R., Helmich, F. P., Heras, A. M., Huygen, R., Izumiura, H., Justtanont, K., Kester, D. J. M., Kunze, D., Lahuis, F., Lamers, H. J. G. L. M., Leech, K. J., Loup, C., Lutz, D., Morris, P. W., Price, S. D., Roelfsema, P. R., Salama, A., Schaeidt, S. G., Tielens, A. G. G. M., Trams, N. R., Valentijn, E. A., Vandenbussche, B., van den Ancker, M. E., van Dishoeck, E. F., Van Winckel, H., Wesselius, P. R., Young, E. T., Nov. 1996. Mineralogy of oxygen-rich dust shells. A&A 315, L361–L364.
- Wehrstedt and Gail (2002) Wehrstedt, M., Gail, H.-P., Apr. 2002. Radial mixing in protoplanetary accretion disks. II. Time dependent disk models with annealing and carbon combustion. A&A 385, 181–204.
- Weidenschilling (1997) Weidenschilling, S. J., Jun. 1997. The Origin of Comets in the Solar Nebula: A Unified Model. Icarus 127, 290–306.
- Weiler et al. (2003) Weiler, M., Rauer, H., Knollenberg, J., Jorda, L., Helbert, J., May 2003. The dust activity of comet C/1995 O1 (Hale-Bopp) between 3 AU and 13 AU from the Sun. A&A 403, 313–322.
- Wooden (2002) Wooden, D. H., 2002. Comet Grains: Their IR Emission and Their Relation to ISm Grains. Earth Moon and Planets 89, 247–287.
- Wooden et al. (1999) Wooden, D. H., Harker, D. E., Woodward, C. E., Butner, H. M., Koike, C., Witteborn, F. C., McMurtry, C. W., Jun. 1999. Silicate Mineralogy of the Dust in the Inner Coma of Comet C/1995 01 (Hale-Bopp) Pre- and Postperihelion. ApJ 517, 1034–1058.