Dark galaxies or tidal debris? Kinematical clues to the origin of massive isolated HI clouds
Abstract
An extended HI cloud (VIRGOHI 21) with an HI mass of M⊙ and no apparent optical counterpart was recently discovered in the Virgo cluster. In order to understand the origin of physical properties of apparently isolated HI clouds like the VIRGOHI21, we numerically investigate physical properties of tidal HI debris that were formed by galaxy-galaxy interaction in clusters of galaxies. Our hydrodynamical simulations demonstrate that tidal debris with total HI masses of M⊙ can have (1) wide HI velocity widths ( km s-1), (2) a small mass fraction of stars (10%), and (3) a mean -band surface brightness of the stellar components fainter than 30 mag arcsec-2. These results suggest that the VIRGOHI21, which lies at a projected distance of 150 kpc from the one-armed, HI-rich spiral galaxy M99 (NGC 4254), is tidal debris. We propose that the comparison between the simulated and the observed velocity fields of HI clouds allows us to better understand their nature and origin (e.g., whether they are just tidal debris or “dark galaxies” that have HI gas only and are embedded by dark matter halos). We also discuss the timescales for isolated HI gas to be evaporated by thermal conduction of the hot intracluster gas.
keywords:
ISM: clouds — intergalactic medium — radio lines: ISM — galaxies: interaction.1 Introduction
Detections of HI structures without apparent stellar counterparts are not uncommon in the outskirts of galaxies and within galaxy groups. The Galactic high velocity clouds (HVCs) and the prominent HI tidal streams tracing the interaction between the Milky Way and the Magellanic Clouds are the closest examples. Another prime example is the nearby, HI-rich group consisting of the galaxies M 81, M 82, and NGC 3077 which are connected by a beautiful network of HI filaments and streams (Yun et al. 1994). In most cases, the location, structure and velocity field of the apparently star-less HI clouds, with respect to the nearby galaxies, clearly indicates their tidal or collisional origin. Hibbard et al. (2001) show a large number of examples collected as part of the ‘Rogues Gallery of Galaxies’: there are one-sided tidal tails stretching out to 100 kpc (e.g., Appelton et al. 1987, Rots et al. 1990, Clemens et al. 1999), HI rings with 100–200 kpc diameter (e.g., Schneider et al. 1989, Malphrus et al. 1997), etc. On the other hand, isolated HI clouds appear to be extremely rare as shown by the HI Parkes All-Sky Survey (Koribalski et al. 2004). The most isolated HI cloud discovered, HIPASS J0731–69 (Ryder et al. 2001), lies at a projected distance of 180 kpc from the asymmetric spiral galaxy NGC 2442 within the NGC 2434 galaxy group. Bekki et al. (2005) suggested a possible formation scenario that this massive cloud is likely to be the high column density peak of a much larger HI structure.
Davies et al. (2004) recently discovered several HI clouds in the Virgo cluster. At least one of these clouds, VIRGOHI 21 ( km s-1), has no apparent optical counterpart and is, on the basis of its relatively wide HI spectrum, interpreted as a dark matter halo by Minchin et al. (2005). While the projected distance of VIRGOHI 21 to the one-armed spiral galaxy M 99 (NGC 4254, km s-1) may appear large (25′ or 150 kpc at a distance of 20 Mpc), it is by no means exceptional as indicated above. Detailed VLA HI observations of M 99, the brightest spiral in the Virgo cluster, by Phookun et al. (1993) reveal a large amount of gas ( M⊙) at peculiar velocities, stretching at least 11′ toward the northwest (in the direction of VIRGOHI 21) in form of a faint clumpy trail. The total HI mass measured in the M 99 system by Phookun et al. (1993) is M⊙, typical for its morphological type (Sc) and luminosity; the HI mass to light ratio is 0.1. Using HIPASS we measure an HI flux density of Jy km s-1 for M 99 (HIPASS J1218+14), in agreement with the value obtained by Phookun et al. (1993), while the VIRGOHI 21 cloud is too faint for detection. M 99 has the possible dynamical mass of M⊙ and is located in the outskirts of the Virgo cluster, about 3.7 degrees (1.3 Mpc projected distance) northwest of the giant elliptical M 87 and just outside the region of strongest X-ray emission. Minchin et al. (2005) discount tidal origins for the cloud, though the position of the cloud on the outskirts of a large cluster, and the proximity of the HI disturbed spiral NGC 4254 (described above) warrant a closer investigation of the origins of the cloud.
The purpose of this paper is thus to investigate whether the tidal debris scenario is a viable explanation for the apparently isolated massive HI clouds like VIRGOHI21. Based on the numerical simulations on the formation of tidal debris in interacting galaxies in a cluster of galaxies, we particularly discuss (1) whether the observed physical properties of apparently isolated HI clouds, such as wider velocity width ( km s-1) of the clouds and no visible counterparts, can be reproduced by the tidal debris scenario and (2) what are key observations that can discriminate between the two scenarios (i.e., “dark galaxy” vs “tidal debris”). We thus focus on the tidal stripping scenario, though ram pressure stripping can be also associated with the origin of isolated HI clouds (e.g., Vollmer et al. 2005). The present numerical results are discussed in a more general way without comparing the results with observations of specific targets (e.g., VIRGOHI21), though the numerical model is more reasonable for galaxy evolution in the Virgo cluster. The present results therefore can be useful in interpreting the observational results of other (apparently) isolated HI objects such as HIPASS J0731-69 (Ryder et al. 2001).
| (1) | (2) | (3) | (4) | (5) | (6) | (7) | (8) | (9) | (10) |
|---|---|---|---|---|---|---|---|---|---|
| Model no. | ( M⊙) | (kpc) | (degrees) | (kpc) | ( M⊙) | (mag/arcsec2) | (kpc) | ||
| M1 | 0.6 | 22 | 45 | 3 | 350 | 0.17 | 0.14 | 33.4 | 532 |
| M2 | 0.6 | 6 | 45 | 3 | 700 | 0.07 | 0.25 | 33.7 | 171 |
| M3 | 0.6 | 22 | 45 | 3 | 700 | 0.43 | 0.57 | 30.2 | 259 |
| M4 | 6.0 | 18 | 150 | 0.3 | 700 | 0.84 | 0.30 | 30.6 | 310 |
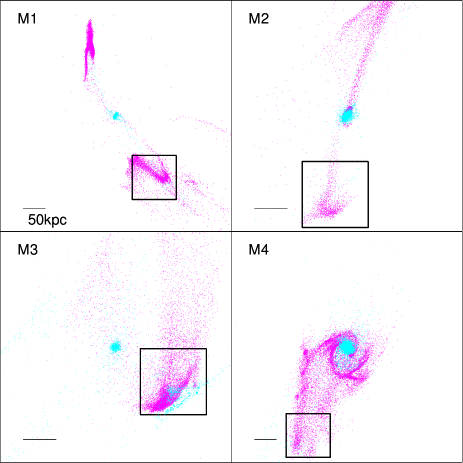
Notes: Cols. (1–6) model parameters, Cols. (7–9) total gas mass, mass fraction of stars, and average -band surface brightness, respectively, within a 100 kpc box as shown in Fig. 1, Col. (10) separation of the two interacting galaxies after 2 Gyrs.
2 The Model
Details on the disk galaxy models and the external gravitational potential of clusters of galaxies adopted in the present study have already been described in Bekki et al. (2005) and Bekki et al. (2003), respectively, so we give only a brief review here. We investigate the dynamical evolution of stellar and gaseous components in an interacting pair of late-type disk galaxies orbiting the center of the Virgo cluster by using TREESPH simulations (Bekki et al. 2002). A late-type disk galaxy with a total mass of , a total disk mass of , and a stellar disk size of is assumed to be embedded in a massive dark matter halo with a universal ‘NFW’ profile (Navarro et al. 1996) with a mass of , and an exponential stellar distribution with a scale length () of . The mass ratio of the dark matter halo to the stellar disk is set to be 9 for all models (i.e., ). The galaxy is assumed to have an extended HI gas disk with an initial size () of , which is consistent with observations (e.g., Broeils & van Woerden 1994). An isothermal equation of state is used for the gas with a sound speed of 5.8 km s-1 (corresponding to 2500 K). The adopted relation for disk models with different masses is described as:
| (1) |
which is consistent both with the observed scaling relation for bright disk galaxies (Freeman 1970) and with the Galactic structural parameters (Binney & Tremaine 1980).
The initial position (, ) and velocity () of two interacting galaxies with respect to the cluster center is described as:
| (2) |
and
| (3) |
respectively, where () are the position (velocity) of the center of mass of an interacting pair with respect to the cluster center and () is the location (velocity) of each galaxy in the pair with respect to their center of mass. and are determined by the orbital eccentricity (), the pericenter distance (), and the mass ratio of the two (). Only one of the two interacting galaxies is modeled as a fully self-consistent disk described above whereas the other is modeled as a point mass with the total mass of . Accordingly, the total mass of a pair in a model is , which corresponds to for the model M1 (See Table 1). The self-consistent disk model is inclined by (degrees) with respect to the orbital plane of the interacting pair.
To give our model a realistic radial density profile for the dark matter halo of the Virgo cluster and thereby determine and , we base our model on both observational studies of the mass of the Virgo cluster (e.g., Tully & Shaya 1984) and the predictions from the standard cold dark matter cosmology (NFW). The NFW profile is described as:
| (4) |
where , , and are the distance from the center of the cluster, the central density, and the scale-length of the dark halo, respectively. The adopted NFW model has a total mass of M⊙ (within the virial radius) and of 161 kpc. The center of the cluster is always set to be (,,) = (0,0,0) whereas is set to be (,,) = (, 0, 0). is set to be (,,) = (0, , 0), where and are the parameters controlling the orbital eccentricity (i.e, the larger is, the more circular the orbit becomes) and the circular velocity of the cluster at = , respectively. The orbital plane of the pair is assumed to be inclined by 30 degrees with respect to the plane for all models. Thus and are the two key parameters for the orbital evolution of the pair. We show the results of the models with and (high-speed, hyperbolic encounters appropriate for cluster galaxy interaction) in the present study.
Although we investigated a large number of models, we only show the results of four representative models which produce relatively isolated gas clouds (i.e., tidal debris) without many stars. The model parameters and the resulting physical properties of the tidal debris are summarized in Table 1: (column 7), (8), (9), and (10) describe the total gas mass within a 100 kpc box within which relatively isolated tidal debris can be seen for each model (see Fig. 1), the mass fraction of stars within the debris, the -band surface brightness of stars averaged over the 100 kpc box, and the distance of two interacting galaxies in each panel of Fig. 1, respectively. The occurrence of single or double tails depends strongly on the orbits and mass ratios. We emphasize the results of M4, because this model suggests that a past interaction between NGC 4254 and a galaxy (that can not be specified in the present study) can be responsible both for the origin of VIRGOHI 21 and for the morphological properties of NGC 4254 (e.g., the strong one-armed spiral structure and the one-sided tidal plume of gas).
The -band mass-to-light ratio (, where is the -band luminosity of a disk) is assumed to be four for estimating the surface brightness of tidal tails and debris. We mainly investigate column density distributions and velocity fields of tidal debris for different viewing angles (), i.e. the angle between the -axis and the line-of-sight that is always within the plane.

3 Results
Fig. 1 summarises the projected mass distributions of stars and gas after 2 Gyr dynamical evolution of interacting galaxies for the four models (M1, M2, M3, and M4). Stars and gas tidally stripped by the galaxy-galaxy interaction (and by the cluster tidal field) can not return back to the host galaxies owing to the stronger cluster tidal field (e.g., Mihos 2004). As a result of this, they form either tidal debris an the tip of the tidal tails or faint ‘tidal bridges’ connecting the host galaxies. The tidal debris can have large HI masses ( M⊙) and be well detached from their host galaxies. The interaction partners have separated ( kpc) from the tidal tails and debris which are then observed as relatively isolated HI clouds.
Tidal stripping is much more efficient in gas than in stars, because, in our model, the initial gas distributions in the disks are two times more extended than the stellar ones. Therefore, the mass fraction of stars can be small ranging from 14% (M1) to 57% (M3) within the ‘isolated HI clouds’ (shown within the box of each model in Fig. 1). Stripped stars can be very diffusely distributed and consequently the mean -band surface brightness () within the 100 kpc box is 33.7 mag arcsec-2 (in model M1). The morphological properties of the gas and stars, the stellar mass fraction, and of the stars in the tidal debris (or ‘isolated HI clouds’) are quite diverse and depend on projections. For example, is 33.7 mag arcsec-2 for model M2 whereas it is 30.2 mag arcsec-2 for model M3. The derived very faint surface brightness suggests that it is almost impossible to detect any optical counterparts of the tidal debris with current large telescopes and reasonable exposure times.
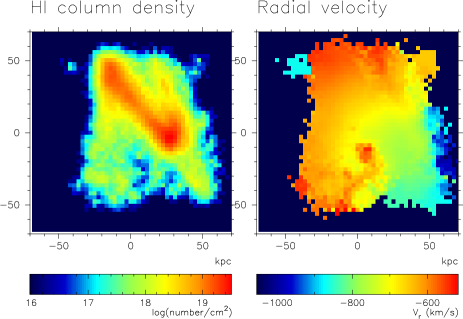
Fig. 2 shows the column density distribution and velocity field of the tidal debris in model M1. It is clear from this figure that (1) the gaseous distribution is quite irregular and inhomogeneous with local column densities ranging from to cm-2, (2) there is a strong velocity gradient between the upper left and the lower right parts of the debris, but the overall velocity field is appreciably irregular, and (3) there is no clear sign of global rotation. Result (1) implies that the observed morphology of the tidal debris depends strongly on the column density limit of the observations.
Fig. 3 shows that the simulated spectra (i.e., the integrated distribution) of the gaseous debris can have a wide velocity range (200 km s-1) for some viewing angles. But unless the gas is shown to be rotating, the velocity width of the HI spectrum alone does not lead to an estimate of the cloud mass. Streaming motions within the tidal debris are responsible for the wide velocity width of the gas in the present models. This kind of wide velocity width in HI gas has been already observed for the relatively isolated massive HI cloud discovered by HIPASS within the NGC 2434 galaxy group (Ryder et al. 2001).
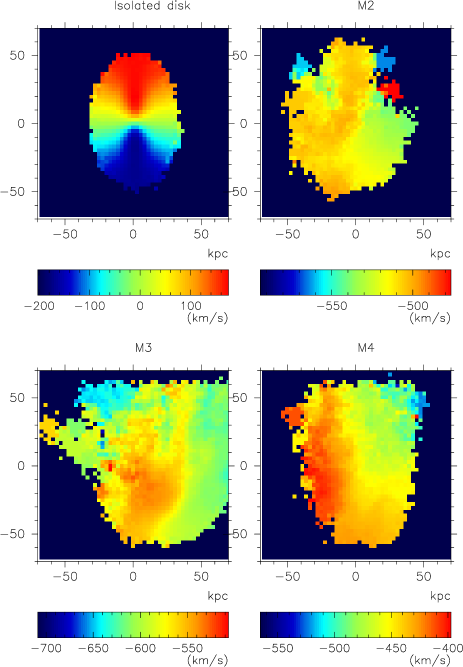
Fig. 4 illustrates how much the simulated velocity fields of the gas in our models differ from that of a regular rotating gas disk. It is a generic result of the present study that the velocity fields of tidal debris do not resemble the typical ‘spider diagrams’ which are characteristic of regular HI kinematics in disk galaxies that are supported by rotation against gravitational fields made by baryonic and dark matter of the galaxies. Velocity fields are the key observational tools to help us determine whether gas clouds are (unbound) tidal debris or a self-gravitating systems embedded within a massive dark matter halo.

4 Discussions and Conclusions
We have shown that tidal debris formed from interacting galaxies in clusters (1) can have a wide velocity width (200 km s-1), (2) show of stars fainter than 30 mag arcsec-2, and (3) are located far from (100 kpc) their progenitors. Our results suggest that the HI cloud VIRGOHI 21 which lies at a distance of 150 kpc from the one-armed spiral M 99 (NGC 4254) is likely to be tidal debris rather than a ‘dark galaxy’. We stress that a detailed kinematical study of the HI gas in the extended region around M 99, and of the region between VIRGOHI 21 and M 99 in particular, is necessary to fully understand the origin of the peculiar HI gas.
If VIRGOHI 21 is indeed tidal debris, how long can it be observed as cold HI gas in the Virgo cluster where it can be easily evaporated by thermal conduction of the hot intracluster gas? Cowie & McKee (1977) investigated the time scale () within which an isolated spherical gas cloud embedded by hot tenuous gas can be evaporated and estimated as:
| (5) |
where , , and are the mean density of a gas cloud, the size of the gas distribution in pc, and the temperature of the surrounding hot gas, respectively. Here the value of the Coulomb logarithm of is assumed to be 30 (Cowie & McKee 1977). Using the present results for model M1, we can estimate as:
| (6) |
where we adopt the reasonable value of 3 keV for the temperature of the hot gas in the central region of the Virgo cluster (e.g., Matsumoto et al. 1996) and use the mean gas density within the 100 kpc box in model M1. varies within the tidal debris, and around gas clouds can also vary depending on the location of the clouds within a cluster owing to the radial gradient (e.g., Matsumoto et al. 1996). We therefore estimate for different and ; the results are shown in Fig. 5. It is clear that low density HI clouds with = to cm-3 can be evaporated by thermal conduction well within yr in cluster environments with = K: these clouds would be difficult to observe in clusters a few Gyr after their formation.
Recently discovered massive HI clouds with no apparent optical counterparts have provided new clues to several problems of extragalactic astronomy such as the origin of HVCs and intergalactic star-forming regions (e.g., Kilborn et al. 2000, Ryder et al. 2001, Ryan-Weber et al. 2004, Kilborn et al. 2005). Although previous numerical studies have tried to reproduce the observed structural properties of relatively isolated HI clouds (e.g., Bekki et al. 2005), they did not discuss the kinematical properties of the clouds extensively. Simulated velocity fields as well as particle/mass distributions are necessary for comparison with the observed gas kinematics in galaxies and surrounding material to better understand galaxy interactions in various environments.
Acknowledgments
KB acknowledges the financial support of the Australian Research Council throughout the course of this work. The numerical simulations reported here were carried out at Australian Partnership for Advanced Computing (APAC).
References
- [1987] Appelton, P.N., Ghigo, F.D., van Gorkom, J.H. et al. 1987, Nature 330, 140
- [2002] Bekki, K., Forbes, D. A., Beasley, M. A., Couch, W. J. 2002, MNRAS 335, 1176
- [2003] Bekki, K., Couch, W. J., Drinkwater, M. J., Shioya, Y. 2003, MNRAS 344, 398
- [2005] Bekki, K., Koribalski, B. S., Ryder, S. D., Couch, W. J. 2005, MNRAS 357, L21
- [1987] Binney, J., & Tremaine, S., 1987 in Galactic Dynamics, Princeton; Princeton Univ. Press.
- [1997] Broeils, A. H., Rhee, M.-H. 1997, A&A 324, 877
- [1999] Clemens, M.S., Baxter, K.M., Alexander, P., Green, D.A. 1999, MNRAS 308, 364
- [1977] Cowie, L. L., McKee, C. F. 1977, ApJ 211, 135
- [2004] Davies, J., Minchin, R., Sabatini, S. et al. 2004, MNRAS 349, 922
- [1970] Freeman, K. C. 1970, ApJ 160, 811
- [2001] Hibbard, J.E., van Gorkom, J.H., Rupen, M.P., Schiminovich, D. 2001, in “Gas & Galaxy Evolution”, ASP Conf. Series, Vol. 240, eds. J.E. Hibbard, M.P. Rupen & J.H. van Gorkom, p. 659
- [1] Kilborn, V. A., Staveley-Smith, L., Marquarding, M. et al. 2000, AJ 120, 1342
- [2] Kilborn, V. A. et al. 2005, in preparation.
- [1997] Malphrus, B.K., Simpson, C.E., Gottesman, S.T., Hawarden, T.G. 1997, AJ 114, 1427
- [3] Matsumoto, H., Koyama, K., Awaki, H., Tomida, H., Tsuru, T., Mushotzky, R., Hatsukade, I. 1996, PASJ 48, 201
- [2004] Mihos, C. 2004, in Clusters of Galaxies: Probes of Cosmological Structure and Galaxy Evolution, Cambridge University Press, Edited by J.S. Mulchaey, A. Dressler, and A. Oemler, p. 278.
- [2005] Minchin, R., et al. 2005, ApJ 622, L21
- [1996] Navarro, J. F., Frenk, C. S., White, S. D. M., 1996, ApJ 462, 563
- [1993] Phookun, B., Vogel, S. N., Mundy, L. G. 1993, ApJ 418, 113
- [1990] Rots, A.H., Bosma, A., van der Hulst, J.M., Athanassoula, E., Crane, P.C. 1990, AJ 100, 387
- [4] Ryan-Weber, E. V., Meurer, G. R., Freeman, K. C. et al. 2004, AJ 127, 1431
- [5] Ryder, S. D., Koribalski, B., Staveley-Smith, L. et al. 2001, ApJ 555, 232
- [6] Schneider, S.E., et al. 1989, AJ 97, 666
- [1984] Tully, R. B., Shaya, E. J. 1984, ApJ 281, 31
- [2005] Vollmer, B., Huchtmeier, W., van Driel, W. 2005, A&A, accepted
- [1994] Yun, M., Ho, P., Lo, K. 1994, Nature 372, 530