Turbulence Statistics from Spectral Line Observations
Abstract
Turbulence is a crucial component of dynamics of astrophysical fluids dynamics, including those of ISM, clusters of galaxies and circumstellar regions. Doppler shifted spectral lines provide a unique source of information on turbulent velocities. We discuss Velocity-Channel Analysis (VCA) and its offspring Velocity Coordinate Spectrum (VCS) that are based on the analytical description of the spectral line statistics. Those techniques are well suited for studies of supersonic turbulence. We stress that a great advantage of VCS is that it does not necessary require good spatial resolution. Addressing the studies of mildly supersonic and subsonic turbulence we discuss the criterion that allows to determine whether Velocity Centroids are dominated by density or velocity. We briefly discuss ways of going beyond power spectra by using of higher order correlations as well as genus analysis. We outline the relation between Spectral Correlation Functions and the statistics available through VCA and VCS.
I Why should we study astrophysical turbulence?
As a rule astrophysical fluids are turbulent and the turbulence is magnetized. This ubiquitous turbulence determines the transport properties of interstellar medium (see Elmegreen & Falgarone 1996, Stutzki 2001, Cho et al. 2003) and intracluster medium (Inogamov & Sunyaev 2003, Sunyaev, Norman & Bryan 2003, see review by Lazarian & Cho 2004a), many properties of Solar and stellar winds, accretion disks etc. One may say that to understand heat conduction, transport and acceleration of cosmic rays, propagation of electromagnetic radiation in different astrophysical environments it is absolutely essential to understand the properties of underlying turbulence. The mysterious processes of star formation (see McKee & Tan 2002, Elmegreen 2002, Pudritz 2001) and interstellar chemistry (see Falgarone 1999 and references therein), shattering and coagulation of dust (see Lazarian & Yan 2003 and references therein) are also intimately related to properties of magnetized compressible turbulence (see reviews by Elmegreen & Scalo 2004).
From the point of view of fluid mechanics astrophysical turbulence is characterized by huge Reynolds numbers, , which is the inverse ratio of the eddy turnover time of a parcel of gas to the time required for viscous forces to slow it appreciably. For we expect gas to be turbulent and this is exactly what we observe in HI (for HI ).
Statistical description is a nearly indispensable strategy when dealing with turbulence. The big advantage of statistical techniques is that they extract underlying regularities of the flow and reject incidental details. Kolmogorov description of unmagnetized incompressible turbulence is a statistical one. For instance it predicts that the difference in velocities at different points in turbulent fluid increases on average with the separation between points as a cubic root of the separation, i.e. . In terms of direction-averaged energy spectrum this gives the famous Kolmogorov scaling , where is a 3D energy spectrum defined as the Fourier transform of the correlation function of velocity fluctuations . Note that in this paper we use to denote averaging procedure.
The example above shows the advantages of the statistical approach to turbulence. For instance, the energy spectrum characterizes how much energy resides at the interval of scales . At large scales which correspond to small wavenumbers ( i.e. ) one expects to observe features reflecting energy injection. At small scales one should see the scales corresponding to sinks of energy. In general, the shape of the spectrum is determined by a complex process of non-linear energy transfer and dissipation. For Kolmogorov turbulence the spectrum over the inertial range, i.e. the range where neither energy injection nor energy dissipation are important, is characterized by a single power law and therefore self-similar. Other types of turbulence, i.e. the turbulence of non-linear waves or the turbulence of shocks, are characterized by different power laws and therefore can be distinguished from the Kolmogorov turbulence of incompressible eddies.
In view of the above it is not surprising that attempts to obtain spectra of interstellar turbulence have been numerous. In fact they date as far back as the 1950s (see von Horner 1951, Munch 1958, Wilson et al. 1959). However, various directions of research achieved various degree of success (see Kaplan & Pickelner 1970, a review by Armstrong, Rickett & Spangler 1995). For instance, studies of turbulence statistics of ionized media were more successful (see Spangler & Gwinn 1990) and provided the information of the statistics of plasma density at scales - cm. This research profited a lot from clear understanding of processes of scintillations and scattering achieved by theorists (see Narayan & Goodman 1989). At the same time the intrinsic limitations of the scincillations technique are due to the limited number of sampling directions, and relevance only to ionized gas at extremely small scales. Moreover, these sort of measurements provide only the density statistics, which is an indirect measure of turbulence.
Velocity statistics is much more coveted turbulence measure. Although, it is clear that Doppler broadened lines are affected by turbulence, recovering of velocity statistics was extremely challenging without an adequate theoretical insight. Indeed, both velocity and density contribute to fluctuations of the intensity in the Position-Position-Velocity (PPV) space.
In this review we concentrate on discussing recent progress in analytical description of the PPV statistics. We mostly discuss power spectra, but also try to look beyond it. Some of the interesting tools, like wavelets or Principal Component Analysis are beyond the scope of this review and will be discussed elsewhere.
II How good are Velocity Centroids?
Let us consider “unnormalized” velocity centroids:
| (1) |
where is the density of emitters in the PPV space* * * Traditionally used centroids include normalization by the integral of . This, however does not substantially improve the statistics, but makes the analytical treatment very involved (Lazarian & Esquivel 2003)..
In the case of emissivity proportional to the first power of density and provided that the turbulent region is thin for its radiation, analytical expressions for structure functions† † † Expressions for the correlation functions are straightforwardly related to those of structure functions (Monin & Yaglom 1975). The statistics of centroids using correlation functions was used in a later paper by Levier (2004). of centroids, i.e. were derived in Lazarian & Esquivel (2003, henceforth LE03). In that paper the following criterion for centroids to reflect the statistics of velocity‡ ‡ ‡ LE03 showed that the solenoidal component of velocity spectral tensor can be obtained from observations using velocity centroids in this regime. was established:
| (2) |
where is the intensity and the velocity dispersion can be obtained using the second moment of the spectral lines:
| (3) |
LE03 proposed to subtract the right hand sight of the expression (2) from the left hand sight of (2) to obtain modified velocity centroids that may still reflect velocity statistics even when ordinary centroids are dominated by density contribution. A numerical study in Esquivel & Lazarian (2005) confirmed that the criterion given by eq (2) is correct and revealed that for MHD turbulence simulations it holds for turbulence with Mach number less than 2. This was consistent with an earlier analysis of a different set of MHD turbulence data by Brunt & Mac Low (2003) who observed that velocity centroids poorly present velocity statistics for high Mach number turbulence. Esquivel & Lazarian (2005) studied modified velocity centroids and the concluded that the velocity centroids was an OK technique to study subsonic turbulence as well as very mildly supersonic turbulence. The modified centroids are better suited for obtaining velocity statistics as the Mach number increased. In addition the aforementioned study has proven using MHD simulations data that an analytical approach employed in LE03 provides a good representation of centroids.
III What is the Velocity Channel Analysis (VCA)?
Power spectra of fluctuations measured within narrow ranges of velocities have been observed by different authors at various times (see Green 1993). Those power spectra were guessed to be related to underlying turbulence, but what exactly those observed spectra mean was completely unclear.
This problem was addressed in Lazarian & Pogosyan (2000, henceforth LP00) who found the relation between the the spectrum of intensity fluctuations in channel maps and underlying spectra of velocity and density. They found that the power index of the intensity fluctuations depends on the thickness of the velocity channel (see Table 1).
| Slice | Shallow 3-D density | Steep 3-D density |
|---|---|---|
| thickness | , | , |
| 2-D intensity spectrum for thin slice | ||
| 2-D intensity spectrum for thick slice | ||
| 2-D intensity spectrum for very thick slice |
thin means that the channel width velocity dispersion at the scale under
study
thick means that the
channel width velocity dispersion at the scale under
study
very thick means that a
substantial part of the velocity profile is integrated over
is the power-law index of velocity structure
function, i.e. .
is a 2D wavevector in the plane of the slice, a 3D wavevector.
It is easy to see that both steep and shallow underlying density the power law index steepens with the increase of velocity slice thickness. In the thickest velocity slices the velocity information is averaged out and it is natural that we get the density spectral index . The velocity fluctuations dominate in thin slices, and the index that characterizes the velocity fluctuations, i.e. , can be obtained using thin velocity slices (see Table 1). Note, that the notion of thin and thick slices depends on a turbulence scale under study and the same slice can be thick for small scale turbulent fluctuations and thin for large scale ones. The formal criterion for the slice to be thick is that the dispersion of turbulent velocities on the scale studied should be less than the velocity slice thickness. Otherwise the slice is thin.
One may notice that the spectrum of intensity in a thin slice gets shallower as the underlying velocity get steeper. To understand this effect let us consider turbulence in incompressible optically thin media. The intensity of emission in a slice of data is proportional to the number of atoms per the velocity interval given by the thickness of the data slice. Thin slice means that the velocity dispersion at the scale of study is larger than the thickness of a slice. The increase of the velocity dispersion at a particular scales means that less and less energy is being emitted within the velocity interval that defines the slice. As the result the image of the eddy gets fainter. In other words, the larger is the dispersion at the scale of the study the less intensity is registered at this scale within the thin slice of spectral data. This means that steep velocity spectra that correspond to the flow with more energy at large scales should produce intensity distribution within thin slice for which the more brightness will be at small scales. This is exactly what our formulae predict for thin slices (see also LP00).
The result above gets obvious when one recalls that the largest intensities within thin slices are expected from the regions that are the least perturbed by velocities. If density variations are also present they modify the result. When the amplitude of density perturbation becomes larger than the mean density, both the statistics of density and velocity are imprinted in thin slices. For small scale asymptotics of thin slices this happens, however, only when the density spectrum is shallow, i.e. dominated by fluctuations at small scales.
Predictions of LP00 were tested in Lazarian et al. (2001) and Esquivel et al. (2003) using numerical MHD simulations of compressible interstellar gas. Simulated data cubes allowed both density and velocity statistics to be measured directly. Then these data cubes were used to produce synthetic spectra which were analyzed using the VCA. As the result, the velocity and density statistics were successfully recovered. Thus one can confidently apply the technique to HI observations. Note, that the VCA is only sensitive to velocity§ § § For Kolmogorov turbulence the velocity gradient scales as . and density gradients on the scale under study, so the regular Galactic rotation curve or large scale distribution of emitting gas does not interfere with the analysis. This was tested in Esquivel et al. (2003). The main formulae of LP00 were also obtained also in Lazarian & Pogosyan (2004) as the limiting case of zero absorption within a more general treatment.
IV What is Velocity Coordinate Spectrum (VCS)?
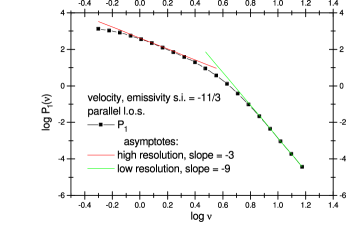
Spatial resolution is essential for centroids and channel maps. However, the velocity fluctuations are also imprinted on the fluctuations of intensity along the velocity coordinate direction. The corresponding 3D PPV spectra were derived in LP00. Table 3 in LP00 states that two terms, one depending only on velocity and the other depending both on velocity and density, contribute to the spectrum measured along velocity coordinate. for steep density the intermediate scaling therefore is ( is negative), while the small scale assymptotics scales as . If the density is shallow the situation is reversed, namely, at larger scales assymptotics dominates, while assymptotics is present at smaller scales. The transition from one assymptotics to another depends on the amplitude of density fluctuations. Therefore both density and velocity statistics can be restored from the observations this way. If the measurements are done with an instrument of poor spatial resolution these are the expected scalings. A further study of these interesting regime is done in Chepurnov & Lazarian (2004), where in addition to the parallel lines of sight, that is a default for LP00 and LP04 studies, the converging lines of sight are taken into account. The latter case is typical for studies of HI at high galactic latitudes. The requirements for the VCS to operate is for the turbulence to be supersonic, for the instrument to have an adequate spectral resolution, and the signal to noise ratio to be high. The latter requirement is due to the necessity of measuring steep spectra along velocity coordinate (in -direction) when the resolution is low.
When the fluctuations are resolved, the velocity coordinate spectrum is more shallow, namely, and (see Table 5 in LP00). As in the previous case, the shallow of the spectra, which depends on the velocity and density indexes and , dominates at the smaller scales. For shallow spectra of intensity the requirement for the signal to noise is less stringent. The transition from one regime to another is shown in Fig. 1.
For the crossing lines of sight geometry the spectrum found in Chepurnov & Lazarian (2005) is not so steep as in the case of parallel lines of sight. Therefore the problem of signal to noise is mitigated for such a study.
Potentially VCS provides a unique technique for studies turbulence in extragalactic objects where the spatial resolution is poor. So far, VCS has been successfully tested with synthetic maps only. This new technique should be applied to the existing and new spectral line datasets.
V What is the effect of Absorption?
The issues of absorption were worrisome for the researchers from the very start of the research in the field (see Munch 1958). The erroneous statements about the effects of absorption on the observed turbulence statistics are widely spread in the literature. For instance, a fallacy that absorption allows to observe density fluctuations localized in the thin surface layers of clouds, i.e. 2D turbulence, exists (see discussion in LP04).
Using transitions that are less affected by absorption, e.g. HI, allows frequently to avoid the problem. However, it looks foolish to disregards the wealth of spectroscopic data only because absorption is present. A study of absorption effects is given in LP04. There it was found that for sufficiently thin slices the scalings obtained in the absence of absorption still hold provided that the absorption on the scales under study is negligible. A similar criterion is valid for the VCS. From the practical point of view, absorption imposes an upper limit on the scales for which the statistics can be recovered.
If integrated intensity of spectral lines is studied in the presence of absorption non-trivial effects emerge. Indeed, for optically thin medium the spectral line integration results in intensity reflecting the density statistics. LP04 showed that this may not be any more true for lines affected by absorption. Depending on the spectral index of velocity and density fluctuations the contributions from either from density or velocity dominate the integrated intensity fluctuations. When velocity is dominant a very interesting regime for which intensity fluctuations show universal behavior, i.e. the power spectrum emerges. If density is dominant, the spectral index of intensity fluctuations is the same as in the case an optically thin cloud. Conditions for these regime as well as for some more interesting intermediate asymptotic regimes are outlined in LP04.
An additional point explained in LP04 is that even in the case of fully integrated spectral lines in the presence of absorption the velocity effects are still modifying the intensity statistics.
VI What do observations tell us?
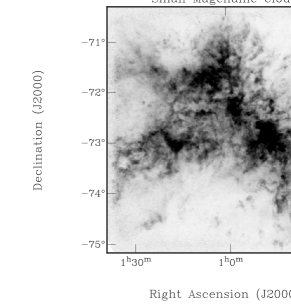
Application of the VCA to the Galactic data in LP00 and to Small Magellanic Cloud in Stanimirovic & Lazarian (2001) revealed spectra of 3D velocity fluctuations consistent with the Kolmogorov scaling. LP00 argued that the same scaling was expected for the magnetized turbulence appealing to the Goldreich-Shridhar (1994) model. Esquivel et al. (2003) used simulations of MHD turbulent flows to show that in spite of the presence of anisotropy caused by magnetic field the expected scaling of fluctuations is Kolmogorov. Studies by Cho& Lazarian (2002, 2003) revealed that the Kolmogorov-type scaling is also expected in the compressible MHD flows. These studies support MHD turbulence model for SMC.

Studies of turbulence are more complicated for the inner parts of the Galaxy, where (a) two distinct regions at different distances from the observer contribute to the emissivity for a given velocity and (b) effects of the absorption are important. However, the analysis in Dickey et al. (2001) showed that some progress may be made even in those unfavorable circumstances. Dickey et al. (2001) found the steepening of the spectral index with the increase of the velocity slice thickness. They also observed the spectral index for strongly absorbing direction approached in accordance with the conclusions in LP04.
21-cm absorption provides another way of probing turbulence on small scales. The absorption depends on the density to temperature ratio , rather than to as in the case of emission. However, in terms of the VCA this change is not important and we still expect to see emissivity index steepening as velocity slice thickness increases, provided that velocity effects are present. In view of this, results of Deshpande et al. (2001), who did not see such steepening, can be interpreted as the evidence of the viscous suppression of turbulence on the scales less than 1 pc. The fluctuations in this case should be due to density and their shallow spectrum may be related to the damped magnetic structures below the viscous cutoff (Cho, Lazarian & Vishniac 2002b).
Studies of velocity statistics using velocity centroids are numerous (see O’Dell 1986, Miesch & Bally 1994, Miesch, Scalo & Bally 1999). The analysis of observational data in Miesch & Bally (1994) provides a range of power-law indexes. Their results obtained with structure functions if translated into spectra are consistent with , where with the standard deviation of . The Kolmogorov index falls into the range of the measured values. L1228 exhibits exactly the Kolmogorov index as the mean value, while other low mass star forming regions L1551 and HH83 exhibit indexes close to those of shocks, i.e. . The giant molecular cloud regions show shallow indexes in the range of (see Miesch et al. 1999). It worth noting that Miesch & Bally (1994) obtained somewhat more shallow indexes that are closer to the Kolmogorov value using autocorrelation functions. Those may be closer to the truth as in the presence of absorption in the center of lines, minimizing the regular velocity used for individual centroids might make the results more reliable. Whether the criterion given by (2) is satisfied for the above data is not clear. If it is not satisfied, which is quite possible as the Mach numbers are large for molecular clouds, then the spectra above reflect the density rather than velocity. If the criterion happen to be satisfied a more careful study taking absorption effects into account is advantageous.
Apart from testing of the particular scaling laws, studies of turbulence statistics should identify sources and injection scales of the turbulence. Is turbulence in molecular clouds a part of a large scale ISM cascade (see Armstrong et al. 1997)? How does the share of the energy within compressible versus incompressible motions vary within the Galactic disk? There are examples of questions that can be answered in future.
VII How to go beyond power spectrum?
(a) Genus Analysis
Velocity and density power spectra do not provide the complete description of turbulence. Intermittency of turbulence (its variations in time and space) and its topology in the presence of different phases are not described by the power spectrum.
“Genus analysis” is a good tool for studying the topology of turbulence (see review by Lazarian 1999), receiving well-deserved recognition for cosmological studies (Gott et al. 1986). Consider an area on the sky with contours of projected density. The 2D genus, , is the difference between the number of regions with a projected density higher than and those with densities lower than . Fig. 3 shows the 2D genus as the function of for a Gaussian distribution of densities (completely symmetric curve), for MHD isothermal simulations with Mach number 2.5, and for HI in SMC.


Isothermal MHD simulations exhibit more or less symmetric density distributions, but the SMC data reflect a prominent Swiss cheese topology, which also can be suggested from the visual inspection of the image (see Fig. 3). However, unlike visual inspection, the genus quantifies the topology and allows us to compare numerical results with observations. Note, that the MHD simulations in Fig 3 are not so different from the SMC in terms of the power spectrum.
(b) She-Leveque exponents
The p-th order (longitudinal) velocity structure function and scaling exponents are defined as
| (4) |
where the angle brackets denote averaging over x.
The scaling relations suggested by She & Leveque (1994) related to the scaling of the velocity , the energy cascade rate , and the co-dimension of the dissipative structures :
| (5) |
For incompressible turbulence these parameters are , , and , implying that dissipation happens over 1D structures (e.g. vortices). Further studies (see Muller & Biskamp (2000), Padoan et al. (2003), Cho, Lazarian & Vishniac (2003)) has shown that the expected exponents can be different for the case of MHD especially for the case of the viscosity-damped regime of turbulence theoretically described in Lazarian, Vishiniac & Cho (2004) and numerically studied in Cho, Lazarian & Vishniac (2002, 2003), Cho & Lazarian (2003).
At present the studies of She-Leveque exponents are inconclusive. Padoan et al. (2003) studied integrated density maps rather than velocity. While the results were compared with a particular model of turbulence dissipation, we would note that the density spectrum was in itself much shallow than the Kolmogorov one for the case studied. The latter is expected to be close to Kolmogorov for the model they compared their observations with. Obtaining the corresponding statistics from observations is potentially possible using modified centroids. A further study of the issue is absolutely essential.
(c) Spectral Correlation Functions
An interesting tool termed “spectral correlation function” or SCF has been recently introduced to the field (Goodman 1999, Rosolowsky et al. 1999, Padoan et al. 2001, Balesteros-Peredes et al. 2002, Padoan, Goodman & Juvela 2003). It compares neighboring spectra with each other. For this purpose the following measure is proposed:
| (6) |
where the function
| (7) |
and the parameters and can be adjusted. One way to choose them is to minimize function. In this case function gets sensitive to similarities in the shape of two profiles. Fixing , or both parameters one can get another 3 function that are also sensitive to similarities in amplitude, velocity offset or to both parameters.
The purpose of those functions is to distinguish regions with various star forming activity and to compare numerical models with observations. To do this histograms of SCF are compared with histograms of SCF obtained for the randomized spatial positions. This allows to models to be distinguished on the basis of their clustering properties. Results reported by Rosolowsky et al. (1999) are encouraging. It was possible to find differences for simulations corresponding to magnetized and unmagnetized media and for those data sets for which an earlier analysis by Falgarone et al. (1994) could not find the difference. It seems feasible to use wavelets that will emphasize some characteristics of the histograms in order to make the distinction quantitative. Construction these wavelets will be the way of “teaching” SCF to extract features that distinguish various sets of data.
A few comments about spectral correlation functions may be relevant. First of all, by its definition it is a flexible tool. In the analysis of Rosolowsky et al. (1999) the SCF were calculated for the subcubes over which the original data was divided. In this way SCF preserves the spatial information and in some sense is similar to cloud-finding algorithms (see Stutzki & Gusten 1990, Williams, de Geus & Blitz 1994). If, however, one fixes the angular separation between the studied spectra and then the technique will be more similar to the traditional correlation function analysis that is sensitive to turbulence scale rather than to positional information. If SCF are applied for the velocity slices they should reproduce the results of VCA (see LP00). The application of the SCF to the data along the velocity coordinate is expected to give a universal , as the power spectra along the velocity coordinate is too steep for correlation functions to reflect it (LP04). This automatically indicates that much care should be used when interpreting SCF that includes -separations.
(d) Anisotropy Analysis
In isotropic turbulence, correlations depend only on the distance between the points. Contours of equal correlation are circular in this case. Presence of magnetic field introduces anisotropy and these contours become elongated with a symmetry axis given by the magnetic field. To study turbulence anisotropy, we can measure contours of equal correlation corresponding to the data within various velocity bins. The results obtained with simulated data are shown in Fig. 3.


Since the anisotropy is related to the magnetic field, the studies of anisotropy can provide means to analyze magnetic fields. It is important to study different data sets and channel maps for the anisotropy. Optical and infrared polarimetry can benchmark the anisotropies in correlation functions. We hope that the anisotropies will reveal magnetic field within dark clouds where grain alignment and therefore polarimetry fails (see Lazarian & Cho 2005, for a review of grain alignment).
VIII Summary
1. A criterion exist that determines whether Velocity Centroids provide a good measure of turbulent velocity. The performance of Velocity Centroids can be improved via using Modified Velocity Centroids, that have a reduced contribution from density fluctuations. Numerical studies show that Velocity Centroids are most reliable at low Mach numbers.
2. Velocity Channel Analysis (VCA) has been tested to be a reliable tool for studies of supersonic interstellar turbulence. Results obtained via VCA reveal Kolmogorov-type turbulence in Milky Way and Small Magellanic Cloud galaxy.
3. Velocity Coordinate Spectrum (VCS) is a new tool for studies supersonic turbulence. It allows to study turbulence even when the spatial resolution is not adequate. This provides a unique way for studies extragalactic turbulence.
4. Absorption modifies results of VCA and VCS. It places upper limits on the scales that can be studied by either of the techniques. It introduces more mixing of velocity and density that results in the statistics of integrated line intensity being not sensitive to underlying density. Nevertheless studies of small scale turbulence are possible with sufficiently thin velocity slices of data.
5. While power spectra is a useful measure of turbulence, it is useful to go beyond it. Studies of topology, anisotropy of turbulence is possible with other tools that we briefly discuss.
ACKNOWLEDGEMENTS This work is supported by the Center for Magnetic Self-Organization in Laboratory and Astrophysical Plasmas. Fruitful discussions with Alexey Chepurnov, Alejandro Esquivel, Shusaku Horibe and Dmitry Pogosyan are acknowledged
REFERENCES
Armstrong, J. W., Rickett, B. J., & Spangler, S. R. 1995, ApJ, 443, 209
Ballesteros-Peredes, J., Vazquez-Semandeni, E., Goodman, A. 2002, ApJ, 571, 334
Brunt, C.M., Mac Low, M.M. 2004, ApJ, 604, 196
Chepurnov, A. & Lazarian, A. 2005, ApJ, submitted
Cho, J., Lazarian, A. 2002, Phy. Rev. Lett., 88, 245001 (CL02)
Cho, J., Lazarian, A. 2003a, MNRAS, 345, 325
Cho, J., Lazarian, A., Honein, A., Knaepen, B., Kassinos, S., & Moin, P. 2003, ApJ, 589, L77
Cho, J., Lazarian, A., & Vishniac, E. 2002a, ApJ, 564, 291
Cho, J., Lazarian, A., & Vishniac, E. 2002b, ApJ, 566, L49
Cho, J., Lazarian, A., & Vishniac, E. 2003b, ApJ, 595, 812
Deshpande, A.A., Dwarakanath, K.S., Goss, W.M., 2000, ApJ, 543, 227
Elmegreen, B. 2002, ApJ, 577, 206
Elmegreen, B. & Falgarone, E. 1996, ApJ, 471, 816
Elmegreen, B. & Scalo, J. 2004, ARA&A, 42, 211
Esquivel, A. & Lazarian, A. 2004, ApJ, submitted
Esquivel A., Lazarian A., Pogosyan D., & Cho J. 2003, MNRAS, 342, 325
Falgarone, E. 1999, in Interstellar Turbulence, ed. by J. Franco, A. Carraminana, CUP, (henceforth Interstellar Turbulence) p.132
Falgarone, E., Lis, D. C., Phillips, T. G., Pouquet, A., Porter, D. H., Woodward, P. R. 1994, ApJ, 436, 728
Falgarone, E., Panis, J.-F., Heithausen, A., Perault, M., Stutzki, J., Puget, J.-L., Bensch, F. 1998, A& A, 331, 669
Falgarone, E, & Puget, J.-L. 1995, A& A, 293, 840
Falgarone, E., Pineau des Forets, G., & Roueff, E. 1995, A&A, 300, 870
Goldreich, P. & Sridhar, S. 1995, ApJ, 438, 763
Gott, J.R., Melott, A.L., & Dickinson, M. 1986, ApJ, 306, 341
Green, D.A. 1993 MNRAS, 262, 328
von Horner, S. 1951, Zs.F. Ap., 30, 17
Inogamov, N.A. & Sunyaev, R.A. 2003, Astronomy Letters, 29, 791.
Kolmogorov, A. 1941, Dokl. Akad. Nauk SSSR, 31, 538
Kaplan, S.A. & Pickelner, S.B. 1970
Lazarian, A. 1999b, Statistics of Turbulence from Spectral-Line Data Cubes, in Plasma Turbulence and Energetic Particles, ed. M. Ostrowski and R. Schlickeiser, Cracow, 28, astro-ph/0001001
Lazarian, A. & Cho, J. 2005, astro-ph/0408174
Lazarian, A. & Cho, J. 2004, Ap&SS, 289, 307
Lazarian, A. & Esquivel, E. 2003, ApJ, 592, L37 (LE03)
Lazarian, A. & Pogosyan, D. 2000, ApJ, 537, 720 (LP00)
Lazarian, A. & Pogosyan, D. 2004, ApJ, 616, 943 (LP04)
Lazarian, A. & Pogosyan, D., & Esquivel, A. 2002, in Seeing Through the Dust, ASP Conf. Proc. Vol 276, eds by A. R. Taylor et al. (San Francisco), p. 182
Lazarian, A. & Pogosyan, D., Vazquez-Semadeni, E., & Pichardo, B. 2001, ApJ, 555, 130
Lazarian, A., Vishniac, E., & Cho, J. 2004, ApJ, 603, 180
Lazarian, A. & Yan, H. 2004, in “Astrophysical Dust” eds. A. Witt & B. Draine, APS, V. 309, p.479
Levier, F. 2004, A& A, 421, 387
McKee, Christopher F.; Tan, Jonathan C. 2002, Nature, 416, 59
Miesch, M.S., & Bally, J. 1994, ApJ, 429, 645
Miesch, M. S., Scalo, J., & Bally, J. 1999, ApJ, 429, 645
Miville-Deschenes, M.A., Levrier, F., & Falgarone, E. 2003, ApJ, in press,
Miville-Deschenes, M.A., Joncas, G., Falgarone, E., & F. Boulanger, 2003, A&A, in press, astro-ph/0306570
Monin, A.S., & Yaglom, A.M. 1975, Statistical Fluid Mechanics: Mechanics of Turbulence, vol. 2, The MIT Press
Müller, W.-C. & Biskamp, D. 2000, Phys. Rev. Lett., 84(3), 475
Narayan, R., & Goodman, J. 1989, MNRAS, 238, 963
Munch, G. 1958, Rev. Mod. Phys., 30, 1035
O’Dell, C.R. 1986, ApJ, 304, 767
Ossenkopf, V. & Mac Low, M.-M. 2002, A&A, 390, 307
Padoan, P., Boldyrev, S., Langer, W., & Nordlund, A. 2003, ApJ, 583, 308
Padoan, P., Goodman, A.A., Juvela, M. 2003, ApJ, 588, 881
Padoan, P., Rosolowsky, E.W, Goodman, A.A. 2001, ApJ, 547, 862
Pudritz, R. E. 2001, From Darkness to Light: Origin and Evolution of Young Stellar Clusters, ASP , Vol. 243. Eds T. Montmerle and P. Andre. San Francisco, p.3
Rosolowsky, E.W., Goodman, A.A., Wilner, D.J., & Williams, J.P. 1999, ApJ, 524, 887
Stutzki, J. 2001, Astrophysics and Space Science Supplement, 277, 39
Stutzki, J., & Gusten, R. 1990, ApJ, 356, 513
Stanimirovic, S. & Lazarian, A. 2001, ApJ, 551, L53
Spangler, S.R., & Gwinn, C.R. 1990, ApJ, 353, L29
Sunyaev, R.A., Norman, M.L., & Bryan, G.L. 2003, Astronomy Letters, 29, 783.
Wilson, O.C., Munch, G., Flather, E.M., & Coffeen, M.F. 1959, ApJS, 4, 199