Elastic -scattering of 112Sn and 124Sn at astrophysically relevant energies
Abstract
The cross sections for the elastic scattering reactions 112,124Sn(,)112,124Sn at energies above and below the Coulomb barrier are presented and compared to predictions for global –nucleus potentials. The high precision of the new data allows a study of the global –nucleus potentials at both the proton and neutron-rich sides of an isotopic chain. In addition, local –nucleus potentials have been extracted for both nuclei, and used to reproduce elastic scattering data at higher energies. Predictions from the capture cross section of the reaction 112Sn(,)116Te at astrophysically relevant energies are presented and compared to experimental data.
pacs:
24.10.Ht, 25.55.-e, 25.55.Ci, 26.30.+kI Introduction
The 35 most proton-rich, stable isotopes between Se and Hg are called p nuclei. Contrary to the synthesis of most nuclei above Fe through neutron captures in the s and r process Burbidge et al. (1957), the production of the p nuclei proceeds mainly via photon–induced reactions at temperatures around a few GK Woosley and Howard (1978); Langanke and Wiescher (2001). Seed nuclei already present in the stellar plasma and originating from the s and r process are disintegrated mainly by (,n), (,p) and (,) reactions in the thermal photon bath of the corresponding explosive astrophysical event. Due to persisting problems in the reproduction of the observed p abundances, a definite conclusion on the actual site of this nucleosynthesis process – usually called p or process – cannot be drawn yet, however, the commonly most favored site providing the required conditions is explosive Ne/O burning in type II supernovae Woosley and Howard (1978); Rauscher et al. (2002); Arnould and Goriely (2003). Recently, consistent studies of p nucleosynthesis have become available, employing theoretical reaction rates in large reaction networks Arnould and Goriely (2003); Rauscher et al. (2002); Costa et al. (2000). For heavy nuclei (140 200), (,n) and (,) reactions play the dominant role while other photon-induced reactions are practically negligible. This is not the case for lighter nuclei where captures and photodisintegrations involving neutrons, protons, and particles have to be considered Rapp (2004a); Rauscher (2005). Finally, neutrino-induced reactions may have some importance for selected isotopes because of the high neutrino-flux stemming from the core collapse triggering the type II supernova explosion Arnould and Goriely (2003); Rauscher et al. (2002).
The cross sections used to calculate the required astrophysical reaction rates in network studies are based on the statistical model (Hauser-Feshbach) Hauser and Feshbach (1952); Rauscher and Thielemann (1998); Goriely (2000); Rauscher and Thielemann (2001, 2004). Global optical potentials are considered in these calculations encompassing many hundreds of nuclei and several thousand reactions. Experimental data is scarce due to the sub-Coulomb energies and the large number of unstable nuclei relevant for astrophysical applications. Only recently, a number of experiments has been devoted to the study of cross sections at astrophysically relevant energies. However, there is still a lack of relevant experimental data for (,) and (,) reactions because of the high Coulomb barriers. Recent capture experiments on heavy nuclei at astrophysically relevant energies were performed on 70Ge Fülöp et al. (1996), 96Ru Rapp et al. (2002), 112Sn Özkan et al. (2002) and 144Sm Somorjai et al. (1998). No experimental data for (,) cross sections are available at astrophysically interesting energies.
In general, (,) and (,) reaction cross sections are very sensitive to the choice of the –nucleus potential, as has been observed in the huge uncertainties for the prediction of the 144Sm(,)148Gd cross section Somorjai et al. (1998); Mohr et al. (1997); Rauscher et al. (1995). Elastic scattering at low energies (close to the Coulomb barrier) should provide an additional test for the –nucleus potentials considered in p process network calculations. High precision data are needed for a clear determination of the optical potential properties at the measured energies.
In this work the cross sections for the reactions 112,124Sn(,)112,124Sn at energies above and below the Coulomb barrier are presented. The new experimental data provide a test for the global parameterizations considered in p process network calculations. Furthermore, the study of both proton- and neutron-rich stable tin isotopes provides important information about the variation of –nucleus potentials along an isotopic chain. A local –nucleus potential is derived for both neutron–deficient (112Sn) and neutron–rich (124Sn) nuclei.
In this paper we first present the experimental procedure (Sec. II) and compare the results to existing global –nucleus potentials (Sec. III.1). The determination of the potential for the tin isotopes is performed within the Optical Model (OM) framework (Sec. III.2), and the results are compared to previous experimental data (Secs. III.3–D). In addition, the derived potential for 112Sn is used for a prediction of the 112Sn(,)116Te cross section which has been recently measured using the activation technique Özkan et al. (2002) (Sec. IV).
II Experimental procedure and results
The scattering experiments were performed at the cyclotron laboratory of ATOMKI, Debrecen, Hungary, where 4He2+ beams are available up to energies of about = 20 MeV. Angular distributions were measured for 112Sn at = 19.5 MeV and 14.4 MeV, and for 124Sn at = 19.5 MeV. The beam intensity was approximately 300 nA. The experimental setup was similar to the one used in our previous experiments on 144Sm Mohr et al. (1997) and 92Mo Fülöp et al. (2001). Further experimental details on the setup can be found in Máté et al. (1989). Here we briefly summarize the most important features of the setup.
The angular distributions were measured using four silicon surface-barrier detectors mounted on two turntables. The solid angles varied between sr and sr. Two additional detectors placed at left and right to the incoming beam axis with solid angles of sr are used to normalize the angular distributions and to determine the beam position on the target with high precision. Note that small horizontal deviations of about 1 mm lead to corrections of the cross section of the order of 1 % at very forward angles. These corrections can be precisely determined from the ratio of the count rates in the two monitor detectors.
The targets consisted of highly enriched 112Sn (99.6 %) and 124Sn (97.4 %) deposited onto thin carbon backings. The target thicknesses of 200 g/cm2 for both isotopes were confirmed by the measured Rutherford cross sections during the experiment. The absolute normalization was obtained from the Rutherford cross section at very forward angles Mohr et al. (1997); Fülöp et al. (2001).
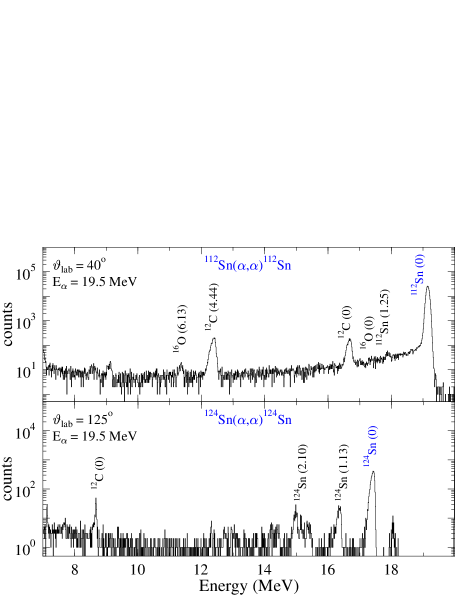
A precise dead time correction is necessary especially at forward angles where the cross sections are huge. Therefore, the dead time was monitored using pulse generators in all spectra. Typical spectra of the 112Sn(,)112Sn and 124Sn(,)124Sn reactions are shown in Fig. 1.
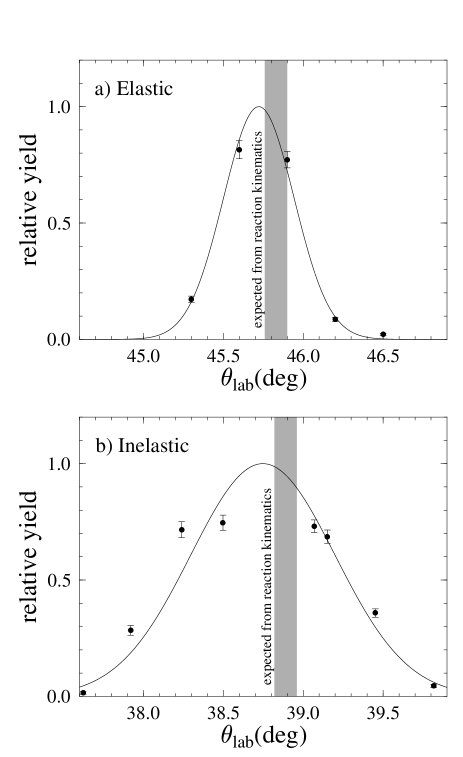
From a kinematic coincidence between the particles scattered on a 20 g/cm2 carbon backing foil and the 12C recoil nuclei, we calibrated the position of the silicon detectors with a precision of = 0.07∘. The scattered particles were measured using one detector placed at = 70∘ (right side relative to beam axis). The recoil 12C nuclei from the elastic (12Cgs) and inelastic (12C, Ex=4.44 MeV) scattering were measured with another detector (left side) which was moved around the expected positions, = 45.83∘ and = 38.89∘. The results are shown in Fig. 2. The maximum recoil rate is observed at the expected position within the statistical uncertainties.
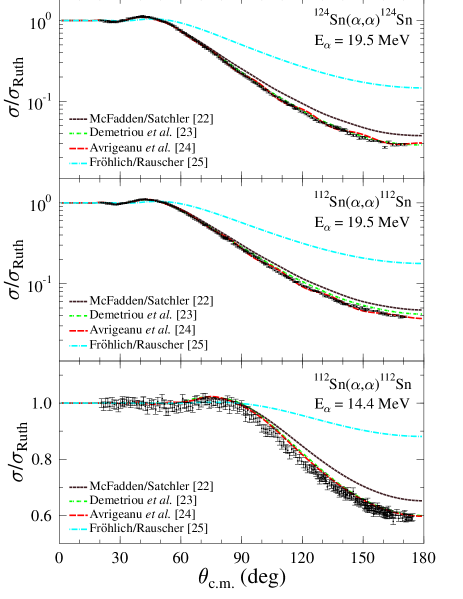
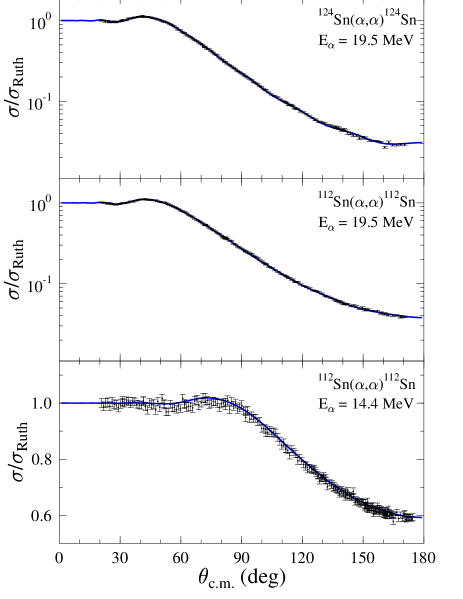
From the yield in the elastic peaks, the elastic scattering cross section is calculated. The data is normalized to the Rutherford cross section of point-like charged particles. The experimental results are shown in Fig. 3. Note that the measured cross sections cover more than four orders of magnitude in the whole angular range. Nevertheless, typical uncertainties remain below 3–4 % for all measured data points, including systematic and statistical uncertainties.
III Optical model analysis
III.1 Angular distributions: comparison to theory
The theoretical analysis of the angular distributions is performed within the OM framework. The elastic scattering cross section can be calculated from the Schrödinger equation with the complex nuclear potential given by
| (1) |
with the Coulomb potential , the real part , and the imaginary part of the nuclear potential.
The calculated differential cross sections for four different global –nucleus potentials are also presented in Fig. 3. The four–parameter Woods-Saxon potential from McFadden and Satchler McFadden and Satchler (1966) provides a rough description of the experimental data, overestimating the cross section in all three cases for backward angles. Potential I from Demetriou et al. Demetriou et al. (2002) presents a good reproduction of the measured angular distributions, with a slight overestimation of the scattering cross sections at backward angles for the reaction 112Sn(,)112Sn at Eα = 19.5 MeV. This potential, based on a double folding parameterization in its real part and a volume Woods-Saxon potential in its imaginary part, provides a good description of previous (,), (,n) and (,) cross section data.
The potential of Avrigeanu et al. Avrigeanu et al. (2003), resulting from the investigation of scattering data at energies around the Coulomb barrier for 100 nuclei, is also compared to the measured angular distributions. The potential is consistent with the experimental data, although the corresponding cross section presents a diffraction pattern at backward angles which is not observed in the measured data. Finally, the potential presented by Fröhlich and Rauscher Rauscher (2003), overestimates the cross section in all cases. This potential is an expansion of the McFadden and Satchler’s potential to include (,n) and (,) cross section data at energies close to the astrophysically relevant region.
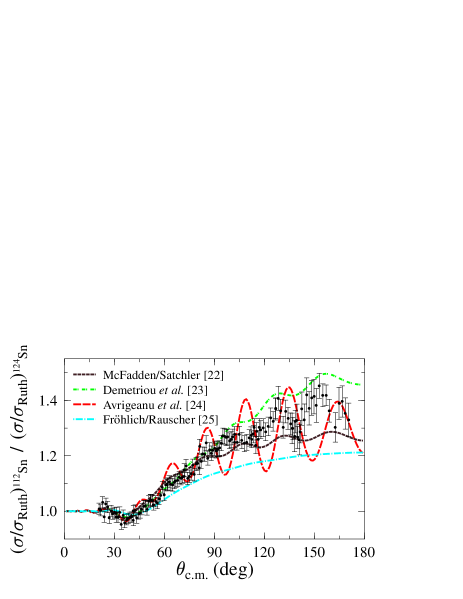
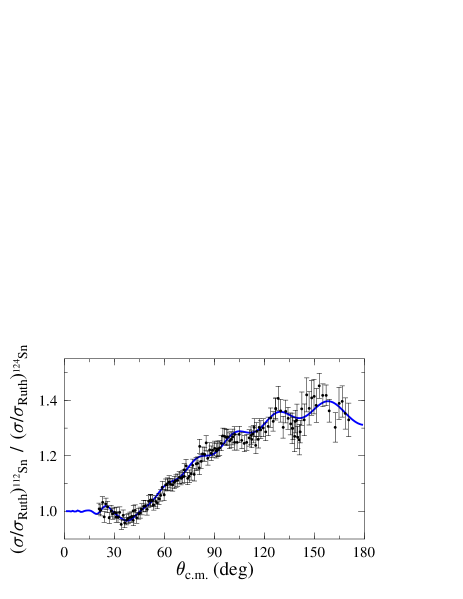
The depiction of the scattering cross section given by the different global potentials (Fig. 3) makes very difficult to state which potential provides the correct description of the experimental data. A global –nucleus potential must be able to describe the scattering cross section data along an isotopic chain, in order to demonstrate its reliability when extrapolating to unstable nuclei of interest for astrophysical applications. Despite the striking qualitative similarities, the elastic scattering cross sections of 112Sn and 124Sn at Eα = 19.5 MeV differ by roughly 30% at very backward angles. In Fig. 4, which shows the ratio of the two cross sections (divided by the Rutherford cross section) as a function of angle, all global –nucleus potentials of McFadden and Satchler (1966); Demetriou et al. (2002); Avrigeanu et al. (2003); Rauscher (2003) fail to reproduce either the strength or the oscillation pattern for backward angles. Thus, the use of these potentials in the extrapolation to more proton–rich species (of interest in p process nucleosynthesis) should be questioned.
The following section studies the angular distributions, extracting a local optical potential from the experimental data available.
III.2 Angular distributions: present experiment
In the present analysis, the real part of the potential is derived from a double-folding procedure with two adjustable parameters:
| (2) |
where is the double-folding potential which is calculated according to Kobos et al. (1984); Satchler and Love (1979); Abele and Staudt (1993); Atzrott et al. (1996) using the computer code DFOLD. The required density distributions of the particle and the 112,124Sn nuclei were derived from measured charge density distributions de Vries et al. (1987). We vary the strength of the double-folding potential by the parameter , adopting values around 1.2 and 1.4 (similar to previous works Atzrott et al. (1996); Mohr et al. (1997); Fülöp et al. (2001)). This reduces the so-called family problem of –nucleus potentials at low energies (see Refs. Mohr et al. (1997); Fülöp et al. (2001) for detailed discussion). The width of the potential is adjusted using the parameter width . We find values close to 1 for our data.
The different optical potentials can be compared through their total strengths or volume integrals, normalized to the number of interacting nucleon pairs (), defined for both real and imaginary parts of the nuclear potential:
| (3) | |||||
| (4) |
Both volume integrals are negative. In this work, we will only consider their absolute values.
The strength parameter has been adopted to take the linear form
| (5) |
where is the volume integral of the double folding potential . The values for the parameters , and , as extracted from the scattering data, are listed in Table 1. The linear energy dependence adopted for 112Sn has been applied also for 124Sn , although we have measurements for only one energy for this nucleus. We check the validity of this linear dependence in Sect. III.3, by analyzing the scattering data at higher energies. The parameter allows a fine-tuning of the potential width; it remains very close to unity. A significant deviation of from unity for stable nuclei, where the neutron and proton densities are very similar, would indicate that the nucleon-nucleon interaction is not well chosen. However, for nuclei with extremely high neutron-to-proton ratio one may expect the formation of neutron skins; in this case, such a deviation of from unity should be found for nucleon density distributions derived from the proton density only.
| Isotope | |||||||||||
|---|---|---|---|---|---|---|---|---|---|---|---|
| (MeVfm3) | (fm3) | (MeVfm3) | (MeV) | (fm) | (fm) | (MeV) | (fm) | (fm) | (MeVfm3) | ||
| 112Sn | 352.92 | -0.652 | 277.85 | 1.004 | -3.137 | 1.737 | 0.341 | 356.36 | 1.252 | 0.218 | 97.16 |
| 124Sn | 355.12 | -0.652 | 274.90 | 1.006 | -2.467 | 1.723 | 0.296 | 212.22 | 1.230 | 0.299 | 74.29 |
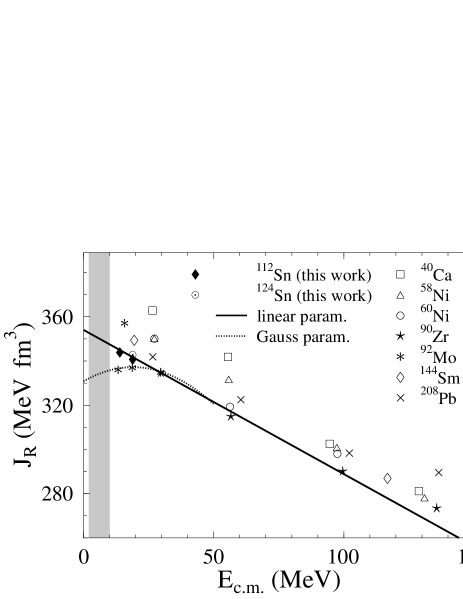
The volume integral for the real part of the nuclear potential adopted for the tin isotopes are shown in Figure 5, together with the values derived from the analysis of elastic scattering data on several doubly-magic and semi-magic nuclei in the energy range up to 140 MeV Atzrott et al. (1996); Mohr et al. (1997); Fülöp et al. (2001). The data show a systematic smooth linear decrease at higher energies, in good agreement with the parameterization adopted for the 112Sn and 124Sn isotopes (solid line). The Gaussian parameterization, first suggested by Mohr (2000) and modified in Fülöp et al. (2001); Demetriou et al. (2002), is shown as a dotted line up to 50 MeV, which they proposed for astrophysical energies.
The imaginary part of the nuclear potential has been chosen as a sum of volume and surface Woods-Saxon potentials. The potential parameters (potential depth , radius and diffuseness , with =V,S) are listed in Table 1. The relative weight between the volume and the surface terms of the imaginary part of the nuclear potential is = 0.22 , as found in a study of the elastic scattering data in the 100 mass region Galaviz (2004). This dominance of the surface Woods-Saxon term at energies close to the Coulomb barrier provides a better description of capture data at the astrophysically interesting energy window Rauscher (1998).
The results of the OM analysis are compared in Fig. 6 to the experimental data from the three measured angular distributions. An excellent agreement is observed. An average value of = 1.1 results from the analysis. Unlike other potentials, the ratio of the cross sections for the tin isotopes is reproduced with higher accuracy, as shown in Fig. 7.
In order to test the reliability of the obtained optical potentials, and observe its possible energy dependence, the following section compares the results of the OM analysis to other elastic scattering data measured at higher energies.
III.3 Angular distributions: comparison to other experiments
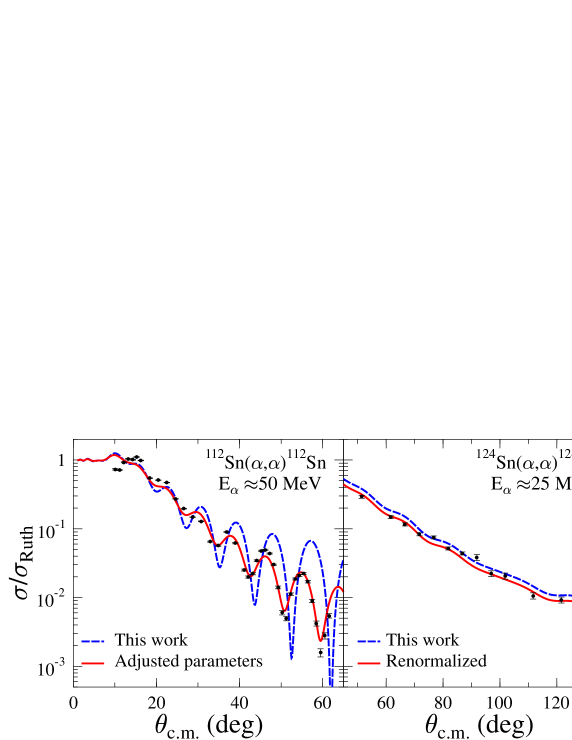
The angular distribution of elastically scattered particles on the tin isotopes 112Sn Burtebaev et al. (1990) and 124Sn Bespalova et al. (1992) has been measured at energies far above the Coulomb barrier. These data are shown in Fig. 8 for the reactions 112Sn(,)112Sn at E 50 MeV (left part of the Figure) and 124Sn(,)124Sn at E 25 MeV (right part of the Figure). In addition, the predictions from the optical potentials derived from the analysis of our elastic scattering data are shown.
The reproduction of the data from the reaction 124Sn(,)124Sn Bespalova et al. (1992) is satisfactory. The diffraction pattern shown by the experimental data from the reaction 112Sn(,)112Sn Burtebaev et al. (1990), measured at energies far above from the Coulomb barrier, is not described well. However, a minor variation of the potential parameters (solid line) in which the contribution of the volume term to the imaginary part of the nuclear potential is increased (= 0.79 ) provides an improved description of the scattering data from Burtebaev et al. (1990). In the case of the scattering data from Bespalova et al. (1992), closer to the energy region measured in this work, a renormalization of the scattering data with a factor of 1.2 would provide a better agreement between the experimental data and the calculated cross section.
From this analysis, the imaginary part of the nuclear potential shows a stronger energy dependence at energies higher than those considered in this work. Without more experimental data for the nuclei studied, it is not possible to predict the possible energy dependence of both terms in the imaginary part of the nuclear potential.
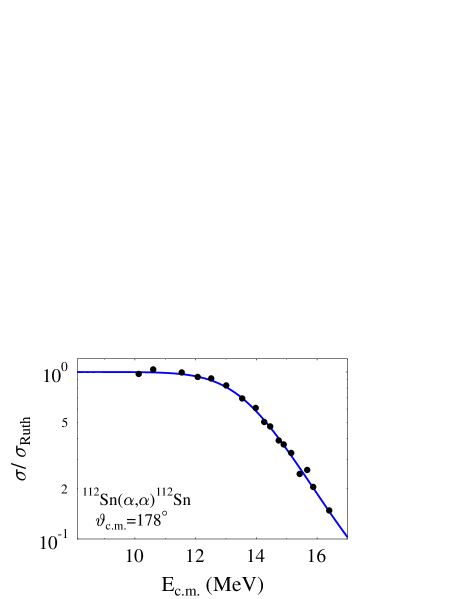
III.4 Excitation function: comparison to other experiments
The excitation function of the elastically scattered particles on the nucleus 112Sn at very backward angles ( = 178∘) was measured by Badawy et al. Badawy et al. (1978) at different energies below and above the Coulomb barrier. The experimental data are shown in Fig. 9. The successful reproduction of the experimental data confirms the good knowledge of the –nucleus potential (solid line) in the considered energy region.
IV The 112Sn(,)116Te reaction
A relevant test of the potentials for astrophysical purposes consists of the reproduction of the (,) reaction cross sections at energies close to the Gamow window. In this section, the main features of the statistical model are presented, followed by a comparison of existing experimental data from the reaction 112Sn(,)116Te to the predictions from the different –nucleus potentials.
The main ingredients of the statistical model (Hauser-Feshbach approach) Hauser and Feshbach (1952) in the calculation of reaction rates under astrophysical conditions are transmission coefficients (particle and radiative), nuclear level densities and optical potentials Rauscher and Thielemann (2000). These elements allow the calculation of the reaction cross section in astrophysical scenarios. Once is calculated, considering the case of the capture reaction, the reaction rate per particle pair at a given stellar temperature is defined by Rauscher and Thielemann (2000):
| (6) |
by folding the stellar reaction cross section with the Maxwell-Boltzmann velocity distribution of the incident particles. is the reduced mass of the system. In a stellar plasma, nuclei are in thermal equilibrium with the environment and therefore can be found also in excited states. The stellar reaction cross section includes transitions from all populated target states to all energetically reachable final states whereas a laboratory cross section only accounts for transitions from the ground state of the target. However, for the case of 112Sn(,) the stellar enhancement is negligible in the p process temperature range because no low-lying excited states in 112Sn are available for population. The product in the integrand of Eq. 6 leads to a maximum, defining an effective energy window (the so-called Gamow window) where most of the reactions occur. The reaction cross section should be determined in this energy region. The photo-disintegration rate is then derived from the capture rate applying detailed balance (see e.g. Rauscher and Thielemann (2000)).
During p process nucleosynthesis, typical temperatures of 2.0 3.0 are reached (where is the temperature in GK). This corresponds to an energy window between 5.1 and 9.6 MeV for the capture reaction, or between 4.2 and 8.7 MeV for the photon-induced (,) reaction (Te) = 930 keV) Mohr et al. (2003).
Due to the astrophysical interest, the laboratory (,) reaction cross section on the nucleus 112Sn has been measured Özkan et al. (2002) at energies close to the Gamow window. The astrophysical S-factor of the reaction 112Sn(,)116Te is shown in Fig. 10. In addition, the predictions from the global –nucleus potentials and the optical potential derived in this work are also plotted. Because of the scarce experimental data available on the 112Sn(,)116Te reaction, we can only perform a very limited comparison.
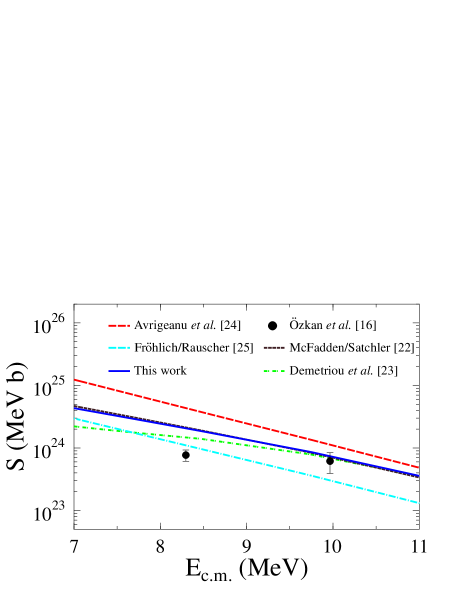
The global parameterization from Rauscher (2003) provides a satisfactory description of the few experimental data, in contrast to its poor agreement with the elastic scattering data. The other potentials, with the exception of Avrigeanu et al. (2003), reproduce the cross section data well. The potential obtained from the analysis of the elastic scattering data presented in this work (Sec. III.2) provides a satisfactory description of the (,) data, very similar to that of McFadden and Satchler (1966). However, further capture experiments on the nucleus 112Sn should be performed in order to cover the whole Gamow window. Experiments are under way Rapp (2004b). These data should help to determine the experimental energy dependence of the astrophysical S-factor.
As mentioned, once the astrophysical (,) capture cross section has been calculated, it is possible to derive the corresponding astrophysical capture and photo-disintegration rates Rauscher and Thielemann (2001, 2000). For a comparison of the results provided by the different parameterizations of McFadden and Satchler (1966); Demetriou et al. (2002); Avrigeanu et al. (2003); Rauscher (2003), the variation of the obtained reaction rates is shown in Table 2, where the ratios of rates with respect to the rate obtained using Rauscher (2003) are presented. All other ingredients of the statistical model calculations have been kept fixed as in Rauscher and Thielemann (2000).
| McFadden and Satchler (1966) | Demetriou et al. (2002) | Avrigeanu et al. (2003) | This work | |
| 0.2 | 0.784 | 0.126 | 4.760 | 0.672 |
| 0.4 | 0.794 | 0.130 | 4.719 | 0.681 |
| 0.6 | 0.844 | 0.167 | 4.726 | 0.722 |
| 0.8 | 0.915 | 0.311 | 4.664 | 0.786 |
| 1.0 | 0.993 | 0.483 | 4.610 | 0.855 |
| 1.5 | 1.187 | 0.542 | 4.479 | 1.044 |
| 2.0 | 1.397 | 0.621 | 4.327 | 1.262 |
| 2.5 | 1.605 | 0.846 | 4.169 | 1.495 |
| 3.0 | 1.795 | 1.142 | 4.035 | 1.714 |
| 3.5 | 1.961 | 1.453 | 3.941 | 1.927 |
| 4.0 | 2.106 | 1.735 | 3.868 | 2.106 |
| 5.0 | 2.343 | 2.217 | 3.809 | 2.422 |
| 6.0 | 2.500 | 2.515 | 3.804 | 2.638 |
| 8.0 | 2.664 | 2.808 | 3.821 | 2.856 |
| 10.0 | 2.752 | 2.962 | 3.800 | 2.981 |
The different potentials predict reaction rates which deviate up to a factor of 8. In the typical temperature window for the p process, the reaction rates obtained by using the optical potential derived from the elastic scattering predict in average a rate which is around 50% higher than that of Rauscher (2003), remaining very close to the values from McFadden and Satchler McFadden and Satchler (1966).
V Summary
We have measured the elastic scattering cross section of 112,124Sn(,)112,124Sn at energies = 19.5 MeV and 14.4 MeV. The data have been compared to various global –nucleus potentials . The potentials from Demetriou et al. (2002) and Avrigeanu et al. (2003) provide a satisfactory description of the elastic scattering data, in contrast to the potentials from McFadden and Satchler (1966) and Rauscher (2003), which deviate considerably from the measured angular distributions. None of the global potentials is able to reproduce the ratio between the cross sections on the proton- and neutron-rich tin isotopes. Consequently, any extrapolation to –nucleus potentials for unstable neutron–deficient nuclei on the p process path remains uncertain.
The present analysis performed within the OM framework provided a remarkable reproduction of the measured angular distributions. It has been used in the analysis of literature data at different energies Burtebaev et al. (1990); Bespalova et al. (1992); Badawy et al. (1978). The results fit well with the systematic behavior of –nucleus folding potentials.
Most of the global –nucleus potentials (with the exception of Avrigeanu et al. (2003)), as well as the potential obtained from the OM analysis, describe the few existing 112Sn(,)116Te cross section data points well; however, the energy dependence of the astrophysical S-factor is not well determined from the theoretical predictions. The resulting stellar rates for the 112Sn(,)116Te as well as 116Te (,)112Sn reactions deviate in the energy region considered for p process calculations by up to a factor of 8.
The present data provide an excellent tool to test the behaviour of global –nucleus potentials. Additional elastic scattering experiments are needed in the p process mass range at energies around the Coulomb barrier.
Acknowledgements.
We would like to thank the cyclotron team of ATOMKI for the excellent beam during the experiment. Two of us (D. G., P. M.) gratefully acknowledge the kind hospitality at ATOMKI. We thank N. T. Burtebayev and O. Bespalova for providing the numerical data for Refs. Burtebaev et al. (1990) and Bespalova et al. (1992), respectively. We also thank M. Howard for reading the manuscript carefully. This work was supported by DFG (SFB634 and FOR 272/2-2) and OTKA (T034259, T042733, F043408, D048283). T. R. is supported by the Swiss NSF (grants 2024-067428.01, 2000-061031.02, 2000-105328). Zs. F. and Gy. Gy. acknowledge support from a Bolyai grant.References
- Burbidge et al. (1957) E. Burbidge, G. Burbidge, W. Fowler, and F. Hoyle, Rev. Mod. Phys. 29, 547 (1957).
- Woosley and Howard (1978) S. E. Woosley and W. M. Howard, Astrophys. J. Suppl. 36, 285 (1978).
- Langanke and Wiescher (2001) K. Langanke and M. Wiescher, Rep. Prog. Phys. 64, 1657 (2001).
- Rauscher et al. (2002) T. Rauscher, A. Heger, R. D. Hoffman, and S. E. Woosley, Astrophys. J. 576, 323 (2002).
- Arnould and Goriely (2003) M. Arnould and S. Goriely, Phys. Rep. 384, 1 (2003).
- Costa et al. (2000) V. Costa, M. Rayet, R. A. Zappalà, and M. Arnould, Astron. Astroph. 358, 67 (2000).
- Rapp (2004a) W. Rapp, Report FZKA 6956, Forschungszentrum Karlsruhe (2004a).
- Rauscher (2005) T. Rauscher, Nucl. Phys. A (2005), in press.
- Hauser and Feshbach (1952) W. Hauser and H. Feshbach, Phys. Rev. 87, 366 (1952).
- Rauscher and Thielemann (1998) T. Rauscher and F.-K. Thielemann, in Stellar Evolution, Stellar Explosions and Galactic Chemical Evolution. Proceedings of the Second Oak Ridge Symposium on Atomic and Nuclear Astrophysics, 1997, edited by A. Mezzacappa (IOP, Bristol, 1998), p. 519.
- Goriely (2000) S. Goriely, in 10th Int. Symp. Capture Gamma-Ray Spectroscopy, edited by S. Wender (AIP Conference Proceedings 529, 2000), p. 287.
- Rauscher and Thielemann (2001) T. Rauscher and F.-K. Thielemann, At. Data Nucl. Data Tables 79, 47 (2001).
- Rauscher and Thielemann (2004) T. Rauscher and F.-K. Thielemann, At. Data Nucl. Data Tables 88, 1 (2004).
- Fülöp et al. (1996) Z. Fülöp, A. Z. Kiss, E. Somorjai, C. E. Rolfs, H. P. Trautvetter, T. Rauscher, and H. Oberhummer, Z. Phys. A 355, 203 (1996).
- Rapp et al. (2002) W. Rapp, M. Heil, D. Hentschel, F. Käppeler, R. Reifarth, H. J. Brede, H. Klein, and T. Rauscher, Phys. Rev. C 66, 015803 (2002).
- Özkan et al. (2002) N. Özkan, A. S. J. Murphy, R. N. Boyd, A. L. Cole, M. Famiano, R. T. Güray, M. Howard, L. Şahin, J. J. Zach, R. deHaan, et al., Nucl. Phys. A710, 469 (2002).
- Somorjai et al. (1998) E. Somorjai, Z. Fülöp, A. Z. Kiss, C. E. Rolfs, H. P. Trautvetter, U. Greife, M. Junker, S. Goriely, M. Arnould, M. Rayet, et al., Astron. Astroph. 333, 1112 (1998).
- Mohr et al. (1997) P. Mohr, T. Rauscher, H. Oberhummer, Z. Máté, Z. Fülöp, E. Somorjai, M. Jaeger, and G. Staudt, Phys. Rev. C 55, 1523 (1997).
- Rauscher et al. (1995) T. Rauscher, F.-K. Thielemann, and H. Oberhummer, Astrophys. J. 451, L37 (1995).
- Fülöp et al. (2001) Z. Fülöp, G. Gyürky, Z. Máté, E. Somorjai, L. Zolnai, D. Galaviz, M. Babilon, P. Mohr, A. Zilges, T. Rauscher, et al., Phys. Rev. C 64, 065805 (2001).
- Máté et al. (1989) Z. Máté, S. Szilágyi, L. Zolnai, A. Bredbacka, M. Brenner, K.-M. Källmann, and P. Manngård, Acta Phys. Hung. 65, 287 (1989).
- McFadden and Satchler (1966) L. McFadden and G. R. Satchler, Nucl. Phys. 84, 177 (1966).
- Demetriou et al. (2002) P. Demetriou, C. Grama, and S. Goriely, Nucl. Phys. A707, 253 (2002).
- Avrigeanu et al. (2003) M. Avrigeanu, W. von Oertzen, A. J. M. Plompen, and V. Avrigeanu, Nucl. Phys. A723, 104 (2003).
- Rauscher (2003) T. Rauscher, Nucl. Phys. A719, 73c; Erratum: Nucl. Phys. A725 (2003) 295 (2003).
- Kobos et al. (1984) A. M. Kobos, B. A. Brown, R. Lindsay, and G. R. Satchler, Nucl. Phys. A425, 205 (1984).
- Satchler and Love (1979) G. R. Satchler and W. G. Love, Phys. Rep. 55, 183 (1979).
- Abele and Staudt (1993) H. Abele and G. Staudt, Phys. Rev. C 47, 742 (1993).
- Atzrott et al. (1996) U. Atzrott, P. Mohr, H. Abele, C. Hillenmayer, and G. Staudt, Phys. Rev. C 53, 1336 (1996).
- de Vries et al. (1987) H. de Vries, C. W. de Jager, and C. de Vries, At. Data Nucl. Data Tables 36, 495 (1987).
- Mohr (2000) P. Mohr, Phys. Rev. C 61, 045802 (2000).
- Galaviz (2004) D. Galaviz, Ph.D. thesis, Technische Universität Darmstadt (2004).
- Rauscher (1998) T. Rauscher, in Proc. IX Workshop on Nuclear Astrophysics, edited by W. Hillebrandt and E. Müller (MPA, Garching, 1998), pp. 84; nucl–th/0007070.
- Burtebaev et al. (1990) N. T. Burtebaev, K. A. Kuterbekov, and I. N. Kukhtina, Sov. J. Nucl. Phys. 51, 827 (1990).
- Bespalova et al. (1992) O. V. Bespalova, E. A. Romanovskij, N. G. Gorjaga, N. M. Kha, B. S. Galakhmatova, L. M. Rafu, S. I. Fedoseev, D. Lam, and A. Belal, Yad. Fiz. 56, 113 (1992).
- Badawy et al. (1978) I. Badawy, B. Berthier, P. Charles, M. Dost, B. Fernandez, J. Gastebois, and S. M. Lee, Phys. Rev. C 17, 978 (1978).
- Rauscher and Thielemann (2000) T. Rauscher and F.-K. Thielemann, At. Data Nucl. Data Tables 75, 1 (2000).
- Mohr et al. (2003) P. Mohr, M. Babilon, D. Galaviz, K. Sonnabend, K. Vogt, and A. Zilges, Nucl. Phys. A719, 90c (2003).
- Rapp (2004b) W. Rapp, private communication (2004b).