The Formation of Fossil Galaxy Groups in the hierarchical Universe
Abstract
We use a set of twelve high-resolution N-body/hydrodynamical simulations in the CDM cosmology to investigate the origin and formation rate of fossil groups (FGs), which are X-ray bright galaxy groups dominated by a large elliptical galaxy, with the second brightest galaxy being at least two magnitudes fainter. The simulations invoke star formation, chemical evolution with non-instantaneous recycling, metal dependent radiative cooling, strong star burst driven galactic super winds, effects of a meta-galactic UV field and full stellar population synthesis. We find an interesting correlation between the magnitude gap between the first and second brightest galaxy and the formation time of the group. It is found that FGs have assembled half of their final dark matter mass already at , and subsequently typically grow by minor merging only, wheras non-FGs on average form later. The early assembly of FGs leaves sufficient time for galaxies of to merge into the central one by dynamical friction, resulting in the large magnitude gap at . A fraction of 3316% of the groups simulated are found to be fossil, whereas the observational estimate is 10-20%. The FGs are found to be X-ray over-luminous relative to non-FGs of the same optical luminosity, in qualitative agreement with observations. Finally, from a dynamical friction analysis is found that only because infall of galaxies happens along filaments with small impact parameters do FGs exist at all.
Subject headings:
cosmology: observations – cosmology: – dark matter – galaxies: clusters: general – galaxies: formation1. Introduction
Galaxy groups represent the natural environment where galaxy mergers are expected to occur most frequently, because of the low velocity dispersion of the group galaxies compared to that in galaxy clusters, as well as the large galaxy number density. If merging is an efficient process within galaxy groups, then there may exist systems in which member galaxies merged to form a large elliptical type galaxy, surrounded by considerably smaller galaxies, for which the dynamical friction infall time exceeds a Hubble time. In the past a lot of work have been done to understand the formation and dynamical state and evolution of dense compact groups (Diaferio et al. 1994; 1995; Hernquist et al. 1995; Governato et al. 1996). Early numerical simulations of Barnes (1989) showed that compact group members can merge to form a large elliptical galaxy on timescales considerably less than the Hubble time. An observational counterpart to this, called ‘fossil groups’ was discovered by the ROSAT X-ray satellite (Ponman et al. 1994). The archetype is RXJ1340.6+4018 at = with a bright isolated elliptical galaxy of magnitude (=0.7) surrounded by an extended halo of X-ray emitting hot gas, and only much fainter satellite galaxies. A fossil group (FG) is defined as a group where a large elliptical galaxy (BG1) embedded in a X-ray halo dominates the bright end of the galaxy luminosity function, the second brightest group member (BG2) being at least 2 R-band magnitudes fainter (Jones et al. 2000, hereafter JPF00). FGs host nearly all “field” E galaxies brighter than (=0.5) (Vikhlinin et al. 1999, hereafter V99) and have mass-to-light ratios comparable to those of galaxy clusters, . Their X-ray luminosity is for a given X-ray temperature on average larger than for normal groups, such that they appear to fall on the extention of the cluster relation to lower temperatures (Jones et al. 2003, hereafter J03). With a number density of x Mpc-3-x, they are not rare: they constitute 10-20% of all clusters and groups with an X-ray luminosity greater than ergs-1 (J03, V99). The luminosity function of FGs shows a lack of L∗ galaxies although such groups have masses of typically 25% of the mass of Virgo cluster. Whereas the Virgo Cluster, e.g., contains six L∗ galaxies, FGs contain typically none, apart from the central, bright E galaxy. In terms of the cumulative substructure function, which is the number of objects with velocities greater than a specific fraction of the parent halo’s velocity, FGs like RXJ1340.6+4018 show substructure functions similar to the Milky Way and M31 rather than, e.g., Virgo (D’Onghia Lake 2004). Hence FGs are excellent probes for testing the present understanding of the cosmological structure formation, also because X-ray observations strongly indicate that they are well relaxed, virialized systems.
In this Letter we present the first attempt, based on self-consistent, cosmological simulations, to address the physical processes that lead to the formation of FGs.
2. THE CODE AND NUMERICAL EXPERIMENTS
We performed simulations of 12 galaxy group-sized dark matter haloes in the low-density, flat cold dark matter (CDM scenario) with =0.3, =0.7, H km s-1 Mpc-1=0.7 and =0.9. The simulations were performed using the TreeSPH code briefly described in Sommer-Larsen et al. (2005). The code incorporates the “conservative” entropy equation solving scheme of Springel & Hernquist 2002; chemical evolution with non-instantaneous recycling of gas and heavy elements tracing 10 elements (H, He, C, N, O, Mg, Si, S, Ca and Fe; Lia, Portinari & Carraro 2002a,b); atomic radiative cooling depending on gas metal abundance and a redshift dependent, meta-galactic UV field; continuing, strong galactic winds driven by star-bursts (SNII), optionally enhanced to mimic AGN feedback. A fraction of the energy released by SNII explosions goes initially into the ISM as thermal energy, and gas cooling is locally halted to reproduce the adiabatic super–shell expansion phase; a fraction of the supplied energy is subsequently (by the hydro code) converted into kinetic energy of the resulting expanding super-winds and/or shells.
The original dark matter (DM)-only cosmological simulation was run with the code FLY (Antonuccio et al. 2003), for a cosmological box of Mpc box side length. When re-simulating with the hydro-code, baryonic particles were “added” adopting a global baryon fraction of . The mass resolution was increased by up to 2048 times, and the force resolution by up to 13 times. The initial redshift for the cosmological run was =39. We randomly selected 12 groups for re-simulation. The only selection criterion was that the groups should have virial masses close to (within 10%) 1x10¹⁴ M⊙, where the virial mass is the mass at =0 inside the virial radius, defined as the region for which the average mass density is 337 times the average of the Universe. The corresponding virial radius is about 1.2 Mpc, and the virial (X-ray) temperature is about 1.5 keV. The purpose of this project was to study a cosmologically representative sample of groups, so no prior information about merging histories, was used in the selection of the 12 groups. Particle numbers were about 2.5-3x10⁵ SPH+DM particles at the beginning of the simulations increasing to 3-3.5x10⁵ SPH+DM+star particles at the end. A novelty was that each star-forming SPH particles of the initial mass is gradually turned into a total of 8 star-particles. This considerably improves the resolution of the stellar component. SPH particles, which have been formed by recycling of star-particles, will have an eigth of the original SPH particle mass — if such SPH particles are formed into stars, only one star-particle is created. As a result the simulations at the end contain star-particles of mass =3.1x10⁷ M⊙, SPH particles of masses =3.1x10⁷ and 2.5x10⁸ M⊙, and dark matter particles of =1.8x10⁹ M⊙. Gravitational (spline) softening lengths of 1.2, 1.2, 2.5 and 4.8 kpc, respectively, were adopted.
To test for numerical resolution effects one of the 12 groups was in addition simulated at eight times (4 for star-particles) higher mass and two times (1.6 for star-particles) higher force resolution, than the “standard” simulations, yielding star-particle masses =7.8x10⁶ M⊙, SPH particle masses =7.8x10⁶ and 3.1x10⁷ M⊙, dark matter particle masses =2.3x10⁸ M⊙, and gravitational (spline) softening lengths of 0.76, 0.76, 1.2 and 2.4 kpc, respectively. For this simulation particle numbers are 1.4x10⁶ SPH+DM particles at the beginning of the simulation increasing to 1.6x10⁶ SPH+DM+star particles at the end. In previous simulations of galaxy clusters (Romeo et al. 2005a,b, Sommer-Larsen et al. 2005) we have found that in order to get a sufficiently high ICM abundance a combination of a large value of and a fairly top-heavy initial mass function (IMF) has to be employed. We used for the present simulations:=0.8, an IMF of the Arimoto-Yoshii type.
3. RESULTS
For each of the twelve simulated galaxy groups we computed the luminosity function of the group member galaxies in the B, R, J and K bands (Romeo et al. 2005a). Our group sample is divided into two classes according to the magnitude of the R band gap between the brightest galaxy and the second brightest galaxy: FGs ( and non-FGs ().
A well known problem in the modelling of galaxy groups and clusters, is the development of late-time cooling flows with bases at the position of BG1 and associated, central star-formation rates, which are too large compared to observations. In calculating the optical properties of the group galaxies we correct in a crude way for this by removing all stars formed at the base of the cooling flow since redshifts = 2 or 1. Both redshifts correspond to times well after the bulk of the group stars have formed. The correction amounts to 20-40% in terms of numbers of BG1 stars. Using = 2 or 1 results in minor differences, so we adopt =2 in this paper — for further discussion of this point see Sommer-Larsen et al. (2005). In cases where a similar correction of BG2 is appropriate (typically for non fossil groups, where BG2 enters into the main dark matter halo fairly late, 0.5) such a correction is applied to BG2. These corrections are quite minor, 10% in terms of numbers of stars.
Figure 1 shows the composite group luminosity function (LF) for the 4 FGs (triangles) and 8 non-FGs (pentagons) of our sample, adopting a bin size of one magnitude. The large magnitude gap between the brightest galaxy and the second brightest galaxy is clear from this figure for the FGs compared to the absense of a gap for the non-FGs. The observational LF (shown with stars) is taken from JPF00. The shape of the LF at the bright end, and the typical number of member galaxies of our FGs is consistent with the observations to our resolution limit of (see below). Note though, that the LF of RXJ1340.6+4018 (JPF00) is only photometric, so a LF with members spectroscopically confirmed (Mendez de Oliveira et al. 2005) would enable a more fair comparison.
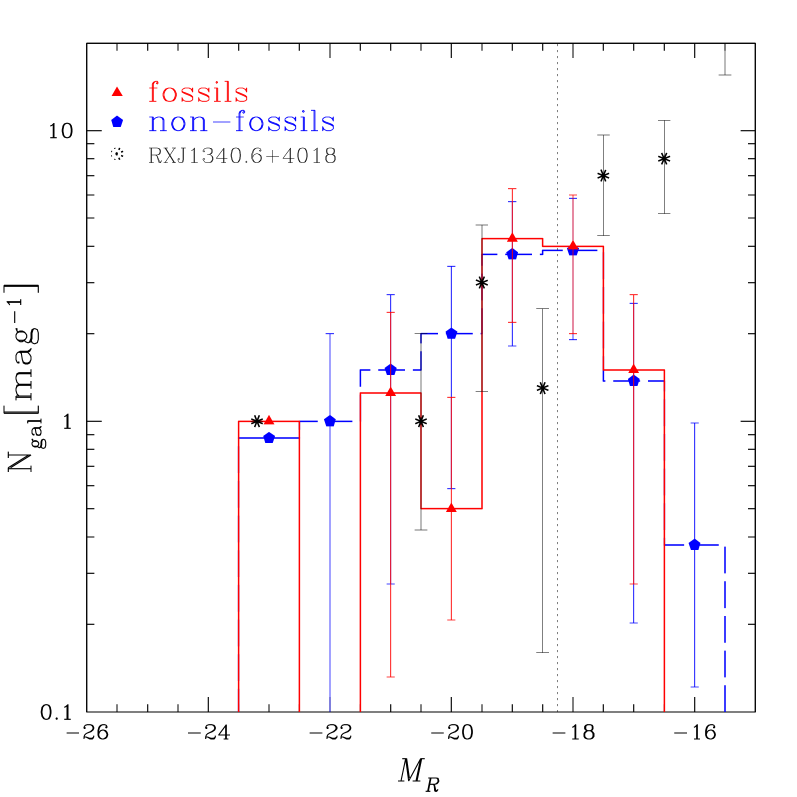
In order to test how resolution affects our results we carried out one comparison simulation at higher resolution (Sec.2). The agreement between the luminosity functions of the “standard” and higher resolution run is excellent above the resolution limit of the normal resolution run, , as will be discussed in D’Onghia et al. (2005, paper II - see also Romeo et al. 2005a for details).
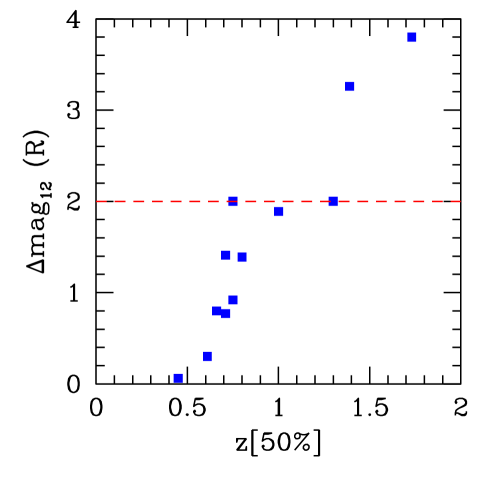
Figure 2 displays an interesting correlation between formation time of the group, defined as the epoch at which 50% of the system’s final virial mass is assembled, and the magnitude gap . This correlation indicates that FGs are systems formed at z1, and evolved relatively quietly until the present epoch, whereas non-fossil groups are generally late forming. The earlier a galaxy group is assembled, the larger is the magnitude gap in the R band, , at =0.
A characteristic feature of observed FGs is an excess of X-ray luminosity with respect to “normal” galaxy groups of the same optical luminosity. This feature is reproduced in our simulations: the FGs with mean optical luminosity Lx L⊙ have Lx erg whereas the non-FGs with Lx L⊙ have median X-ray luminosity Lx erg showing a clear offset between the typical X-ray luminosity of FGs compared to non-FGs, in qualitative agreement with observations. The reason for this is likely that as the simulated FGs are systems which form early, gas in the inner regions has more time to cool, relative to non-FGs, resulting in stronger central cooling flows, and hence higher X-ray luminosities. Note, however, that stronger than observed cooling flows at late times occur in general at the centers of the simulated groups. This results in low central gas entropies and X-ray luminosities about a factor of 3 larger than observed. Similar offsets are found for the LX-TX relation of simulated galaxy clusters, when an IMF of the Arimoto-Yoshii type is adopted (Romeo et al. 2005b).
4. DISCUSSION
We have found a correlation between the magnitude gap between the BG1 and BG2 and the formation time of the dark halo of the groups considered. What is the origin of the large magnitude gap at the bright end of the LF of FGs? In Figure 3 we show the evolution with redshift of the stellar mass of BG1 and the second brightest galaxy at any given time, BG2, for a FG and a non-FG from our sample. At late times (1) the “magnitude” gap in the FG increases due to minor merging/stripping. We interpret this result as follows: since the dark halo is assembled at , there is plenty of time for the BG2s to first be tidally stripped during close passages to the BG1 and finally merge into the BG1, by dynamical friction. Note that in Figure 3 for the FG the BG2 is the second brightest object at each output time. At z=2.2 the BG2 at that time merges into the BG1. The last major merger of the BG2 into BG1 occurs at z=1.4 (see arrows in Figure 3).
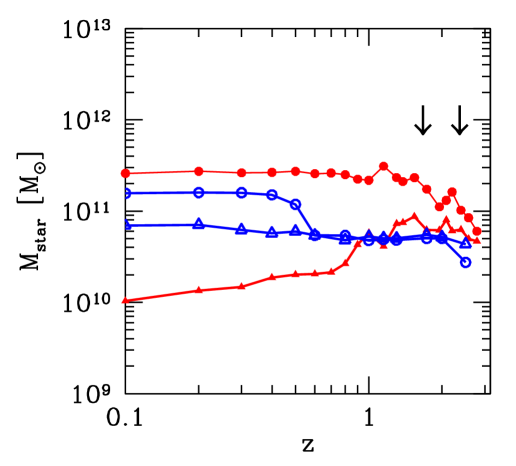
For the non-FG, the stellar mass of both BG1 (empty circles in Figure 3) and BG2 (empty triangles) mostly increases with time till =0. In this case the final halo assembles its mass fairly recently, and the two largest, more similar sized galaxies have not had time to merge.
We now analyze whether the fossil group phenomenon can be explained by dynamical friction effects. First, we compute the time it takes for a satellite galaxy moving in a main dark matter halo to be accreted into the central region of the halo: we assume singular isothermal sphere models for both the main halo and the satellite, with characteristic circular velocities of VH and VS. If we assume that the satellite initially moves in a circular orbit (one can show that this gives the minimum infall timescale for a given initial impact parameter) at a speed and initial radius , and that is considerably larger than the dynamical timescale, the satellite will feel a small torque which slowly reduces its orbital angular momentum, keeping the orbit almost circular while it spirals towards the centre of the halo:
| (1) |
denoting the specific angular momentum of the satellite, its orbital radius and the drag acceleration opposed to the direction of motion. The latter can be expressed by (e.g., Binney & Tremaine 1987):
| (2) |
where , , is the mass of the satellite, the (mainly dark) matter density, and the Coulomb logarithm, which from numerical simulations is found to be .
The radius of the satellite halo is set by tidal truncation , where M is the mass of the main halo inside of . For a isothermal sphere model we have and , inserting these equations and eq.(2) in eq.(1) we obtain:
| (3) |
for =1.5. Hence, an L∗ satellite (km/s) being deposited as close as 100 kpc from the BG1 (given that the group virial radius at =0 is 1.2 Mpc) within a group of km/s (corresponding to a virial mass of M⊙) on a low-eccentricity orbit has an infall time comparable to the Hubble time. It then at first seems puzzling that fossil groups exist at all. However, the infall time is proportional to , and as will be discussed in paper II in the simulations infall happens along filaments with initial impact parameters as small as 5-10 kpc — this makes infall times of L∗ galaxies less than the Hubble time, and is the main reason why fossil groups exist. If the early merging history is responsable of the formation of fossil groups, why are there no clusters with a similar lack of galaxies as a result of cosmic variance? As characteristic initial impact parameters scale linearly with VH, fixing VS we obtain . For a typical rich cluster V km/s, so it follows that the typical infall time for a L∗ galaxy will be 10-30 larger than in groups. Hence massive galaxies have had no time to merge with the central object yet.
Given that merging is such an important ingredient in FG formation, we check that merger rates are correctly estimated. When calculating the optical luminosities of the BG1s (and in some cases also BG2s) we correct for the effect of late time cooling flows by not including stars formed later than =2 at the base of the cooling flow. These stars will, however, still contribute to the gravitational field of BG1, which might lead to an increase of the merger rate. To test for this we ran one simulation, where star particles formed at the base of the cooling flow (at BG1) were removed entirely from the simulation. This did not lead to any significant change of the merger rates. Moreover, as discussed above, analysis of our high-resolution run indicates that our simulations are not affected by “over-merging”.
Our work shows that in the hierarchical structure formation scenario FG halos assemble earlier then non-FG halos, and they preferentially reside fairly isolated in low-density environments. Once the halos assembled 50% of their final mass, they evolve quiesciently. Consequently, they experience only little late infall of galaxies that could stop merging and fill the magnitude gap of the LF again.
We now consider the regions around the two FGs with the largest magnitude gaps, , compared to the regions around the non-FGs: between 2 and 5 Mpc, the region around FGs shows a total matter density in units of the mean of the Universe at z=0, , whereas the region around non-FG halos has . So the region within 5 Mpc around FGs is found to be of lower density (at about the 3- level), compared to non-FGs. For the region Mpc, the corresponding numbers are and , so the region around the FGs is again underdense with respect to that of the non-FGs (at about the 2- level). From R10 Mpc and outwards there is no statistically significant difference between the environments and the two types of groups. This prediction can be observationally tested. If FGs are X-ray emitting systems in place already at z=1, they might be observed with similar techniques used to discover high-redshift galaxy-clusters (Mullis et al. 2005). Once the extended X-ray source is identified in the XMM-Newton archive, subequent VLT multi-object spectroscopy combined with optical/NIR imaging could reveal the possible presence of FGs at high redshift. Furthermore, the correlation function of X-ray emitting galaxy groups cross-correlated with galaxies in the nearby universe, e.g. from SDSS data, could be used to test whether FGs preferentially populate low-density regions of the Universe.
Of our 12 simulated groups, 4 become FGs corresponding to a fraction of 3316%, larger but still comparable to the observational estimate of 10-20%, although the sample of simulations and observational data is statistically limited.
We are grateful to the referee for valuable suggestions and to F. van den Bosch, G. Lake, D. Pierini and T.Ponman for discussions.
References
- Antonuccio (2003) Antonuccio-Delogu V., Becciani U., Ferro D., 2003, Comput. Phys. Commun., 155, 159
- Barnes (1989) Barnes, J. 1989, Nature, 338, 123
- Binney (1987) Binney, J., Tremaine, S. 1987, Galactic Dynamics, Princeton Univ. Press, Princeton
- Diaferio (1994) Diaferio, A., Geller, M. Ramella, M. 1994, AJ, 107, 868
- Diaferio (1995) Diaferio, A., Geller, M. Ramella, M. 1995, AJ, 109, 2293
- D’Onghia (2004) D’Onghia, E. Lake, G. 2004, ApJ, 612, 628
- D’Onghia (2005) D’Onghia, E. et al. 2005, in preparation (paper II)
- Governato (1996) Governato, F., Tozzi, P. Cavaliere, A. 1996, ApJ, 458, 18
- Hernquist (1995) Hernquist, L., Katz, N. Weinberg, D.H. 1995, ApJ, 442, 57
- Jones (2000) Jones, L. R., Ponman, T. J., Forbes, D. A. 2000, MNRAS, 312, 139 (JPF00)
- Jones (2003) Jones, L.R., Ponman, T.J., Horton, A., Babul, A., Ebeling, H., Burke, D.J. 2003, MNRAS, 343, 627 (J03)
- Lia (2002a) Lia, C., Portinari, L., Carraro, G. 2002, MNRAS, 330, 821
- Lia (2002b) Lia, C., Portinari, L., Carraro, G. 2002, MNRAS, 335, 864
- Mendez (2005) Mendez de Oliveira, C. et al. 2005, AJ, submitted
- Mullis (2005) Mullis, C.R. et al. 2005, ApJ, 623, L85
- Ponman (1994) Ponman, T.J. et al. 1994, Nature, 369, 462
- Romeo (2005) Romeo, A. D., Portinari, L., Sommer-Larsen, J. 2005a, MNRAS, submitted
- Romeo (2005) Romeo, A. D., Sommer-Larsen, J., Portinari, L., Antonuccio, V. 2005b, MNRAS, to be submitted
- Sommer-Larsen (2005) Sommer-Larsen, J., Romeo, A. D., Portinari, L. 2005, MNRAS, 357, 478
- Springel (2002) Springel, V. Hernquist, L. 2002, MNRAS, 333, 649
- Vikhlinin (1999) Vikhlinin, B.R. et al. 1999, ApJ, 520, L1, (V99)